. 2024 Jun;16(3):e13260.
doi: 10.1111/1758-2229.13260.

Paracoccus kondratievae produces poly(3-hydroxybutyrate) under elevated temperature conditions

Affiliations

Paracoccus kondratievae produces poly(3-hydroxybutyrate) under elevated temperature conditions

Radwa Moanis et al. Environ Microbiol Rep. 2024 Jun.

Abstract

As part of ongoing efforts to discover novel polyhydroxyalkanoate-producing bacterial species, we embarked on characterizing the thermotolerant species, Paracoccus kondratievae, for biopolymer synthesis. Using traditional chemical and thermal characterization techniques, we found that P. kondratievae accumulates poly(3-hydroxybutyrate) (PHB), reaching up to 46.8% of the cell's dry weight after a 24-h incubation at 42°C. Although P. kondratievae is phylogenetically related to the prototypical polyhydroxyalkanoate producer, Paracoccus denitrificans, we observed significant differences in the PHB production dynamics between these two Paracoccus species. Notably, P. kondratievae can grow and produce PHB at elevated temperatures ranging from 42 to 47°C. Furthermore, P. kondratievae reaches its peak PHB content during the early stationary growth phase, specifically after 24 h of growth in a flask culture. This is then followed by a decline in the later stages of the stationary growth phase. The depolymerization observed in this growth phase is facilitated by the abundant presence of the PhaZ depolymerase enzyme associated with PHB granules. We observed the highest PHB levels when the cells were cultivated in a medium with glycerol as the sole carbon source and a carbon-to-nitrogen ratio of 10. Finally, we found that PHB production is induced as an osmotic stress response, similar to other polyhydroxyalkanoate-producing species.


Conflict of interest statement

The authors decalre no conflicts of interest.

Figures
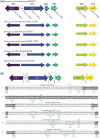
FIGURE 1
FIGURE 1
Genotypic indication for PHA production in P. kondratievae. (A) Schematic representation of the genetic organization of PHA‐related genes in P. kondratievae BJQ0001, including gene numbers and amino acid sequence identities with homologues in P. denitrificans PD1222. Below, gene syntenies of the corresponding PHA gene clusters in selected Paracococcus strains are schematically represented, based on an analysis in SyntTax (Oberto, 2013). (B) In silico analysis of the transcriptional structure of the PHA gene clusters in P. kondratievae. Nucleotide sequences of intergenic regions are depicted, with indication of translational start and stop codons (boxed in purple), putative −10 and −35 promoter elements (boxed in green) and putative transcription start sites (TSSs) (region boxed in green, TSS indicated with a red arrow). Coding regions are shaded in grey, while the length of the intergenic region is mentioned. For the phaP‐phaR intergenic region, only the part immediately upstream of phaR is shown, while the length of the total intergenic region is mentioned. The BPROM algorithm was used for predicting −10 and −35 boxes, with the prediction scores mentioned below the boxes in italics. TSSs were predicted manually based on their spacing with the −10 box.
FIGURE 2
FIGURE 2
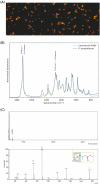
Chemical and thermal analysis of PHA extracted from P. kondratievae. (A) Nile Red stained cells of P. kondratievae NCIMB13773 cells visualized with fluorescence microscopy. (B) FTIR spectrum of the extracted PHA sample as compared to that of commercial PHBV as a reference. Characteristic PHA peaks are indicated by their respective wavenumber. (C) GC–MS analysis of the extracted polymer. Top: GC chromatogram of the extracted PHA sample. The x‐axis represents the retention time and the y‐axis depicts a quantitative presentation of the number of molecules with the same retention time. The peak with a retention time of 6.200 min, indicated in purple letter type, is hypothesized to be PHB as this is the characteristic retention time. Bottom: MS spectrum of the main peak with retention time 6.2 min; x‐axis: relative mass of the charged cation compound (m/z); y‐axis: relative intensity of the occurrence of cations formed during fragmentation at the start of MS. At the top‐right corner, a 3‐(trimethylsilyl)‐methyl ester derived of a 3HB monomer is displayed. The most important peaks on the graph are indicated with a letter that correspond to a specific fragment of the 3‐(trimethylsilyl)‐methyl ester.
FIGURE 3
FIGURE 3
Temperature and time dependence of growth and PHB production in P. kondratievae and P. denitrificans. (A) FL/OD values, OD600 values and growth rates were determined for flask cultures of P. kondratievae NCIMB13773 and P. denitrificans DSM413. (A) Fluorescence and OD600 values were measured at time points 10 h (corresponding to exponential growth phase) and 24 h (corresponding to stationary growth phase). Growth rates were calculated for the growth curve segments representing exponential growth. (B) FL/OD and OD600 values measured for P. denitrificans and P. kondratievae flask cultures during stationary growth phase at specified time points. Cultivation was performed at 42°C for P. kondratievae NCIMB13773 and at 30°C for P. denitrificans DSM413. Statistical significance was calculated using a paired t‐test (*p < 0.05; **p < 0.01; ***p < 0.001).
FIGURE 4
FIGURE 4
Effect of C/N ratio on PHB production by P. kondratievae NCIMB13773. Cultivation was performed in MSM with glycerol (A), sodium gluconate (B) or glucose (C) as a sole carbon source and cells were harvested after 24 h of growth. Corresponding data are presented in Table S1 and results of statistical tests in Supplementary Dataset S2.
FIGURE 5
FIGURE 5
Effect of NaCl concentration on growth and PHA accumulation. This experiment was performed for (A) P. kondratievae cultivated in TSB medium and (B) P. denitrificans cultivated in LB medium. Samples were analysed after 72 h. A statistical analysis could not be performed for these data because duplicate measurements were performed. (C) Bottom‐view picture taken of cultures of P. kondratievae cultivated on TSB medium (left) and TSB + 5% NaCl (5%), with indication of cell aggregates for the latter.

Similar articles

References

    1. An, J. , Ha, B. & Lee, S.K. (2023) Production of polyhydroxyalkanoates by the thermophile Cupriavidus cauae PHS1. Bioresource Technology, 371, 128627. - PubMed
    1. Baes, R. , Lemmens, L. , Mignon, K. , Carlier, M. & Peeters, E. (2020) Defining heat shock response for the thermoacidophilic model crenarchaeon Sulfolobus acidocaldarius . Extremophiles, 24, 681–692. - PubMed
    1. Bordel, S. , van Spanning, R.J.M. & Santos‐Beneit, F. (2021) Imaging and modelling of poly(3‐hydroxybutyrate) synthesis in Paracoccus denitrificans . AMB Express, 11, 113. - PMC - PubMed
    1. Brandl, H. , Gross, R. , Lenz, R. & Fuller, R. (1988) Pseudomonas oleovorans as a source of poly(beta‐hydroxyalkanoates) for potential applications as biodegradable polyesters. Applied and Environmental Microbiology, 54, 1977–1982. - PMC - PubMed
    1. Chavan, S. , Yadav, B. , Tyagi, R.D. & Drogui, P. (2021) A review on production of polyhydroxyalkanoate (PHA) biopolyesters by thermophilic microbes using waste feedstocks. Bioresource Technology, 341, 125900. - PubMed

Supplementary concepts