Comparative Study
. 2024 Jun 5;16(750):eadk7640.
doi: 10.1126/scitranslmed.adk7640. Epub 2024 Jun 5.

Comparative analysis of Bcl-2 family protein overexpression in CAR T cells alone and in combination with BH3 mimetics

Affiliations
Comparative Study

Comparative analysis of Bcl-2 family protein overexpression in CAR T cells alone and in combination with BH3 mimetics

Felix Korell et al. Sci Transl Med. .

Abstract

Approximately 50% of patients with hematologic malignancies relapse after chimeric antigen receptor (CAR) T cell treatment; mechanisms of failure include loss of CAR T persistence and tumor resistance to apoptosis. We hypothesized that both of these challenges could potentially be overcome by overexpressing one or more of the Bcl-2 family proteins in CAR T cells to reduce their susceptibility to apoptosis, both alone and in the presence of BH3 mimetics, which can be used to activate apoptotic machinery in malignant cells. We comprehensively investigated overexpression of different Bcl-2 family proteins in CAR T cells with different signaling domains as well as in different tumor types. We found that Bcl-xL and Bcl-2 overexpression in CAR T cells bearing a 4-1BB costimulatory domain resulted in increased expansion and antitumor activity, reduced exhaustion, and decreased apoptotic priming. In addition, CAR T cells expressing either Bcl-xL or a venetoclax-resistant Bcl-2 variant led to enhanced antitumor efficacy and survival in murine xenograft models of lymphoma and leukemia in the presence or absence of the BH3 mimetic venetoclax, a clinically approved BH3 mimetic. In this setting, Bcl-xL overexpression had stronger effects than overexpression of Bcl-2 or the Bcl-2(G101V) variant. These findings suggest that CAR T cells could be optimally engineered by overexpressing Bcl-xL to enhance their persistence while opening a therapeutic window for combination with BH3 mimetics to prime tumors for apoptosis.


Conflict of interest statement

Conflicts of Interest

FK and MVM are inventors on provisional patent applications on technologies described herein, held by Massachusetts General Hospital. MVM is an inventor on patents related to adoptive cell therapies, held by Massachusetts General Hospital (some licensed to Promab) and University of Pennsylvania (some licensed to Novartis). MVM has served as a consultant for multiple companies involved in cell therapies. MVM holds Equity in 2SeventyBio, Century Therapeutics, Neximmune, Oncternal, and TCR2 and serves on the Board of Directors of 2Seventy Bio. AL has consulted for and has received research support from AbbVie, Novartis, and Astra-Zeneca. He is an equity holder and co-founder of Flash Therapeutics, and an advisor for Dialectic Therapeutics, Zentalis Pharmaceuticals, and Anji Onco. All other authors have nothing to declare.

Figures

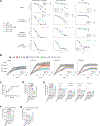
Figure 1.
Figure 1.. CAR T cells overexpressing Bcl-2 family proteins are feasible to produce and kill target cells.
A. Schematic of the inhibitory mechanisms of BH3 mimetics ABT-199 (selective Bcl-2 inhibitor), ABT-263 (Bcl-2, Bcl-xL, Bcl-w inhibitor), and AZD5991 (selective Mcl-1 inhibitor) and their influence on the intrinsic apoptosis cascade. B. Construct designs for 4–1BB and CD28 anti-CD19 control and overexpression CAR T cells. The following proteins were overexpressed: Bcl-2 (wildtype), Bcl-2 (G101V mutation), Bcl-xL (wildtype), or Mcl-1 (wildtype). C. Assessment of gene expression level by real-time PCR in primary human T cells transduced with the control and overexpression constructs. Dots represent technical replicates from one normal donor; bars represent means + standard deviation. ***p<0.001 for overexpression CAR T cells compared to control CAR T cells as measured by two-sided Student’s t test. D. Bcl-2, Bcl-xL, and Mcl-1 protein expression in all tested CAR T cells from one normal donor, as determined by Western blotting, with beta-actin expression serving as the loading control. E. Histograms of Bcl2-family protein expression in CAR T cells as measured by intracellular staining (Alexa Fluor 488) via flow cytometry from one normal donor. CAR T cells were first gated on mCherry positive fraction. Untransduced (UTD) T cells are ungated. F. Comparison of 4–1BB versus CD28 regular and overexpression anti-CD19 CAR T cell cytotoxicity against JeKo-1 and Nalm6 cells assessed by a luciferase-based killing assay for 16 hours at a 1:1 effector-to-target ratio. Dots represent mean ± SEM of two to three technical replicates from two separate normal donors. The black bar indicates the median of all CAR T cell cytotoxicity based on their costimulatory domain. *p<0.05, **p<0.01 for the median % killing of all 4–1BB CAR T cells compared to CD28 CAR T cells for each tumor cell line by two-sided Student’s t test. BH3 = Bcl-2 homology domain 3. SEM = standard error of mean. A & B were created with Biorender.com.
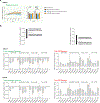
Figure 2.
Figure 2.. Bcl-2 family overexpression reduces CAR T cell apoptosis with or without the addition of BH3 mimetics, while BH3 profiling discovers lower levels of apoptotic priming in Bcl-xL CAR T cells.
A. Viability is reported as the percent of mCherry+ DAPI- cells as measured by flow cytometry. Dots represent mean ± SEM of two to three separate normal donors. *p<0.05, **p<0.01, ***p<0.001 for overexpression CAR T cells compared to control (4–1BB) with two-way ANOVA (Tukey post-hoc multiple comparison analysis). B. CAR T cell apoptosis with or without treatment with BH3 mimetics reported by Annexin V levels measured using the Promega Apoptosis assay (RLU, relative light units). Lines represent mean ± SEM of two technical replicates from two separate normal donors. *p<0.05, **p<0.01, ***p<0.001 for overexpression CAR T cells compared to control (4–1BB) with two-way ANOVA (Tukey post-hoc multiple comparison analysis). C. Cytochrome c release in Zombie-NiR- CD3+ (Suppl. Fig. 2G) control, Bcl-2, Bcl-2(G101V), Bcl-xL and Mcl-1 CAR T cells following exposure to Bim at various concentrations. MFIs were normalized using the equation shown in the methods. Data represent mean ± SD from two experimental replicates, each with two technical replicates. D. %Cytochrome C release following exposure to 0.03 μM Bim, E. 10 μM MS1, 10 μM Bad, 1 μM ABT-199, or 10 μM HRK in CAR T cells cultured for 48 hours in 20 IU/mL IL-2. Data represent mean ± SD from two experimental replicates, each with two technical replicates. Statistical significance was determined by two-sided Student’s t test. F-G. %Cytochrome C release following exposure to 0.1 μM Bim in CAR T cells cultured in IL-2 (F) or in coculture with Nalm6 cells (G). Data represent mean ± SD from four technical replicates. Statistical significance was determined by two-sided Student’s t test. BH3 = Bcl-2 homology domain 3. SEM = standard error of mean. SD = standard deviation. A was created with Biorender.com.
Figure 3.
Figure 3.. Bcl-2 family overexpression CAR T cells have higher expansion rates and anti-tumor activity in long-term in vitro stress setting against Nalm6 tumor cells.
Real-time cytotoxicity assays. A. Nalm6 tumor cells alone (tumor only) or treated with drugs (ABT-199, ABT-263, AZD5991). B. Real-time cytotoxicity assay of CAR T cells cocultured with JeKo-1 and Nalm6 target cells, respectively, at a 1:5 E:T ratio. Tumor expansion minimum, relative to control 4–1BB CAR, is shown as the total green area. Peak CAR T cell expansion, relative to control 4–1BB CAR, is shown by the total red area. Data represent two to three technical replicates from CAR T cells generated from two normal donors; bars represent means + standard deviation. *p<0.05, **p<0.01, ***p<0.001 for overexpression CAR T cells compared to control CAR T cells as measured by two-sided Student’s t test. B. Real-time cytotoxicity assay of CAR T cells cocultured with Nalm6 target cells at a 1:5 E:T ratio. Tumor growth is shown as the total green area relative to day 0 tumor seeding. CAR T cell expansion is shown by the total red area relative to day 0. Data represent two to three technical replicates from CAR T cells generated from two normal donors; bars represent means + standard deviation. *p<0.05, **p<0.01, ***p<0.001 for overexpression CAR T cells compared to control CAR T cells as measured by two-sided Student’s t test.
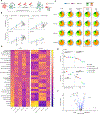
Figure 4.
Figure 4.. Bcl-xL overexpression CAR T cells have higher expansion and reduced exhaustion in long-term proliferation assays in vitro.
A. Schematic of a long-term proliferation (LTP) assay. CAR T cells co-cultured with irradiated CD19 expressing K562 cells at 1:1 ratio (5E5 cells) and re-challenged with new tumor cells all 7 days at the same 1:1 ratio. Drug treatment days 2, 4, and 6. B. LTP fold expansion at days 7 and 14 as fold change compared to day 0. Dots represent mean ± SEM of two technical replicates from two separate normal donors. *p<0.05, **p<0.01, ***p<0.001 for overexpression CAR T cells compared to control (4–1BB) at Day 14 with two-way ANOVA (Tukey post-hoc multiple comparison analysis). C. CAR T cells from LTP were assessed at day 14 for exhaustion marker profiling. Pie charts indicate the percent of cells expressing the indicated exhaustion markers of two technical replicates from two separate normal donors. D-F. A separate LTP was performed on CAR T cells treated with or without ABT-199. The CAR T cells were isolated by flow sorting on day 14. NanoString pathway (D.) and cell type (E.) analysis were performed on each condition. Data represent the average of three individual normal donors. For cell type analysis (E), *p<0.05, **p<0.01, ***p<0.001 amongst CAR T cell groups was measured by two-sided Student’s t test. F. Volcano plot of differentially expressed genes comparing 4–1BB control CAR T with Bcl-xL overexpressing 4–1BB CAR on day 14 of LTP. SEM = standard error of mean. A was created with Biorender.com
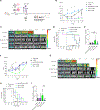
Figure 5.
Figure 5.. Bcl-xL overexpression CAR T cells prevent tumor growth and increase survival in lymphoma and leukemia models in vivo.
A–I., NSG mice were intravenously injected with JeKo-1 (B-E.) or Nalm6 (F-I.) as shown in (A). For both tumor cell lines, n=5 mice per group. Each experiment was performed twice, using CAR T cells produced from different healthy donors (with a total of 10 mice per group overall). B-C. Tumor growth was tracked by BLI. (B) Dots represent mean + SEM of all mice. ***p<0.001 for Bcl-xL and Mcl-1 CAR T cells compared to control at day 35 as measured by two-sided Student’s t test. (C) Representative BLI images from one experiment. D. Kaplan-Meier analysis of overall survival from both experiments, ***p<0.001 comparing control and Mcl-1 CAR T cells to tumor only and Bcl-2(G101V) and Bcl-xL measured by log-rank (Mantel–Cox test) for Kaplan–Meier curves. E. CAR T-cell persistence in the blood was determined on day 14 post-CAR injection via flow cytometry for CD3+mCherry+ cells. Dots represent individual mice from both experiments; bars represent means + SD. **p<0.01 amongst groups as measured by two-sided Student’s t test. F-I. Experiments described in B–E. were repeated using the Nalm6 tumor model. A was created with Biorender.com.
Figure 6.
Figure 6.. CAR T cells with double overexpression of Bcl-xL and Bcl-2(G101V) have higher apoptotic priming and do not outperform Bcl-xL CAR T cells in vivo.
A. Construct designs for 4–1BB CD19-CAR T cells with double-overexpression of Bcl-xL and Bcl-2(G101V). B. Assessment of gene expression level by real-time PCR in primary human T cells transduced with the control, single-, and double-overexpression constructs. Dots represent technical replicates from one donor; bars represent means + standard deviation. Non-significant (ns) for double-overexpression CAR T cells compared to single Bcl-2(G101V) and Bcl-xL CAR T cells as measured by two-sided Student’s t test. C. Cytochrome c release in Zombie-NiR- CD3+ (Suppl. Fig. 2F) CAR T cells following exposure to Bim at various concentrations, as described in Fig. 2C. MFIs were normalized using the equation shown in the methods. Data represent mean + SD from two experimental replicates, each with two technical replicates. D. Comparison of the 0.03 μM Bim data points from Fig. 6C. *p<0.05, ***p<0.001 as determined by two-sided Student’s t test. E–F. CAR T cells were cultured either in 20IU/mL IL-2 (E) or Nalm6 cells at an effector:target ratio of 1:3 (F) and BH3 profiling was performed as outlined in Fig. 2C. Data represent mean ± SD from four technical replicates. *p<0.05, **p<0.01, ***p<0.001 as determined by two-sided Student’s t test. G-K. NSG mice were intravenously injected with Nalm6 as shown in (G) with n=5 mice per group. The experiment was repeated twice using different healthy donors to make the CAR T cells (with a total of 10 mice per group overall). H-I. Tumor growth was tracked by BLI. ***p<0.001 comparing Bcl-xL or Bcl-xL/Bcl-2(G101V) CAR T cells to control as measured by two-sided Student’s t test. J. Kaplan-Meier curve of overall survival, *p<0.05, **p<0.01 amongst groups was measured by log-rank (Mantel–Cox test) for Kaplan–Meier curves. K. CAR T-cell persistence in the blood was determined on day 14 post-CAR T cell injection. Dots represent individual mice from both experiments; bars represent means + SD. Significance amongst CAR T cell groups was measured by two-sided Student’s t test. G was created with Biorender.com.
Figure 7.
Figure 7.. Bcl-xL overexpressing CAR T cells achieve long-term anti-tumor effects and increase overall survival in combination with ABT-199 (Venetoclax) in vivo.
A-F. NSG mice were intravenously injected with Nalm6 as shown in A. ABT-199 (100mg/kg) or vehicle control was administered by oral gavage 5 days a week for 5 weeks. n=5 mice per group using one healthy donor to generate the CAR T cells. B-C. Tumor growth was tracked by BLI. *p<0.05 amongst CAR T cell groups was measured by two-sided Student’s t test. D. Kaplan-Meier curve of overall survival, *p<0.05, and ***p<0.001 amongst groups was measured by log-rank (Mantel–Cox test) for Kaplan–Meier curves. E. CAR T-cell persistence in the blood over measured weekly for 5 weeks after injection. Dots represent mean ± SEM. **p<0.01, comparing Bcl-xL to Bcl-xL/Bcl-2(G101V) and ***p<0.001 comparing Bcl-xL or Bcl-xL/Bcl-2(G101V) to control CAR T cells as measured by two-sided Student’s t test at Day 35. F. CAR T-cell persistence in the blood was determined on day 14 post-CAR T cell injection. Dots represent individual mice from one healthy donors; bars represent mean + SD. *p<0.05, p<0.01, and ***p<0.001 amongst CAR T cell groups as shown, as measured by two-sided Student’s t test. SD = standard deviation. SEM = standard error of mean. A was created with Biorender.com.

References

    1. Locke FL, et al., Axicabtagene Ciloleucel as Second-Line Therapy for Large B-Cell Lymphoma. N Engl J Med, 2022. 386(7): p. 640–654. - PubMed
    1. Bishop MR, et al., Second-Line Tisagenlecleucel or Standard Care in Aggressive B-Cell Lymphoma. N Engl J Med, 2022. 386(7): p. 629–639. - PubMed
    1. FDA approves axicabtagene ciloleucel as second-line treatment for large-b-cell-lymphoma.
    1. FDA approves lisocabtagene maraleucel as second-line treatment for large-b-cell-lymphoma. - PubMed
    1. Chong EA, et al., Five-Year Outcomes for Refractory B-Cell Lymphomas with CAR T-Cell Therapy. N Engl J Med, 2021. 384(7): p. 673–674. - PubMed

Publication types