. 2024 Jun 7;10(23):eadk2693.
doi: 10.1126/sciadv.adk2693. Epub 2024 Jun 5.

Plasticity and lineage commitment of individual TH1 cells are determined by stable T-bet expression quantities

Affiliations

Plasticity and lineage commitment of individual TH1 cells are determined by stable T-bet expression quantities

Ahmed N Hegazy et al. Sci Adv. .

Abstract

T helper 1 (TH1) cell identity is defined by the expression of the lineage-specifying transcription factor T-bet. Here, we examine the influence of T-bet expression heterogeneity on subset plasticity by leveraging cell sorting of distinct in vivo-differentiated TH1 cells based on their quantitative expression of T-bet and interferon-γ. Heterogeneous T-bet expression states were regulated by virus-induced type I interferons and were stably maintained even after secondary viral infection. Exposed to alternative differentiation signals, the sorted subpopulations exhibited graded levels of plasticity, particularly toward the TH2 lineage: T-bet quantities were inversely correlated with the ability to express the TH2 lineage-specifying transcription factor GATA-3 and TH2 cytokines. Reprogramed TH1 cells acquired graded mixed TH1 + TH2 phenotypes with a hybrid epigenetic landscape. Continuous presence of T-bet in differentiated TH1 cells was essential to ensure TH1 cell stability. Thus, innate cytokine signals regulate TH1 cell plasticity via an individual cell-intrinsic rheostat to enable T cell subset adaptation to subsequent challenges.


Figures

Fig. 1.
Fig. 1.. In vivo–primed TH1 cells maintain plasticity toward the TH2 program.
(A to F) Naive LCMV-specific CD4+ Thy1.1+ cells were adoptively transferred into C57BL/6 mice, followed by LCMV infection. ns, not significant; *P < 0.05; **P < 0.01; ***P < 0.001; ****P < 0.0001. (A) Experimental scheme illustrating the adoptive cell transfer procedure and post-infection (p.i.) analysis time points. (B) Ten days after infection, expression of the indicated lineage-specifying transcription factors and signature cytokines were determined in splenic CD4+ Thy1.1+ donor cells by FACS. Geometric mean indices + SEM of T-bet (TH1), GATA-3 (TH2), RORγt (TH17), BCL6 (TFH), or FoxP3 (Treg) protein expression in CD4+ Thy1.1+ donor cells versus endogenous naive CD62Lhi CD44lo CD4+ Thy1.2+ T cells are shown. Dot plot shows IFN-γ and IL-4 expression after PMA/ionomycin stimulation of splenic CD4+ Thy1.1+ donor cells. (C) IL-4–induced STAT6 phosphorylation and total STAT6 protein levels in naive and effector splenic CD4+ Thy1.1+ donor cells. Geometric mean indices + SEM of pSTAT6 staining of IL-4–exposed versus untreated cells (left bars) and of total STAT6 staining versus isotype control staining (right bars) within CD4+ Thy1.1+ donor cells are depicted. Statistics: Mann-Whitney test. (D) Cytokine production of CD4+ Thy1.1+ donor cells treated as indicated was measured after stimulation for 24 hours with PMA/ionomycin using cytometric bead arrays. Statistics: Kruskal-Wallis test with Dunn’s multiple comparisons test. [(E) and (F)] GATA-3 and T-bet protein expression in reactivated CD4+ Thy1.1+ donor cells were determined by FACS. (F) Dot plot overlays illustrate GATA-3 and T-bet coexpression. GATA-3 relative protein expression, normalized to classic TH2 cells, is depicted (left bar graph). Relative increase in GATA-3 protein expression is plotted compared to levels of GATA-3 in naive T cells or TH1 cells (right bar graph). [(A) to (F)] Data are pooled from three independent experiments (n = 9).
Fig. 2.
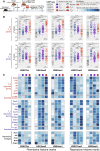
Fig. 2.. IL-4 drives in vivo–primed TH1 cells to acquire an additional TH2-like epigenetic imprint.
(A to C) Naive LCMV-specific CD4+ Thy1.1+ cells were adoptively transferred into C57BL/6 mice, which were subsequently infected with LCMV. Effector TH1 Thy1.1+ donor T cells were isolated on day 10 of infection and reactivated for two rounds of 4 days under neutral (anti–IL-4, anti–IL-12, and anti–IFN-γ) or TH2 (IL-4, anti–IL-12, and anti–IFN-γ) conditions. (A) Experimental scheme. [(B) and (C)] H3K27ac, H3K4me3, H3K4me1, H3K27me3, and H3K9me3 modifications of selected TH2 and TH1 genes are presented. (B) Z scores of all 87 TH2 or 93 TH1 genes of each respective histone modification of the different cell types are depicted. (C) Histone modifications in individual characteristic TH2 or TH1 signature genes in the cell types indicated at the top of the panels are plotted. The color coding depicts the z score value. A z score equal to 0 means that the score for a particular gene is the same as the mean for all conditions, while a z score of +1 indicates that the corresponding value is one SD above the mean. Statistics: Kruskal-Wallis test with Dunn’s multiple comparisons test; ns, not significant; *P < 0.05; **P < 0.01; ***P < 0.001; ****P < 0.0001. [(B) and (C)] Data represent one experiment with two independent biological replicates pooled from four to eight independent mice.
Fig. 3.
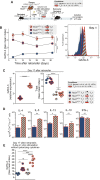
Fig. 3.. Type I IFNs restrain maximal GATA-3 induction in TH1 cells.
(A to F) Naive WT, Ifnar1−/−, Ifngr1−/−, and Tbx21−/− LCMV-specific CD4+ Thy1.1+ cells were adoptively transferred into C57BL/6 mice or Il12b−/− mice. Recipient mice were infected with LCMV. On day 10 after LCMV infection, CD4+ Thy1.1+ donor T cells were isolated, characterized, and reactivated for two rounds of 4 days under TH2 conditions. [(A) to (E)] Statistics: Kruskal-Wallis test with Dunn’s multiple comparisons test; ns, not significant; **P < 0.01; ***P < 0.001; ****P < 0.0001. (A) Experimental scheme. (B) T-bet protein expression was determined in splenic CD4+ Thy1.1+ donor cells by FACS on day 10 after infection. Geometric mean indices + SEM of T-bet staining within CD4+ Thy1.1+ donor T cells are depicted. [(C) and (D)] CD4+ Thy1.1+ donor T cells were analyzed by FACS for expression of the indicated surface molecules on day 10 after infection. [(E) and (F)] Geometric mean indices + SEM of GATA-3 within CD4+ Thy1.1+ donor T cells isolated directly after infection (day 10 after infection) or after reactivation for two rounds of 4 days under TH2 conditions. [(A) to (F)] Data are pooled from three independent experiments (n = 6 to 13).
Fig. 4.
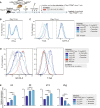
Fig. 4.. T-bet acts in a dose-dependent manner to stabilize the TH1 program and repress the TH2 program.
(A to E) Naive Tbx21+/+, Tbx21+/−, and Tbx21−/− LCMV-specific CD4+ Thy1.1+ cells were adoptively transferred into C57BL/6 mice. Recipient mice were infected with LCMV. [(A) to (E)] Statistics: Kruskal-Wallis test with Dunn’s multiple comparisons test; ns, not significant; *P < 0.05; **P < 0.01; ***P < 0.001; ****P < 0.0001. (A) After 10 days of infection, T-bet and GATA-3 protein expression were determined in splenic CD4+ Thy1.1+ donor cells by FACS. (B) Geometric mean indices + SEM of T-bet and GATA-3 staining within CD4+ Thy1.1+ donor T cells are depicted. IFN-γ production of CD4+ Thy1.1+ donor cells was measured upon restimulation of spleen cells with PMA/ionomycin (right bar graphs). Mean frequencies and geometric mean + SEM of IFN-γ+ cells within CD4+ Thy1.1+ donor cells are depicted. (C) RNA-seq analysis of selected 93 TH1 and 87 TH2 genes in in vivo–primed Tbx21+/+, Tbx21+/−, and Tbx21−/− LCMV-specific CD4+ Thy1.1+ cells after expansion in vitro under neutral conditions. Data represent one experiment with two independent biological replicates pooled from seven to nine independent mice. [(D) and (E)] CD4+ Thy1.1+ donor T cells of the indicated genotypes were isolated and reactivated for two rounds of 5 days under TH1 (IL-12, anti–IL-4, and anti–IFN-γ) or TH2 conditions. TH2 cells derived from WT naive LCMV-specific CD4+ Thy1.1+ cells served as control. (D) GATA-3 protein amounts were determined in CD4+ Thy1.1+ donor cells by FACS. Representative histograms are shown. Bar graph shows geometric mean indices + SEM of GATA-3 within CD4+ Thy1.1+ donor T cells isolated after reactivation for two rounds of 4 days under TH2 conditions. (E) Quantitative PCR of the indicated cytokine genes after restimulation with PMA/ionomycin for 3 hours. Data are pooled from three independent experiments (n = 6 to 9).
Fig. 5.
Fig. 5.. Long-term maintenance of graded GATA-3 expression in IL-4–treated TH1 cells.
(A to E) Naive Tbx21+/+ and Tbx21+/− LCMV-specific CD4+ Thy1.1+ cells were adoptively transferred into C57BL/6 mice, followed by LCMV infection. After 10 days, CD4+ Thy1.1+ donor T cells were isolated and reactivated in vitro for two rounds of 4 days under either neutral or TH2 conditions. Subsequently, reactivated CD4+ Thy1.1+ cells were retransferred into naive C57BL/6 mice. Data represent the mean ± SEM of n = 4 to 6 mice per group and time point, with significance denoted as follows: ns, not significant; *P < 0.05; **P < 0.01; ***P < 0.001; ****P < 0.0001. (A) Experimental scheme. (B) GATA-3 protein levels in CD4+ Thy1.1+ donor cells in the peripheral blood of recipient mice at various time points after retransfer. GATA-3 geometric mean index depicts the fold change of GATA-3 geometric mean in CD4+ Thy1.1+ donor cells compared to endogenous naive CD62LhiCD4+Thy1.2+ T cells. Statistics: Two-way ANOVA with Tukey’s multiple comparisons test. (C) Seventeen days after secondary transfer, GATA-3 and T-bet expression in CD4+ Thy1.1+ donor cells isolated from the spleen were determined. GATA-3 relative protein expression in reprogrammed CD4+ Thy1.1+ cells compared to those treated under neutral conditions (left graph). Geometric mean indices indicate the fold increase in T-bet staining geometric mean compared to isotype control staining in CD4+ Thy1.1+ cells (right graph). (D) Cytokine production in splenocyte supernatants from CD4+ Thy1.1+ recipient mice after 24 hours of restimulation with GP61–80 peptide. [(D) and (E)] Statistics: Mann-Whitney test. (E) GATA-3 expression in CD4+ Thy1.1+ donor cells from the spleen, 17 days after secondary transfer, followed by 5 days of culture with GP61–80 and APCs. Geometric mean indices indicate fold change of GATA-3 staining geometric means compared to isotype control staining. Statistics: Kruskal-Wallis test with Dunn’s multiple comparisons test.
Fig. 6.
Fig. 6.. The magnitude of T-bet expression predicts TH1 cell plasticity.
(A to C) Naive T-bet-ZsG (TBGR) mice were infected with LCMV. Ten days after infection, CD4+ CD44hi CD62Llo T cells were sorted based on ZsG expression intensity via FACS. Data were pooled from two independent experiments with three biological replicates each, derived from n = 20 mice. [(A) to (C)] Statistics: Kruskal-Wallis test with Dunn’s multiple comparisons test; ns, not significant; *P < 0.05; **P < 0.01; ***P < 0.001; ****P < 0.0001. (A) Experimental scheme and sorting controls. CD4+ CD44hi CD62Llo T cells were sorted according to ZsG expression, and intracellular T-bet protein expression was assessed by FACS. (B) ZsG intensity, T-bet, and GATA-3 protein expression were analyzed in sorted T cell fractions using FACS. Geometric mean indices + SEM of ZsG intensity and T-bet and GATA-3 staining in sorted T cell populations are indicated. Geometric mean + SEM of IFN-γ expression intensity within gated ZsGhi, ZsGint, and ZsGlo CD4+ Thy1.1+ donor cells was determined after restimulation with GP61–80 through intracellular cytokine staining. (C) Endogenous LCMV-specific CD4+ T cells were reactivated under the indicated conditions with GP61–80 and APCs. TH2 cells derived from naive LCMV-specific CD4+ cells served as a control. GATA-3 protein expression was determined in activated CD4+ CD154+ T cells by FACS. Representative histograms are shown, and a bar graph displays geometric mean indices + SEM of GATA-3 within activated CD4+ CD154+ T cells after reactivation under TH2 conditions.
Fig. 7.
Fig. 7.. Graded T-bet expression is a stable property of TH1 cells.
(A to C) Naive LCMV-specific TBGR CD4+ Thy1.1+ cells were adoptively transferred into untreated TBGR Thy1.2+ mice, followed by LCMV infection. Effector CD4+ Thy1.1+ T cells were FACS-sorted based on ZsG expression intensity. Equal numbers of isolated CD4+ ZsG+ Thy1.1+ cells were retransferred into uninfected TBGR Thy1.2+ recipient mice subsequently infected with LCMV. Data represent a compilation of two independent experiments with three biological replicates each, derived from n = 20 mice. (A) Experimental scheme. (B) T-bet and GATA-3 protein expression in donor CD4+ Thy1.1+ T cells 10 days after secondary infection. Statistics: Kruskal-Wallis test with Dunn’s multiple comparisons test; ns, not significant; *P < 0.05; **P < 0.01; ***P < 0.001; ****P < 0.0001. (C) CD4+ Thy1.1+ donor T cells were isolated after secondary infection and reactivated in vitro under TH2 conditions. GATA-3 protein expression was analyzed by FACS, with representative histograms provided.
Fig. 8.
Fig. 8.. Continuous T-bet expression safeguards TH1 cell stability.
Naive Tbx21fl/fl and Tbx21fl/+ Rosa26CreERT2+ LCMV-specific CD4+ Thy1.1+ cells were adoptively transferred into Thy1.2+ Rosa26CreERT2+ C57BL/6 mice. Recipient mice were infected with LCMV. On days 7, 8, and 9 after infection, recipient mice were treated with tamoxifen, while a control group was left untreated. On day 10 after infection, CD4+ Thy1.1+ donor T cells were isolated and directly analyzed or reactivated for 5 days under TH2 conditions. Data are representative of two independent experiments (n = 6 to 7 per group and experiment). (A) Experimental scheme. (B) IFN-γ expression and (C) T-bet and GATA-3 expression were determined in CD4+ Thy1.1+ donor cells by FACS on day 10 after infection. (D) GATA-3 and T-bet protein expression were determined by FACS in CD4+ Thy1.1+ donor cells after re-activation for 5 days under TH2 conditions. TH2 cells derived from naive LCMV-specific CD4+ Thy1.1+ cells served as control. (E) Quantitative PCR of the indicated cytokine genes after restimulation with PMA/ionomycin for 3 hours. Statistics: Kruskal-Wallis test with Dunn’s multiple comparisons test; ns, not significant; *P < 0.05; **P < 0.01; ***P < 0.001; ****P < 0.0001.

References

    1. Abbas A. K., Murphy K. M., Sher A., Functional diversity of helper T lymphocytes. Nature 383, 787–793 (1996). - PubMed
    1. M. Delbrück, Unités Biologiques Douées de Continuité Génétique, Colloques Internationaux du Centre National de la Recherche Scientifique (CNRS, 1949).
    1. Gardner T. S., Cantor C. R., Collins J. J., Construction of a genetic toggle switch in Escherichia coli. Nature 403, 339–342 (2000). - PubMed
    1. Löhning M., Richter A., Radbruch A., Cytokine memory of T helper lymphocytes. Adv. Immunol. 80, 115–181 (2002). - PubMed
    1. Monod J., Jacob F., General conclusions: Teleonomic mechanisms in cellular metabolism, growth, and differentiation. Cold Spring Harb. Symp. Quant. Biol. 26, 389–401 (1961). - PubMed