. 2024 Jun 7;10(23):eadn1640.
doi: 10.1126/sciadv.adn1640. Epub 2024 Jun 5.

Gene regulatory landscape of cerebral cortex folding

Affiliations

Gene regulatory landscape of cerebral cortex folding

Aditi Singh et al. Sci Adv. .

Abstract

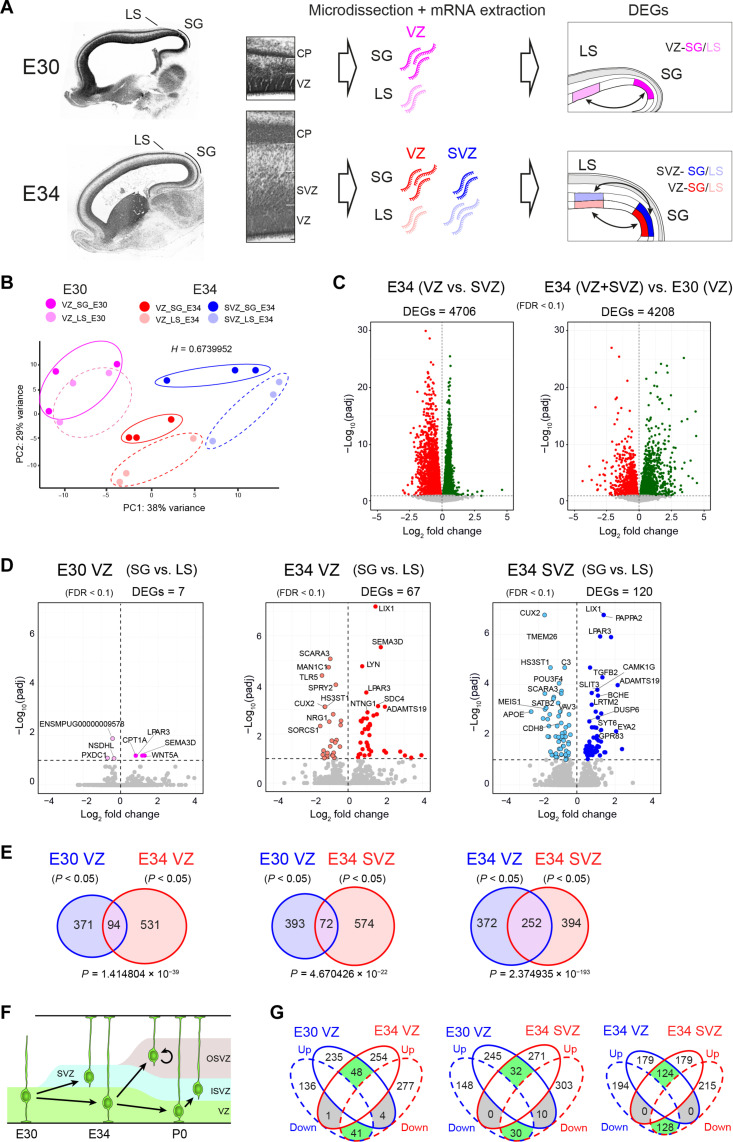
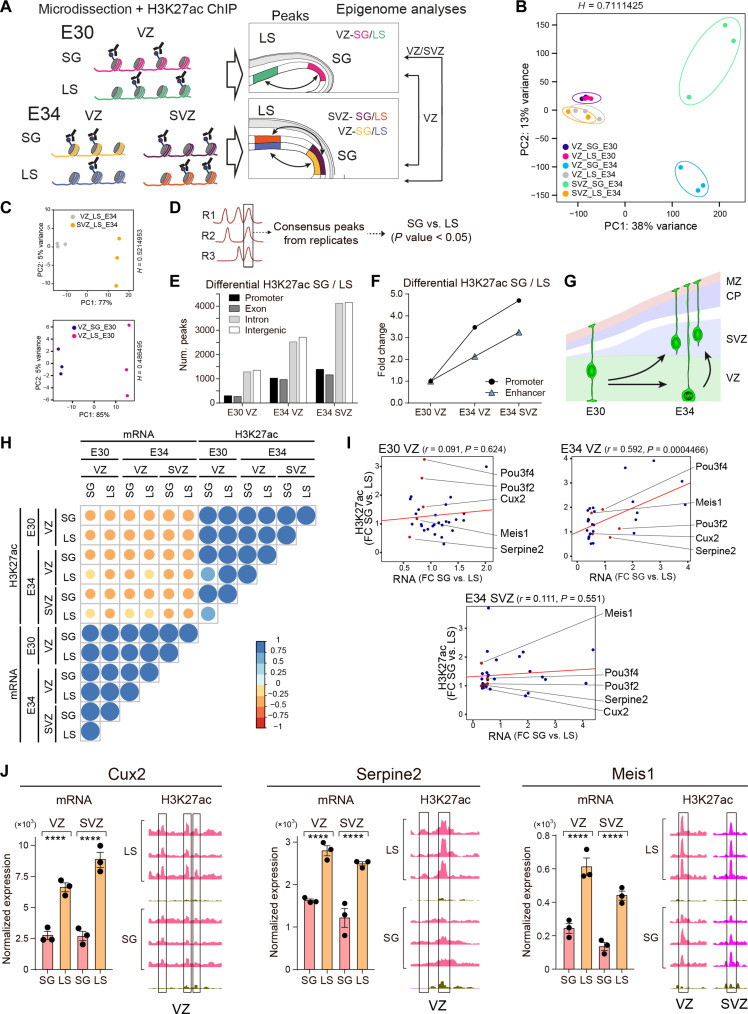
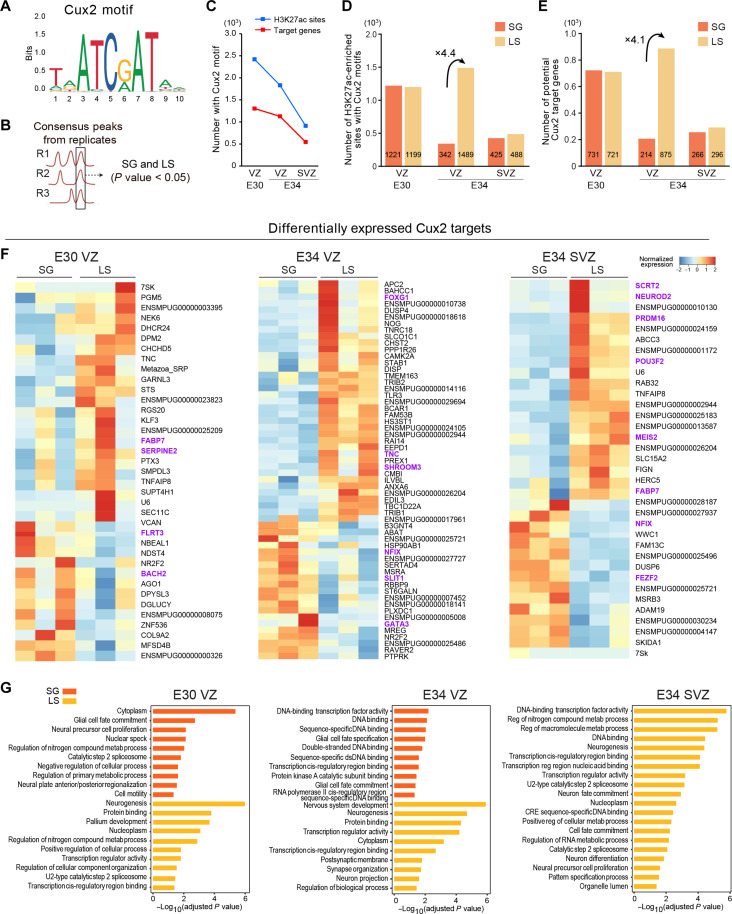
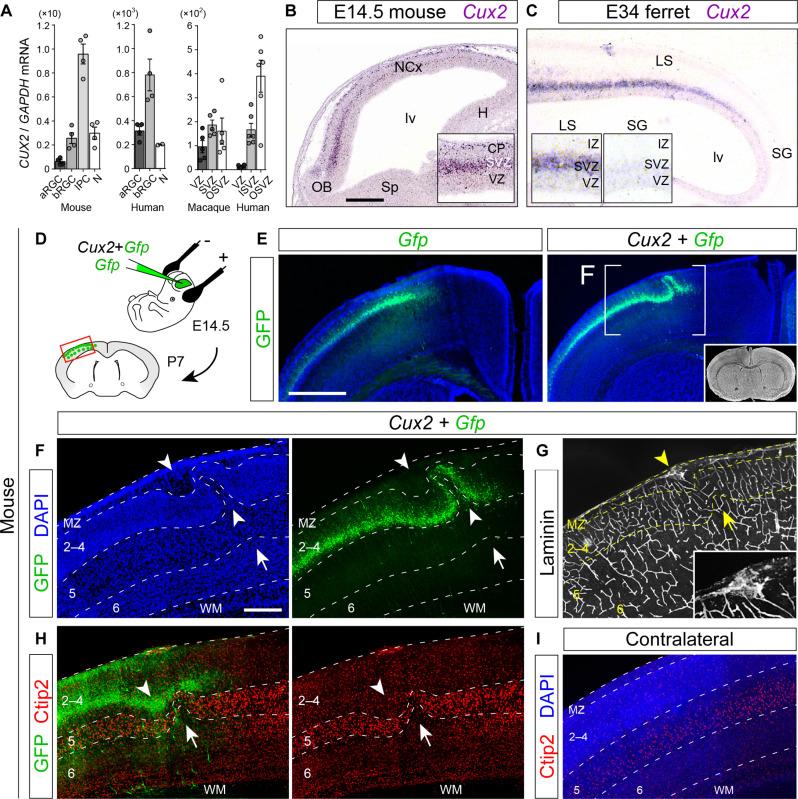
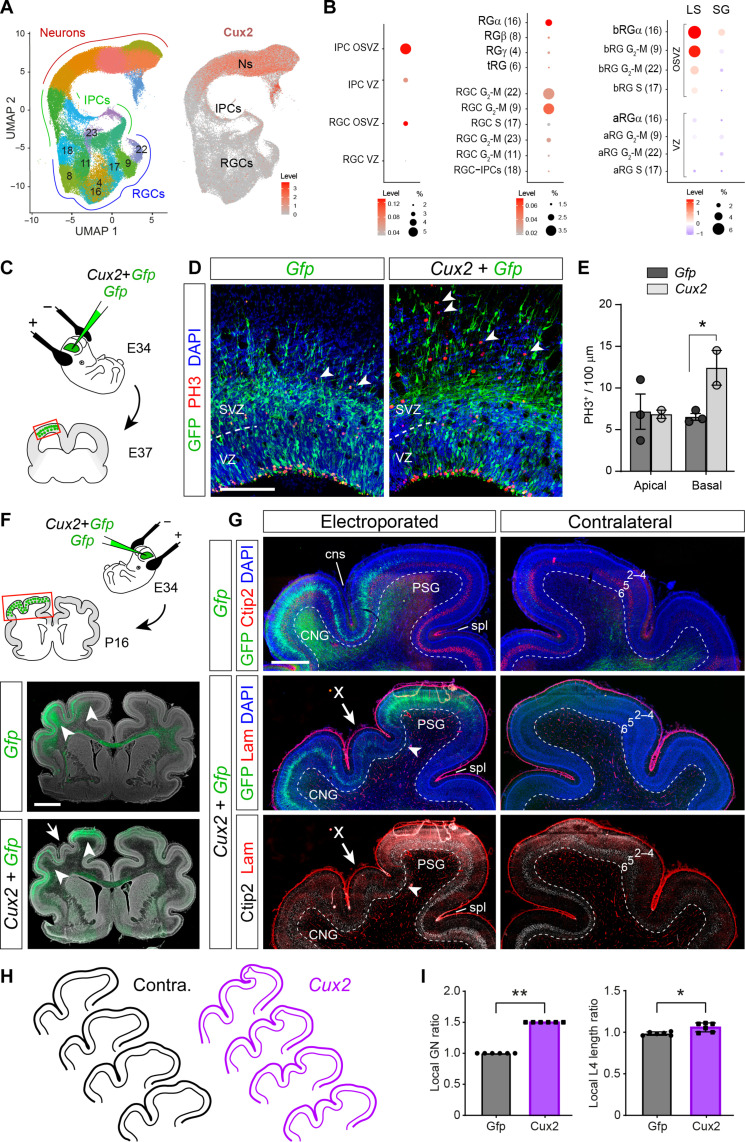
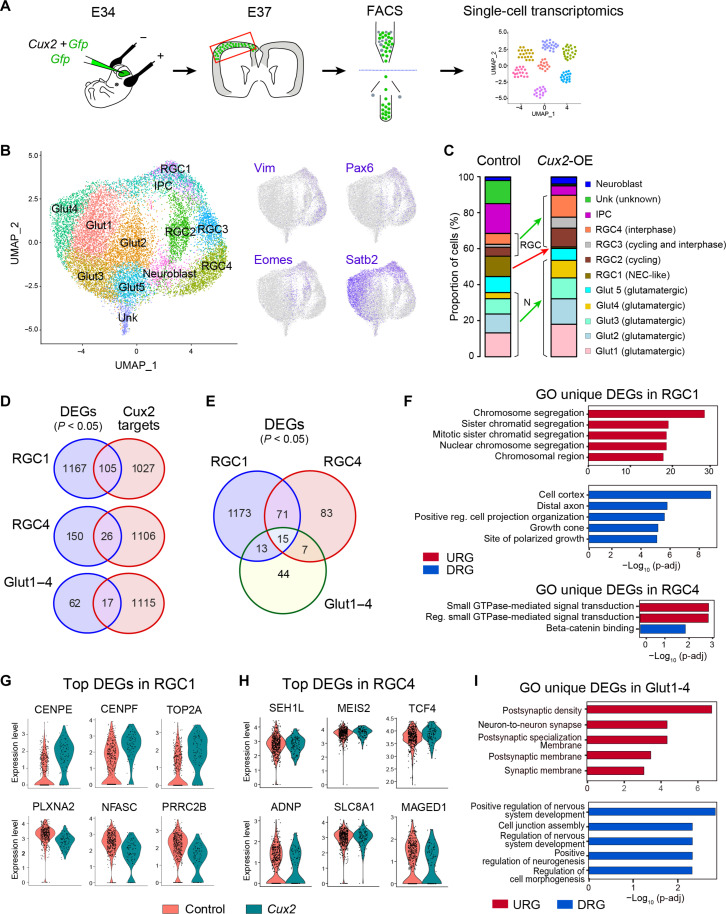
Folding of the cerebral cortex is a key aspect of mammalian brain development and evolution, and defects are linked to severe neurological disorders. Primary folding occurs in highly stereotyped patterns that are predefined in the cortical germinal zones by a transcriptomic protomap. The gene regulatory landscape governing the emergence of this folding protomap remains unknown. We characterized the spatiotemporal dynamics of gene expression and active epigenetic landscape (H3K27ac) across prospective folds and fissures in ferret. Our results show that the transcriptomic protomap begins to emerge at early embryonic stages, and it involves cell-fate signaling pathways. The H3K27ac landscape reveals developmental cell-fate restriction and engages known developmental regulators, including the transcription factor Cux2. Manipulating Cux2 expression in cortical progenitors changed their proliferation and the folding pattern in ferret, caused by selective transcriptional changes as revealed by single-cell RNA sequencing analyses. Our findings highlight the key relevance of epigenetic mechanisms in defining the patterns of cerebral cortex folding.


Figures

Fig. 1.
Fig. 1.. Differential transcriptomic landscapes in the germinal zones of the developing ferret cortex.
(A) Schema of experimental design, showing detailed images of sections across the ferret cerebral cortex at the indicated ages. DEGs, differentially expressed genes; CP, cortical plate. (B) PCA of all RNA-seq samples included in our study. Circles group replicate samples (solid lines, gyrus; dashed line, sulcus), separating ages, cortical regions, and layers. (C and D) Volcano plots for significant and DEGs between germinal layers, developmental stages (C), and between gyrus and sulcus (D). Total number of DEGs are indicated. (E) Venn diagrams of DEGs between SG and LS at the indicated conditions. (F) Schematic drawing of the cell lineage relationships and germinal zone formation during cortical development preceding the emergence of folds. (G) Venn diagrams of DEGs between SG and LS that are up- (solid line) or down-regulated (dashed line). Intersections in diagrams indicate common genes between conditions. The number of common iso-regulated genes (up-up, or down-down; green) and antiregulated genes (up in one comparison, down in the other; gray) are indicated. See also figs. S1 to S4.
Fig. 2.
Fig. 2.. Differential epigenomic landscapes in germinal zones of the developing ferret cortex.
(A) Schema of experimental approach for ChIP-seq assays and data analysis. (B and C) PCA of all ChIP-seq samples included in our study (B), or E34 LS and E30 samples alone (C). Circles group replicate samples. (D) Selection of consensus peaks across biological replicas (R) for significant differential read abundance. (E and F) Absolute abundance (E) and fold change (F) of differential H3K27ac peaks between SG/LS in the indicated age and zone. (G) Schematic drawing of the cell lineage relationships and germinal zone formation during embryonic cortex development preceding the emergence of folds. (H) Correlation between average reads of epigenome and transcriptome for all genes at E30 and E34 in the VZ and SVZ datasets. (I) Regression of epigenome-transcriptome fold changes (FC) between SG and LS for selected genes in the indicated samples. Regression lines (red) are indicated. (J) Examples of correlation between mRNA expression (histograms) and H3K27ac peak abundance (boxed areas in sequencing tracks) for the indicated genes. H3K27ac sequencing tracks from three replicates (red, VZ; purple, SVZ) and input control (green) are shown. See also fig. S5.
Fig. 3.
Fig. 3.. Cux2 is a potential key regulator of cortex folding.
(A) Consensus DNA binding motif for Cux2. (B) Selection of consensus peaks for significant differential expression. (C) Total number of differential H3K27ac peaks (blue) and associated genes (red) between SG and LS in the indicated germinal zones, containing Cux2 binding motifs. (D and E) Number of H3K27ac peaks enriched in SG or LS containing Cux2 binding motifs (D) and unique genes annotated nearest to H3K27ac sites containing Cux2 motifs (E), in the indicated germinal zones. Numbers of sites or genes in each case are indicated in bold. Arrows indicate fold change between SG and LS. (F) Heatmaps of unsupervised hierarchical clustering of unique genes in gyrus and sulcus annotated nearest to Cux2 motif–containing sites, which are also differentially expressed in the transcriptome. (G) GO analysis of the uniquely annotated and differentially expressed Cux2 motif–containing genes in the indicated conditions, up-regulated in SG or in LS as indicated. See also fig. S6.
Fig. 4.
Fig. 4.. Block-wise expression of Cux2 induces cortex folding in mouse.
(A) Normalized expression of CUX2 mRNA in the cell types and germinal zones of the developing cortex of the indicated species. aRGC, apical radial glia cell; IPC, intermediate progenitor cell; N, neuron. Data are from (–43). (B and C) Parasagittal sections through the telencephalon of E14.5 mouse (EURExpress) and E34 ferret embryos showing the expression pattern of Cux2 mRNA. H, hippocampus; lv, lateral ventricle; NCx, neocortex; OB, olfactory bulb; Sp, septum; CP, cortical plate; IZ, intermediate zone. (D) Schema of experimental design for mouse in utero electroporation and analysis. (E to I) Coronal sections through the rostral cortex of mice electroporated at E14.5 with the indicated plasmids, analyzed at P7, and stained with the indicated markers. In (E), inset shows panoramic view of the whole brain section under DAPI stain; brackets indicate area shown in (F) to (H); the equivalent area in the contralateral, nonelectroporated hemisphere is shown in (I). Arrowheads indicate the gyrus/sulcus in the layer of electroporated (green) cells, and arrows indicate folding of layer 5. Numbers indicate neuronal layers. MZ, marginal zone; WM, white matter. Scale bars, 200 μm (B, C, and F to I) and 1 mm (E and F). See also fig. S7.
Fig. 5.
Fig. 5.. Embryonic overexpression of Cux2 induces additional folding in ferret cortex.
(A and B) UMAP with unbiased clustering of scRNA-seq data from the developing ferret cortex, and Cux2 expression (A), and dot plots of Cux2 expression in the indicated cell populations (B). For LS-SG comparison, levels are scaled. (C) Schema of experimental design. (D and E) PH3 staining (B) and quantification (C) from control or Cux2-overexpression embryos. (F) Schema of experimental design. Arrowheads indicate PSG and CNG in panoramic views of the whole brain section under DAPI and GFP stain, and arrow indicates the additional folding structure generated. (G) Coronal sections through the rostral cortex of ferrets electroporated at E34 with the indicated plasmids, analyzed at P16, and stained with the indicated markers. A new fold (“X”) forms upon Cux2 overexpression. Arrows indicate the extra fold, and arrowheads indicate folding in all cortical layers. Numbers indicate neuronal layers. cns, coronal sulcus; spl, splenial sulcus. (H) Outline of rostral cortex through consecutive coronal sections in electroporated and contralateral hemispheres from a Cux2-overexpression animal. (I) Local GN and layer 4 length ratios between electroporated and contralateral hemispheres in control and Cux2 animals. This phenotype was observed with 60% penetrance (three of five embryos from four litters). Scale bars, 100 μm (D), 2 mm (F), and 1 mm (G). See also figs. S8 and S9.
Fig. 6.
Fig. 6.. Single-cell transcriptome analysis reveals Cux2 regulated cell type effects.
(A) Schema of experimental approach for scRNA-seq and data analysis. (B) UMAP and clustering of Control and Cux2-overexpression samples together. Unk, unknown. (C) Normalized frequency distribution of cell clusters in control or Cux2-overexpression samples. (D and E) Overlap of total Cux2 targets at E34 with specific DEGs from cell types of interest (D) and overlap between DEGs in cell types of interest (E). (F) GO terms for unique DEGs in RGC1 and RGC4. (G and H) Violin plots for top DEGs in RGC1 (G) and RGC4 (H). (I) GO terms for unique DEGs in Glut1–4. See also figs. S10 and S11.

References

    1. W. Welker, in Cerebral Cortex, A. Peters, E. G. Jones, Eds. (Plenum Press, 1990), vol. 8B, pp. 3–136.
    1. Llinares-Benadero C., Borrell V., Deconstructing cortical folding: Genetic, cellular and mechanical determinants. Nat. Rev. Neurosci. 20, 161–176 (2019). - PubMed
    1. Klyachko V. A., Stevens C. F., Connectivity optimization and the positioning of cortical areas. Proc. Natl. Acad. Sci. U.S.A. 100, 7937–7941 (2003). - PMC - PubMed
    1. Hilgetag C. C., Barbas H., Role of mechanical factors in the morphology of the primate cerebral cortex. PLOS Comput. Biol. 2, e22 (2006). - PMC - PubMed
    1. Fernández V., Llinares-Benadero C., Borrell V., Cerebral cortex expansion and folding: What have we learned? EMBO J. 35, 1021–1044 (2016). - PMC - PubMed