Comparative Study
. 2024 Oct 14;120(12):1411-1426.
doi: 10.1093/cvr/cvae125.

Myeloid cannabinoid CB1 receptor deletion confers atheroprotection in male mice by reducing macrophage proliferation in a sex-dependent manner

Affiliations
Comparative Study

Myeloid cannabinoid CB1 receptor deletion confers atheroprotection in male mice by reducing macrophage proliferation in a sex-dependent manner

Yong Wang et al. Cardiovasc Res. .

Abstract

Aims: Although the cannabinoid CB1 receptor has been implicated in atherosclerosis, its cell-specific effects in this disease are not well understood. To address this, we generated a transgenic mouse model to study the role of myeloid CB1 signalling in atherosclerosis.

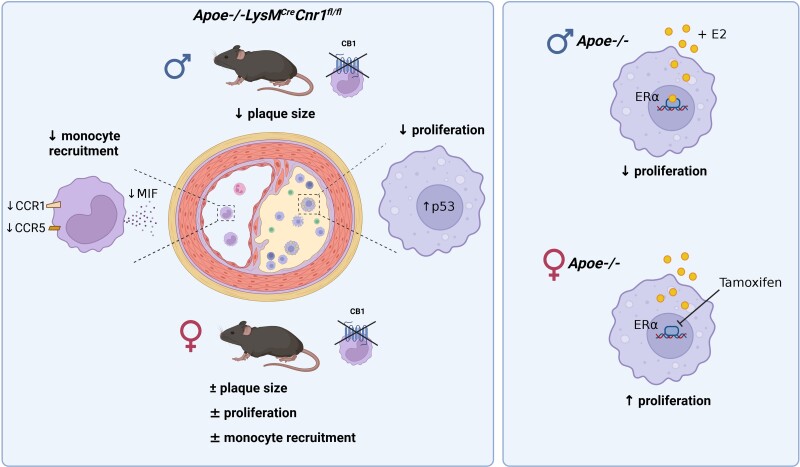
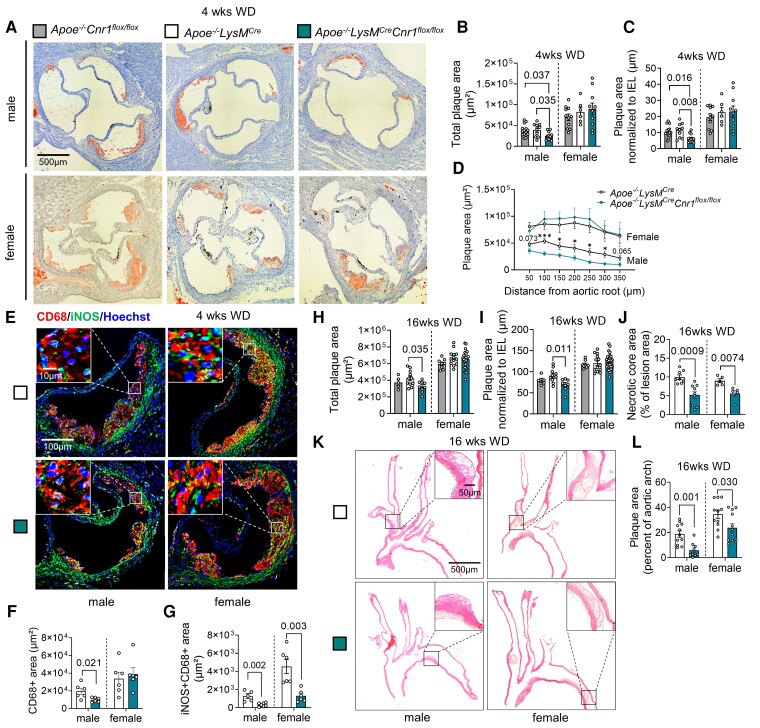
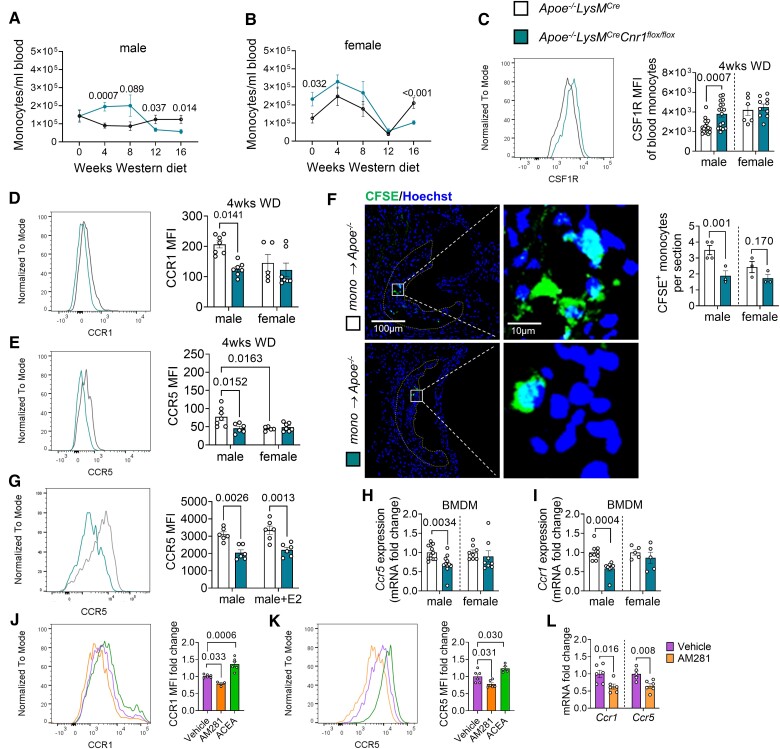
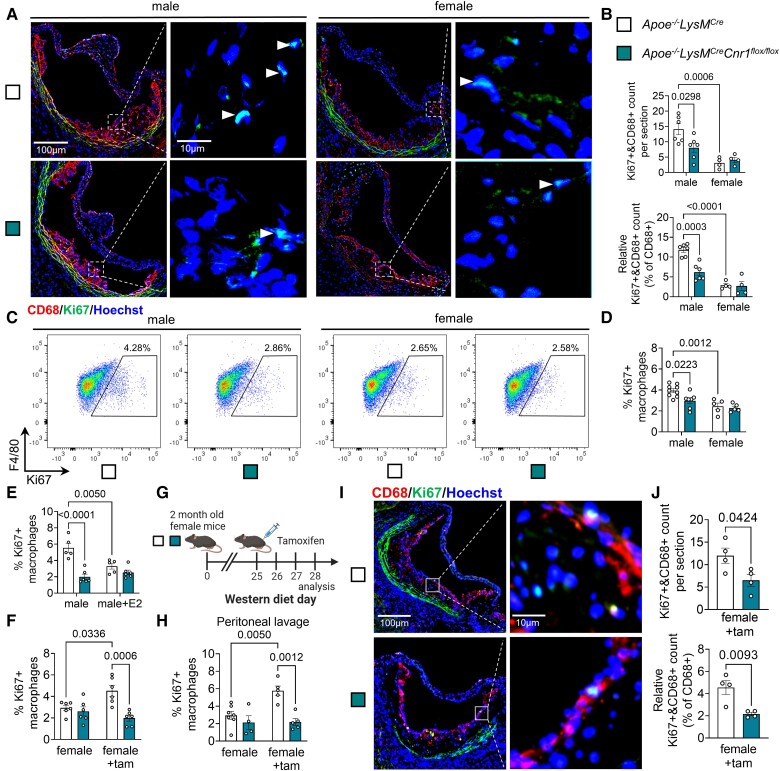
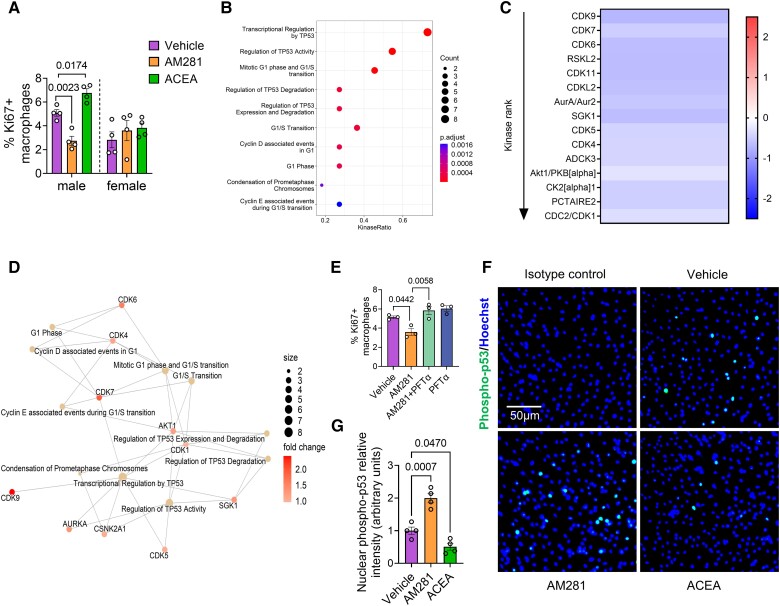
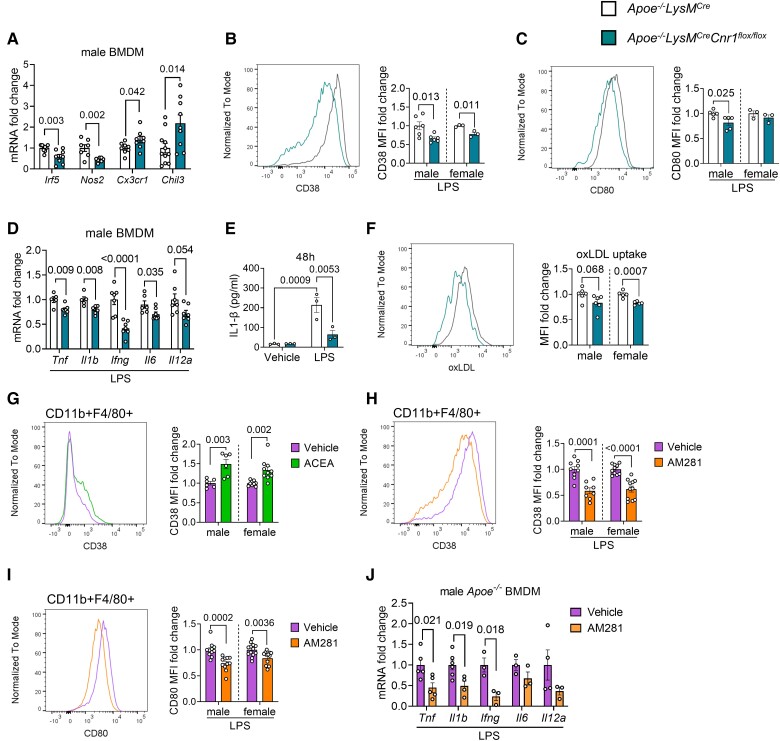
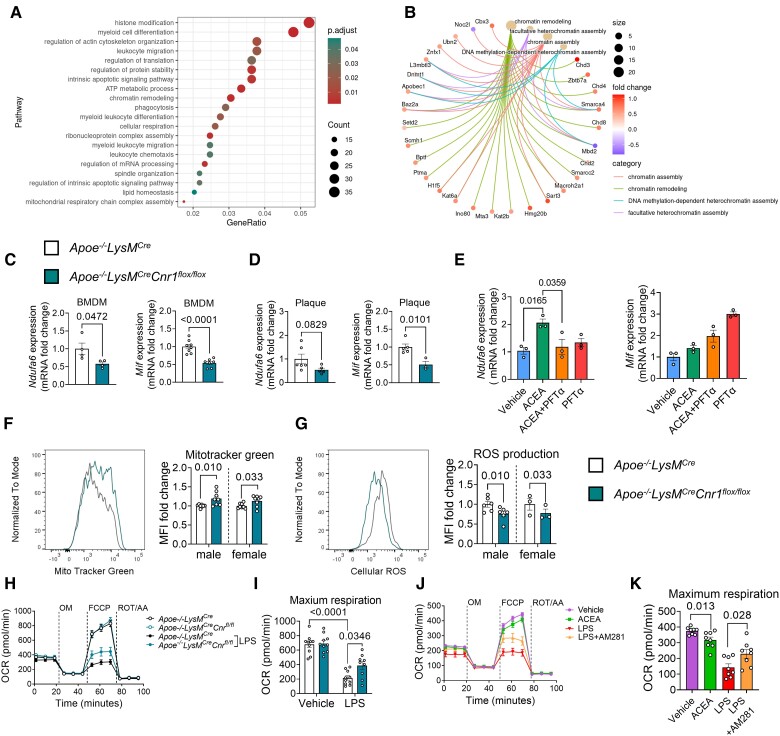
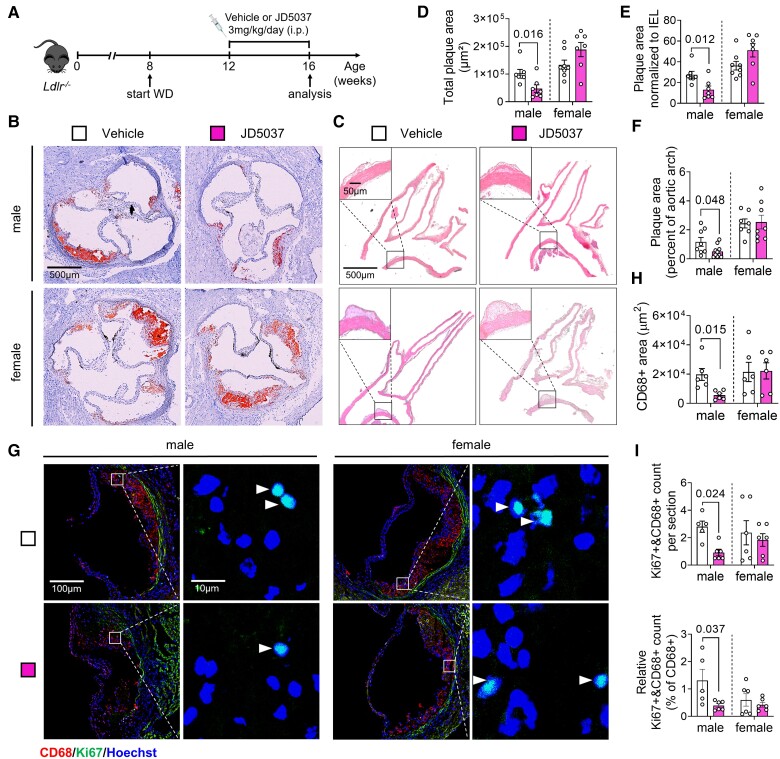
Methods and results: Here, we report that male mice with myeloid-specific Cnr1 deficiency on atherogenic background developed smaller lesions and necrotic cores than controls, while only minor genotype differences were observed in females. Male Cnr1-deficient mice showed reduced arterial monocyte recruitment and macrophage proliferation with less inflammatory phenotype. The sex-specific differences in proliferation were dependent on oestrogen receptor (ER)α-oestradiol signalling. Kinase activity profiling identified a CB1-dependent regulation of p53 and cyclin-dependent kinases. Transcriptomic profiling further revealed chromatin modifications, mRNA processing, and mitochondrial respiration among the key processes affected by CB1 signalling, which was supported by metabolic flux assays. Chronic administration of the peripherally restricted CB1 antagonist JD5037 inhibited plaque progression and macrophage proliferation, but only in male mice. Finally, CNR1 expression was detectable in human carotid endarterectomy plaques and inversely correlated with proliferation, oxidative metabolism, and inflammatory markers, suggesting a possible implication of CB1-dependent regulation in human pathophysiology.

Conclusion: Impaired macrophage CB1 signalling is atheroprotective by limiting their arterial recruitment, proliferation, and inflammatory reprogramming in male mice. The importance of macrophage CB1 signalling appears to be sex-dependent.

Keywords: Cannabinoid CB1 receptor; Macrophage; Oestrogen receptor alpha; Proliferation; p53.


Conflict of interest statement

Conflict of interest: none declared.

Figures

Graphical Abstract
Graphical Abstract
Figure 1
Figure 1
Impact of myeloid Cnr1 deficiency on atherogenesis and plaque progression. (AD) Representative Oil-Red-O (ORO) stains of aortic roots of male (n = 12–15) and female (n = 6–11) Apoe−/−Cnr1flox/flox, Apoe−/−LysMCre, and Apoe−/−LysMCreCnr1flox/flox mice after 4 weeks of Western diet (WD); scale bar: 500 μm. (B) Quantification of absolute lesion area or (C) normalized to IEL. (D) Plaque area per aortic root section. (E) Double immunostaining of iNOS (green) and CD68 (red) in aortic root lesions of Apoe−/−LysMCre and Apoe−/−LysMCreCnr1flox/flox mice after 4 weeks of WD. Nuclei were counterstained with Hoechst 33342 (blue). Scale bar: 10 μm (top) and 100 µm (bottom). (F) Quantification of lesional macrophages and (G) inflammatory macrophages identified by combined positive CD68 and iNOS staining (n = 5–6). (H) Quantification of absolute lesion area or (I) normalized to IEL in aortic root sections after 16 weeks of WD (n = 5–21). (J) Necrotic core area quantified in Masson Trichrome-stained aortic root sections after 16 weeks of WD (n = 5–9). (K and L) Representative HE stains of aortic arches and plaque area quantification in male and female Apoe−/−LysMCre and Apoe−/−LysMCreCnr1flox/flox mice after 16 weeks of WD (n = 9–12); scale bar: 500 μm. Each dot represents one biologically independent mouse sample and all data are expressed as mean ± S.E.M. Two-sided unpaired Student’s t-test (D, F, G, J, and L), one-way ANOVA followed by Tukey test (B and C) or Dunnett T3 test (H and I) were used to determine the significant differences. Male and female were analysed independently (BD, FJ, and L). Exact P-values are shown or indicated as ***P < 0.001 and *P < 0.05 in (D).
Figure 2
Figure 2
Impact of myeloid Cnr1 deficiency on circulating leucocyte counts, chemokine receptor expression, and arterial recruitment. (A, B) Number of circulating monocytes in male (7–19) and female (5–23) Apoe−/−LysMCre and Apoe−/−LysMCreCnr1flox/flox mice assessed by flow cytometry. (C) Flow cytometric analysis of colony-stimulating factor 1 receptor (CSF1R) expression on circulating monocytes after 4 weeks of WD (n = 6–18). (D, E) Flow cytometric analysis of CCR1 and CCR5 surface expression on circulating monocytes after 4 weeks of WD (n = 6–8). (F) Microscopy images and quantification of CFSE-labelled monocytes (green) recruited into aortic root lesions 48 h after injection into male Apoe−/− mice on WD for 4 weeks (n = 3–4), Nuclei were stained with Hoechst 33342 (blue); scale bar: 100 μm (left) and 10 µm (right). (G) Flow cytometric analysis of male BMDM treated with vehicle or 10 nM oestradiol (E2) for 24 h (n = 6). (H, I) Gene expression levels in untreated male and female BMDMs (n = 5–12). (J, K) Flow cytometric analysis of male BMDM from Apoe−/− mice treated with vehicle, 10 µM AM281 or 1 µM ACEA for 24 h (n = 4–6). (L) Gene expression levels in male Apoe−/− BMDMs treated with vehicle or 10 µM AM281 for 8 h (n = 5–6). Each dot represents one biologically independent mouse sample and all data are expressed as mean ± S.E.M. Two-sided unpaired Student’s t-test (AC, F, H, I, and L), one-way ANOVA followed by Tukey test (J and K), two-way ANOVA followed by Tukey test (D, E, G). Male and female were analysed independently (AI).
Figure 3
Figure 3
Role of CB1 and oestrogen signalling in macrophage proliferation. (A) Representative images of proliferating (Ki67+, green and marked with white arrowheads) macrophages (CD68+, red) in aortic root plaques after 4 weeks Western diet (WD); nuclei were counterstained with Hoechst 33342 (blue). Scale bar: 100 μm (left) and 10 µm (right). (B) Total and relative counts of proliferating plaque macrophages (n = 4–6). (C, D) Flow cytometric analysis of proliferation rates in untreated male and female BMDMs isolated from Apoe−/−LysMCre and Apoe−/−LysMCreCnr1flox/flox mice (n = 5–9). (E) Proliferation rates in male BMDM treated with vehicle or 10 nM oestradiol (E2) for 24 h (n = 5–6). (F) Proliferation rates in female BMDM treated with vehicle or 1 µM tamoxifen (tam) for 24 h (n = 3–4). (GJ) Apoe−/−LysMCre and Apoe−/−LysMCreCnr1flox/flox female mice were fed with Western diet (WD) for 4 weeks and subjected to daily ip injections of 1 mg tamoxifen or vehicle for the last 3 days prior to analysis of proliferation rates in peritoneal macrophages (H; n = 4–7). (I) Representative immunostainings of proliferating (Ki67+) macrophages (CD68+) in aortic root plaques (nuclei, Hoechst); scale bar: 100 μm (left) and 10 µm (right). (J) Total and relative counts of proliferating plaque macrophages (n = 4). Each dot represents one mouse and all data are expressed as mean ± S.E.M. Two-sided unpaired Student’s t-test (J), two-way ANOVA followed by Tukey test (B, DF, and H).
Figure 4
Figure 4
Effect of CB1 stimulation on kinase activity and p53 nuclear translocation. (A) Proliferating male and female Apoe−/− BMDMs treated with vehicle, 10 µM AM281 or 1 µM ACEA for 24 h (n = 4). (B) Top 10 enriched kinase pathways and (C) heatmap of kinase activity in male Apoe−/− BMDM treated with vehicle or 1 µM ACEA for 60 min (n = 4). Values indicate mean kinase statistic; significantly different kinases with median final score > 1.2 are shown. (D) Interaction map showing kinase pathways regulated in ACEA-stimulated male BMDMs. (E) Proliferation rates in male BMDM treated with vehicle, AM281 (10 µM) and p53 inhibitor (PFT-α; 25 µM) for 24 h (n = 3). (F and G) Phospho-p53 immunostaining (green) and quantification of nuclear p53 translocation in male Apoe−/− BMDMs treated with vehicle, 1 µM ACEA or 10 µM AM281 for 60 min. Nuclei were stained with Hoechst33342 (blue); scale bar: 50 μm (n = 4). Each dot represents one mouse and all data are expressed as mean ± S.E.M. One-way ANOVA followed by Tukey test (H and I), two-way ANOVA followed by Tukey test (A, E, and G). Male and female were analysed independently (A).
Figure 5
Figure 5
Role of CB1 in inflammatory macrophage polarization and oxLDL uptake. BMDMs were isolated from Apoe−/−LysMCre and Apoe−/−LysMCreCnr1flox/flox (AF) or Apoe−/− mice (GJ). (A) Expression levels of macrophage polarization markers in unstimulated male BMDMs, determined by qPCR (n = 7–12). Flow cytometric analysis of CD38 (B) and CD80 (C) surface expression of male and female BMDMs after 48 h of LPS (10 ng/mL) stimulation (n = 3–6). (D) Gene expression levels (qPCR) of pro-inflammatory cytokines in male BMDMs after 8 h of LPS stimulation (n = 5–7). (E) IL1β secretion of male BMDMs after 48 h of LPS stimulation (n = 3). (F) Flow cytometric analysis of labelled dil-oxLDL uptake by male and female BMDMs (n = 5–6). (G) CD38 surface expression on 24 h vehicle- or 1 µM ACEA-treated male and female BMDMs (n = 6–10) or (H) 24 h LPS-stimulated male and female BMDMs in presence of 10 µM AM281 or vehicle (n = 8–12). (I) CD80 surface expression on 24 h LPS-stimulated male and female BMDMs in presence of 10 µM AM281 or vehicle (n = 8–12). (J) Gene expression levels of pro-inflammatory cytokines in male Apoe−/− BMDMs after 8 h LPS stimulation in presence of 10 µM AM281 or vehicle (n = 3–5). Each dot represents one biologically independent mouse sample and all data are expressed as mean ± S.E.M. Two-sided unpaired Student’s t-test (AD and FJ), two-way ANOVA followed by Tukey test (E). Male and female were analysed independently (B, C, and FI).
Figure 6
Figure 6
Gene expression profile and mitochondrial effects of CB1 signalling in macrophages. BMDMs were isolated from Apoe−/− (A, B, E, J, K) or Apoe−/−LysMCre and Apoe−/−LysMCreCnr1flox/flox mice (C, D, FI). (A) Top regulated biological processes based on gene ontology and (B) network analysis of chromatin modification pathways and associated DEGs in male BMDMs treated with 1 µM ACEA for 24 h, compared to vehicle. (C) Gene expression analysis (qPCR) in BMDMs obtained from baseline male mice (n = 4–8) or (D) laser capture microdissected plaques of aortic root sections from male mice (n = 3–6) subjected to 4 weeks Western diet (WD). (E) Gene expression analysis (qPCR) in male BMDMs (n = 3) treated with 1 µM ACEA for 30 min alone or in presence of p53 inhibitor (PFT-α). (F) Flow cytometric analysis of mitochondrial content in male and female BMDMs, determined by MitoTracker™ green staining (n = 8), and (G) reactive oxygen species (ROS) determined by dihydrorhodamine 123 (DHR123) staining (n = 3–6). (HK) Oxygen consumption rate (OCR) in male BMDMs (n = 8–10 mice) after sequential injection of oligomycin (OM), carbonyl cyanide 4-(trifluoromethoxy)phenylhydrazone (FCCP), and rotenone (ROT) plus antimycin A (AA). Each dot represents one biologically independent mouse sample and all data are expressed as mean ± S.E.M. Two-sided unpaired Student’s t-test (C, D, F, and G), one-way ANOVA followed by Tukey test (E and K), two-way ANOVA followed by Tukey test (I).
Figure 7
Figure 7
Effect of chronic peripheral CB1 antagonist administration on atherosclerosis and macrophage proliferation. (A) Experimental scheme. Ldlr−/− mice were fed with Western diet (WD) for 8 weeks and subjected to daily iv injections of JD5037 (3 mg/kg) or vehicle for the last 4 weeks. (B) Representative images of aortic root cross-sections stained with ORO. (C) Representative images of HE-stained aortic arch longitudinal sections. (D) Quantification of absolute lesion area within aortic roots (n = 7–8 mice) or (E) normalized to IEL (n = 7–8). (F) Quantification of the plaque area in aortic arch sections (n = 7–8). (G) Representative images of proliferating (Ki67+, green; white arrowheads) macrophages (CD68+, red) in aortic root plaques; nuclei were counterstained with Hoechst (blue). Scale bar: 100 μm (left) and 10 µm (right). (H) Quantification of lesional macrophage area (n = 6) and (I) total as well as relative counts of proliferating plaque macrophages (n = 5–6). Each dot represents one biologically independent mouse sample and all data are expressed as mean ± S.E.M. Two-sided unpaired Student’s t-test (DF, H, I). Male and female were analysed independently.

References

    1. Lutgens E, Atzler D, Doring Y, Duchene J, Steffens S, Weber C. Immunotherapy for cardiovascular disease. Eur Heart J 2019;40:3937–3946. - PubMed
    1. Sugamura K, Sugiyama S, Nozaki T, Matsuzawa Y, Izumiya Y, Miyata K, Nakayama M, Kaikita K, Obata T, Takeya M, Ogawa H. Activated endocannabinoid system in coronary artery disease and antiinflammatory effects of cannabinoid 1 receptor blockade on macrophages. Circulation 2009;119:28–36. - PubMed
    1. Wang PF, Jiang LS, Bu J, Huang XJ, Song W, Du YP, He B. Cannabinoid-2 receptor activation protects against infarct and ischemia-reperfusion heart injury. J Cardiovasc Pharmacol 2012;59:301–307. - PubMed
    1. Weis F, Beiras-Fernandez A, Sodian R, Kaczmarek I, Reichart B, Beiras A, Schelling G, Kreth S. Substantially altered expression pattern of cannabinoid receptor 2 and activated endocannabinoid system in patients with severe heart failure. J Mol Cell Cardiol 2010;48:1187–1193. - PubMed
    1. Quercioli A, Pataky Z, Vincenti G, Makoundou V, Di Marzo V, Montecucco F, Carballo S, Thomas A, Staub C, Steffens S, Seimbille Y, Golay A, Ratib O, Harsch E, Mach F, Schindler TH. Elevated endocannabinoid plasma levels are associated with coronary circulatory dysfunction in obesity. Eur Heart J 2011;32:1369–1378. - PubMed

Publication types

MeSH terms

Associated data