. 2024 Jun 25;43(6):114310.
doi: 10.1016/j.celrep.2024.114310. Epub 2024 Jun 4.

Interferon-γ induces combined pyroptotic angiopathy and APOL1 expression in human kidney disease

Affiliations

Interferon-γ induces combined pyroptotic angiopathy and APOL1 expression in human kidney disease

Benjamin A Juliar et al. Cell Rep. .

Abstract

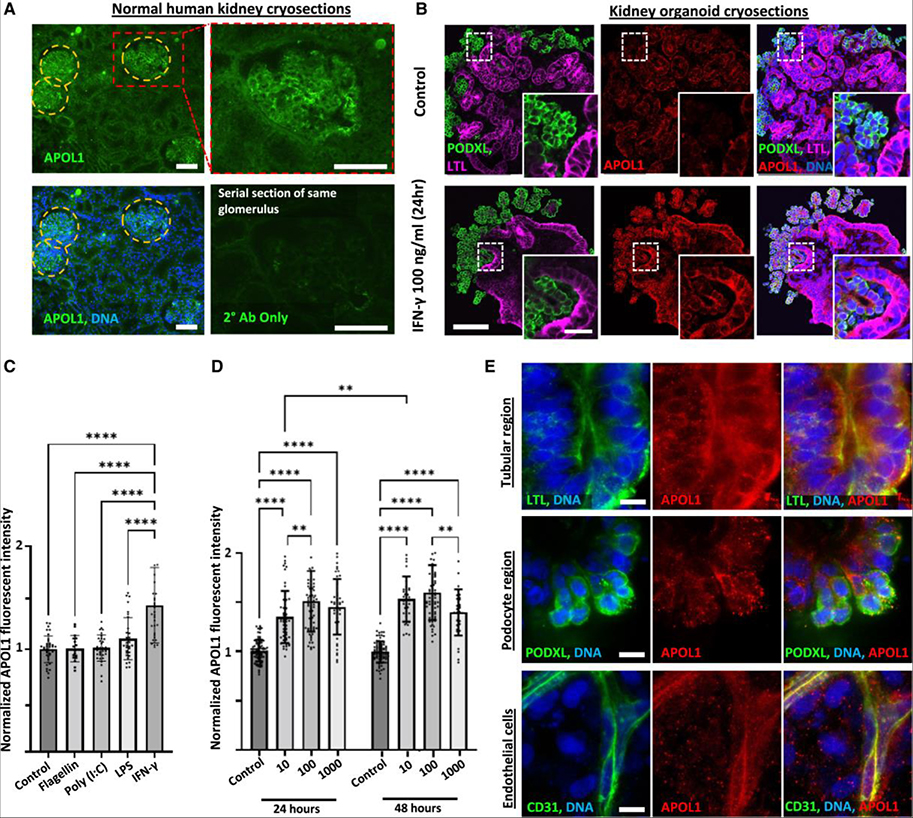
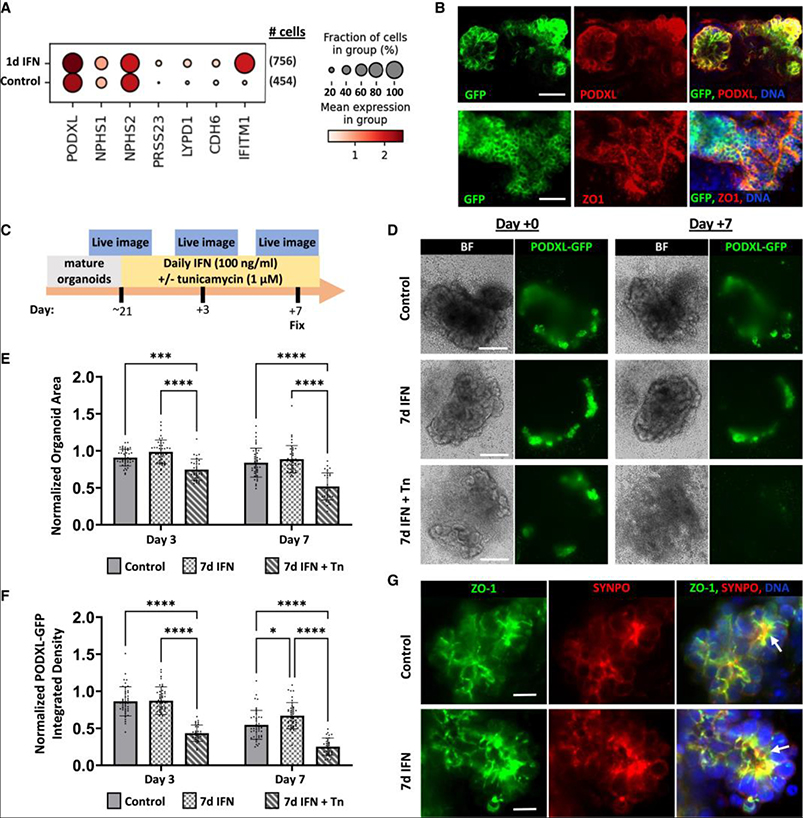
Elevated interferon (IFN) signaling is associated with kidney diseases including COVID-19, HIV, and apolipoprotein-L1 (APOL1) nephropathy, but whether IFNs directly contribute to nephrotoxicity remains unclear. Using human kidney organoids, primary endothelial cells, and patient samples, we demonstrate that IFN-γ induces pyroptotic angiopathy in combination with APOL1 expression. Single-cell RNA sequencing, immunoblotting, and quantitative fluorescence-based assays reveal that IFN-γ-mediated expression of APOL1 is accompanied by pyroptotic endothelial network degradation in organoids. Pharmacological blockade of IFN-γ signaling inhibits APOL1 expression, prevents upregulation of pyroptosis-associated genes, and rescues vascular networks. Multiomic analyses in patients with COVID-19, proteinuric kidney disease, and collapsing glomerulopathy similarly demonstrate increased IFN signaling and pyroptosis-associated gene expression correlating with accelerated renal disease progression. Our results reveal that IFN-γ signaling simultaneously induces endothelial injury and primes renal cells for pyroptosis, suggesting a combinatorial mechanism for APOL1-mediated collapsing glomerulopathy, which can be targeted therapeutically.

Keywords: CP: Cell biology; CP: Immunology; baricitinib; caspase; cell death; gasdermin; glomerulosclerosis; inflammation; podocalyxin; proteomics; pyroptosis; spatial transcriptomics.


Conflict of interest statement

Declaration of interests B.S.F. is an inventor on patents and/or patent applications related to human kidney organoid differentiation and modeling of disease in this system (these include “Three-dimensional differentiation of epiblast spheroids into kidney tubular organoids modeling human microphysiology, toxicology, and morphogenesis” [Japan, US, and Australia], licensed to STEMCELL Technologies; “High-throughput automation of organoids for identifying therapeutic strategies” [PTC patent application pending]; and “Systems and methods for characterizing pathophysiology” [PTC patent application pending]). B.S.F. and H.F. hold ownership interest in Plurexa, LLC. None of the preceding interests affected in any way the results of the paper or would be affected by them but are shared by way of transparency.

Figures

Figure 1.
Figure 1.. APOL1 is detected by immunofluorescence in IFN-γ-stimulated kidney organoids
(A) Disk spinning confocal immunofluorescent images of APOL1 expression in representative serial cryosections of a normal healthy human kidney wedge stained with or without APOL1 primary antibody. Scale bars, 100 μm. (B) Disk spinning confocal immunofluorescence images of representative control and IFN-γ-stimulated organoid cryosections showing APOL1 expression pattern. Scale bar, 100 μm; inset scale bar, 40 μm (C and D) Average fluorescence intensity of APOL1 throughout organoids, quantified with (C) immunofluorescence microscopy for an agonist screen at 24 h (n ≥ 17 organoids per condition pooled across 3 independent experiments) and (D) IFN-γ dose response at 10, 100, and 1,000 ng/mL at 24 and 48 h (n ≥ 32 organoids per condition pooled across 3 independent experiments). Results are presented as normalized fluorescent intensity. Mean ± SD. Significance was calculated using one-way ANOVA with Tukey’s multiple comparisons test. *p < 0.05, **p < 0.01, and ****p < 0.0001. (E) Laser confocal immunofluorescence images showing subcellular localization of APOL1 expression in tubules, podocytes, and ECs after IFN-γ stimulation. Scale bars, 10 μm. LPS, lipopolysaccharide; CD31, cluster of differentiation 31.
Figure 2.
Figure 2.. JAK1/2 inhibitors prevent and reverse IFN-γ-mediated APOL1 expression
(A) Cartoon illustrating canonical IFN-γ signaling and APOL1 induction and JAK1/2 inhibition by baricitinib and INCB018424. Red text indicates phosphorylation and activation. IFN-γR, interferon-γ receptor; JAK, Janus kinase; STAT, signal transducer and activator of transcription; GAF, gamma-interferon activation factor; GAS, gamma-interferon activation site; IRF, interferon regulatory factor; ISRE, interferon stimulated response element. (B) Legend for drug screen, including drug target. (C and D) Dosing regimens starting on day 21 of organoid culture are indicated above violin plots of APOL1 signal intensity to test prevention (n ≥ 44 organoids per condition pooled across 6 independent experiments) (C) and reversion (n ≥ 26 organoids per condition pooled across 5 independent experiments) of IFN-γ induced APOL1 expression (D). Lines indicate median (solid) and quartiles (dashed). Significance was calculated using one-way ANOVA with Tukey’s multiple comparisons test. *p < 0.05, ***p < 0.001, and ****p < 0.0001.
Figure 3.
Figure 3.. IFN-γ stimulation induces key pyroptosis-associated genes across cell types
(A) Dot plot of inflammatory and pyroptosis-associated gene expression in organoids treated with 25 ng/mL IFN-γ for 24 h ± 1 μM baricitinib (bari). Darker dots indicate stronger expression, and dot size reflects the percentage of cells in a cluster expressing the indicated gene. Cell counts per type, per condition, are indicated to the right. (B) ELISA showing APOL1 expression in organoids treated with 25 ng/mL IFN-γ for 24 h ± 1 μM baricitinib (n = 3 independent experiments). (C) Confocal immunofluorescence images showing GSDMD signal in both podocytes (top) and tubules (bottom) with punctate densities localized to the outer cell membrane (white arrows). Scale bars, 10 μm. (D) Average GSDMD signal throughout the organoid following daily treatment with 100 ng/mL IFN-γ ± 1 μM baricitinib, quantified with immunofluorescence microscopy (n ≥ 22 organoids per condition pooled across 4 independent experiments). Mean ± SD. Significance was calculated using one-way ANOVA with Tukey’s multiple comparisons test. *p < 0.05, **p < 0.01, ***p < 0.001, and ****p < 0.0001. (E) Representative western blot from bulk lysate of organoid cultures showing STAT1, full-length GSDMD, and the N-terminal (NT) fragment of GSDMD with 3 day IFN treatment. See also Figure S1.
Figure 4.
Figure 4.. Podocytes are resilient to prolonged IFN-γ treatment despite modest dedifferentiation
(A) Dot plot of mature and early glomerular epithelial gene expression from scRNA-seq in pooled mature and early glomerular cell fractions from organoids treated with 25 ng/mL IFN-γ for 24 h. Darker red dots indicate stronger expression across cells, and dot size reflects the percentage of cells expressing the indicated gene. (B) Confocal immunofluorescence images of PODXL-GFP organoids stained for PODXL or ZO-1. Scale bars, 40 μm. (C) Timeline for prolonged IFN-γ treatment and live imaging of PODXL-GFP organoids. (D) Representative bright-field images and maximum intensity projections of disk spinning confocal z stacks from live imaging. Scale bars, 200 μm. (E and F) Quantification of organoid areas (E) and quantification of PODXL-GFP fluorescent signal integrated density normalized to pretreatment (F) (n ≥ 24 organoids per condition pooled across 4 independent experiments). Mean ± SD. Significance was calculated using one-way ANOVA with Tukey’s multiple comparisons test. *p < 0.05, ***p < 0.001, and ****p < 0.0001. (G) Representative laser confocal z-slices showing co-localization of ZO-1 and SYNPO in podocyte clusters after prolonged IFN-γ treatment. Scale bars, 10 μm. ZO-1, zonula occludens-1; SYNPO, synaptopodin; Tn, tunicamycin. See also Figure S2.
Figure 5.
Figure 5.. IFN-γ-induced degradation of endothelial networks is rescued by JAK1/2 inhibition and partially rescued by caspase inhibition
(A) Representative maximum intensity projections of disk spinning confocal z stacks. Manual trace of the organoid body (white dashes) and automated trace of vascular network (teal, lower row) are superimposed. Scale bars, 100 μm. (B) Average fluorescent intensity of APOL1 throughout organoids quantified with immunofluorescence microscopy (n ≥ 37 organoids between 4 independent experiments). (C) Average fluorescent intensity of APOL1 within CD31+ binary mask, excluding organoid body manual trace (stromal area), quantified with immunofluorescence microscopy (organoids with stromal network areas ≤2,000 μm2 were excluded, n ≥ 24 organoids/condition pooled between 4 independent experiments). (D and E) Automated quantification of total CD31+ network density per region of interest containing an organoid for (D) baricitinib (n ≥ 32 organoids per condition pooled between 4 independent experiments) and (E) zVAD-FMK (n ≥ 52 organoids per condition pooled between 4 independent experiments) rescue experiments. Mean ± SD. Significance was calculated using one-way ANOVA with Tukey’s multiple comparisons test. *p < 0.05, **p < 0.01, ***p < 0.001, and ****p < 0.0001. (F) Dot plot of gene expression in ECs from organoids treated with 25 ng/mL IFN-γ for 24 h. Darker dots indicate stronger expression across cells, and dot size reflects the percentage of cells expressing the indicated gene. See also Figures S3 and S4 and Table S1.
Figure 6.
Figure 6.. AKECs exhibit pronounced sensitivity to IFN-γ treatment
(A) Representative wide-field immunofluorescent images of AKECs 24 h after plating (pretreatment) and 72 h after treatment with IFN-γ (100 ng/mL) ± baricitinib (1 μM). Scale bars, 100 μm. PV-1, plasmalemmal vesicle associated protein-1. (B–E) Automated quantification of (B and C) average nuclear density and (D and E) APOL1 fluorescent intensity in cell bodies during monolayer culture of HUVECs (n = 3 independent lots) and primary human AKECs (n = 3 independent donors). Mean ± SD. Significance was calculated using one-way ANOVA with Tukey’s multiple comparisons test. *p < 0.05, **p < 0.01, ***p < 0.001, and ****p < 0.0001. See also Figure S5.
Figure 7.
Figure 7.. IFN signaling and upregulation of pyroptosis-associated genes in patients correlates with accelerated renal failure
(A) Gene Ontology pathway analysis of urine proteome reads showing the Generalized Berk-Jones (GBJ) statistic and significance (adjusted p value) for up-regulated IFN- and cell-death-related pathways in COVID+ versus COVID− patients. (B) Differential gene expression (DGE) analysis for inflammatory and pyroptosis associated genes on voom-transformed normalized read counts from bulk RNA-seq on biopsies from individuals in the severe cluster relative to the moderate cluster, showing fold change (FC), significance (adjusted p value), and counts per million reads. (C) snRNA-seq showing upregulation of pyroptosis-associated genes in the EC fraction from severe cluster biopsies compared to moderate. (D) IPA wheel spoke diagram showing causal links (black arrows) of IFN-γ as an upstream regulator of pyroptotic genes. Gene shapes indicate cellular localization, and color indicates log2FC from DGE analysis. (E) Third quartile (Q3) normalized counts for IFN-γ, CD31, and CD34 from collapsing glomeruli (n = 7, from 3 patients) and normal glomeruli (n = 12, 3 patients) are shown. Each point represents the expression level of that gene from GeoMx digital spatial profiling for an individual glomerulus. Mean shown. Significance was calculated using a two-tailed t test. **p < 0.01 and ****p < 0.0001. (F) Immunohistochemistry for CD31 in a representative glomerulus with collapsing histology (HIVAN) and another with normal histology (glomerular borders outlined in red). Scale bars, 20 μm. See also Figure S6 and Table S2.

Similar articles

Cited by

References

    1. Bonventre JV, and Zuk A (2004). Ischemic acute renal failure: an inflammatory disease? Kidney Int. 66, 480–485. - PubMed
    1. Del Campo JA, Gallego P, and Grande L (2018). Role of inflammatory response in liver diseases: Therapeutic strategies. World J. Hepatol. 10, 1–7. - PMC - PubMed
    1. Evans RA, Leavy OC, Richardson M, Elneima O, McAuley HJC, Shikotra A, Singapuri A, Sereno M, Saunders RM, Harris VC, et al. (2022). Clinical characteristics with inflammation profiling of long COVID and association with 1-year recovery following hospitalisation in the UK: a prospective observational study. Lancet Respir. Med. 10, 761–775. - PMC - PubMed
    1. Tu J, Cheung WW, and Mak RH (2016). Inflammation and nutrition in children with chronic kidney disease. World J. Nephrol. 5, 274–282. - PMC - PubMed
    1. Der SD, Zhou A, Williams BR, and Silverman RH (1998). Identification of genes differentially regulated by interferon alpha, beta, or gamma using oligonucleotide arrays. Proc. Natl. Acad. Sci. USA 95, 15623–15628. - PMC - PubMed

Publication types