. 2024 Jun:104:105181.
doi: 10.1016/j.ebiom.2024.105181. Epub 2024 Jun 4.

Virological characteristics of a SARS-CoV-2-related bat coronavirus, BANAL-20-236

Collaborators, Affiliations

Virological characteristics of a SARS-CoV-2-related bat coronavirus, BANAL-20-236

Shigeru Fujita et al. EBioMedicine. 2024 Jun.

Abstract

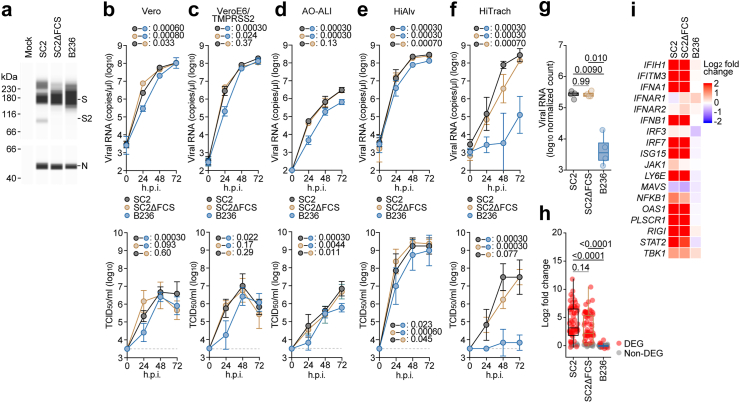
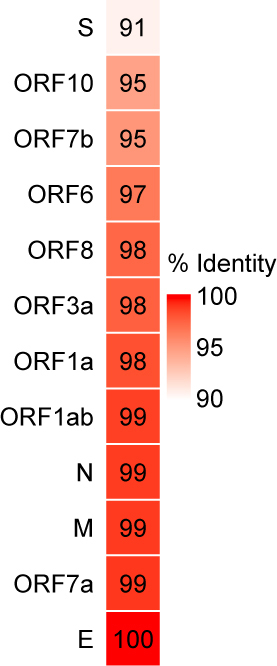
Background: Although several SARS-CoV-2-related coronaviruses (SC2r-CoVs) were discovered in bats and pangolins, the differences in virological characteristics between SARS-CoV-2 and SC2r-CoVs remain poorly understood. Recently, BANAL-20-236 (B236) was isolated from a rectal swab of Malayan horseshoe bat and was found to lack a furin cleavage site (FCS) in the spike (S) protein. The comparison of its virological characteristics with FCS-deleted SARS-CoV-2 (SC2ΔFCS) has not been conducted yet.

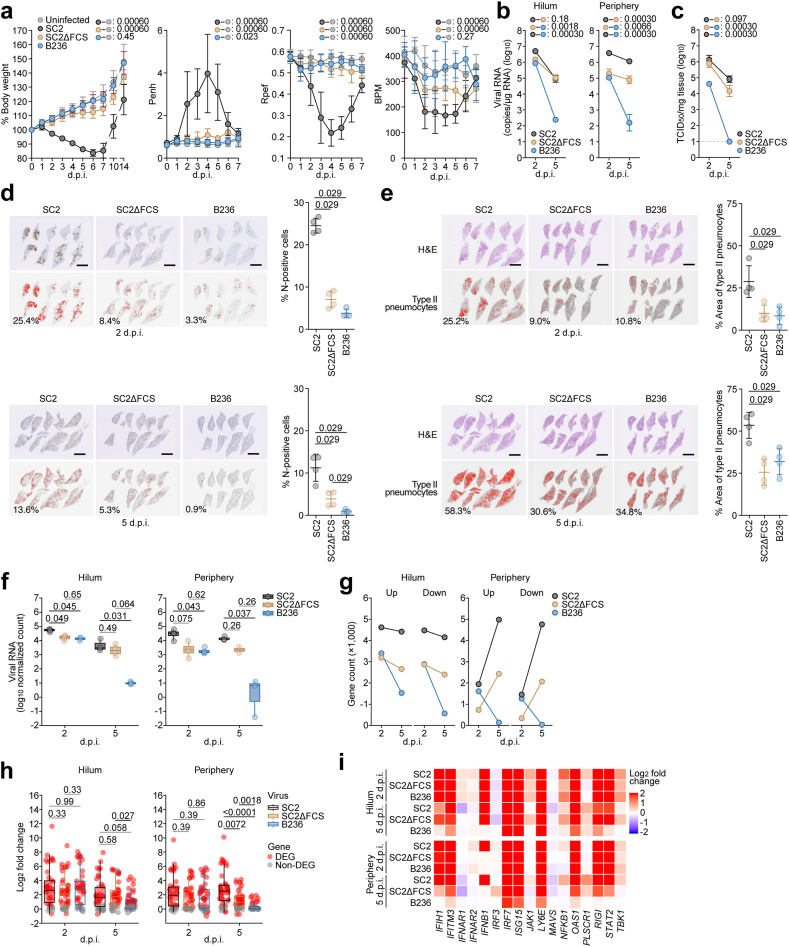
Methods: We prepared human induced pluripotent stem cell (iPSC)-derived airway and lung epithelial cells and colon organoids as human organ-relevant models. B236, SARS-CoV-2, and artificially generated SC2ΔFCS were used for viral experiments. To investigate the pathogenicity of B236 in vivo, we conducted intranasal infection experiments in hamsters.

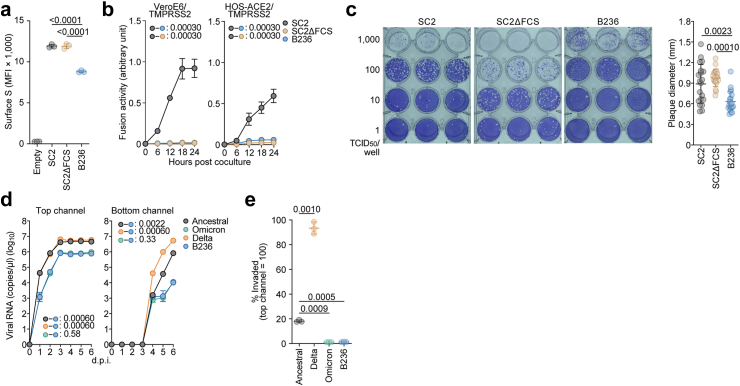
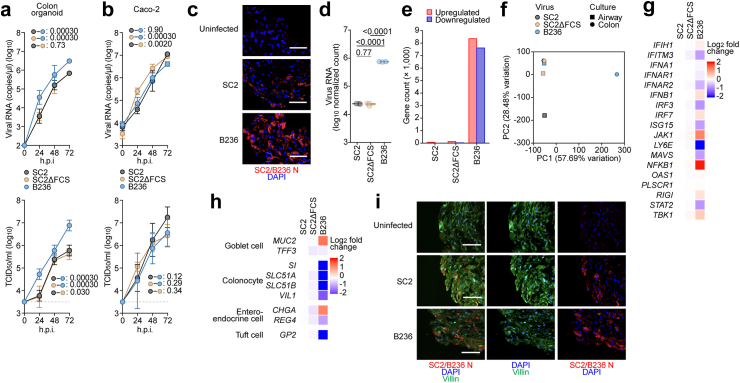
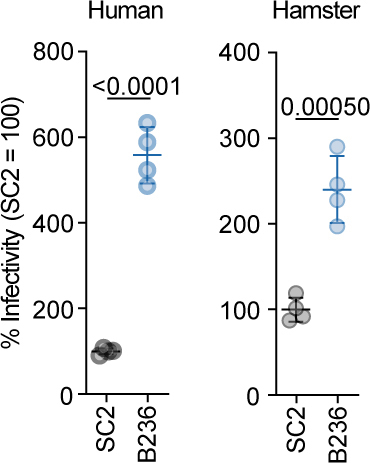
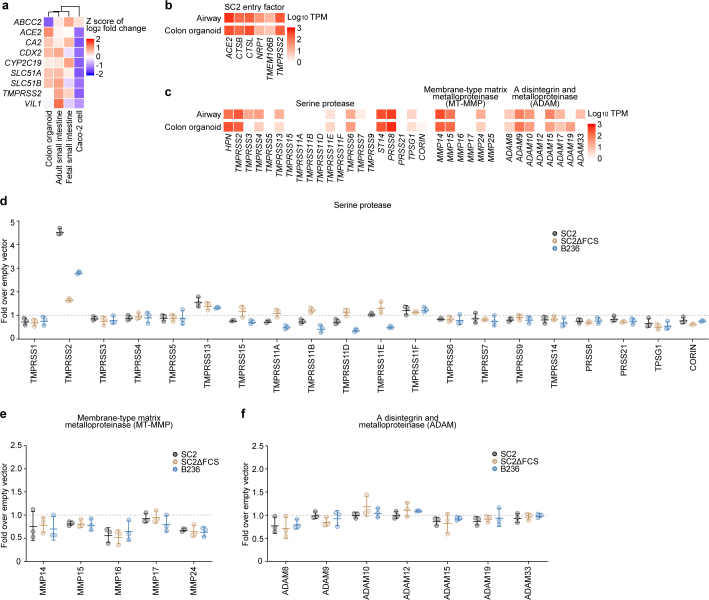
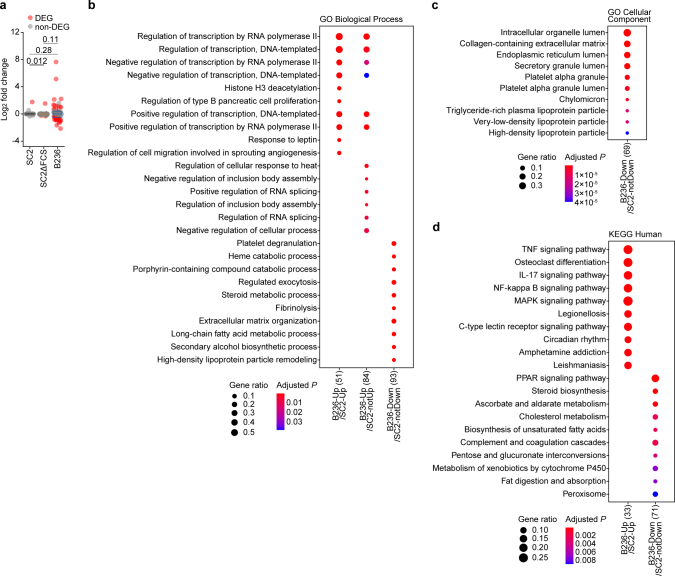
Findings: In human iPSC-derived airway epithelial cells, the growth of B236 was significantly lower than that of the SC2ΔFCS. A fusion assay showed that the B236 and SC2ΔFCS S proteins were less fusogenic than the SARS-CoV-2 S protein. The infection experiment in hamsters showed that B236 was less pathogenic than SARS-CoV-2 and even SC2ΔFCS. Interestingly, in human colon organoids, the growth of B236 was significantly greater than that of SARS-CoV-2.

Interpretation: Compared to SARS-CoV-2, we demonstrated that B236 exhibited a tropism toward intestinal cells rather than respiratory cells. Our results are consistent with a previous report showing that B236 is enterotropic in macaques. Altogether, our report strengthens the assumption that SC2r-CoVs in horseshoe bats replicate primarily in the intestinal tissues rather than respiratory tissues.

Funding: This study was supported in part by AMED ASPIRE (JP23jf0126002, to Keita Matsuno, Kazuo Takayama, and Kei Sato); AMED SCARDA Japan Initiative for World-leading Vaccine Research and Development Centers "UTOPIA" (JP223fa627001, to Kei Sato), AMED SCARDA Program on R&D of new generation vaccine including new modality application (JP223fa727002, to Kei Sato); AMED SCARDA Hokkaido University Institute for Vaccine Research and Development (HU-IVReD) (JP223fa627005h0001, to Takasuke Fukuhara, and Keita Matsuno); AMED Research Program on Emerging and Re-emerging Infectious Diseases (JP21fk0108574, to Hesham Nasser; JP21fk0108493, to Takasuke Fukuhara; JP22fk0108617 to Takasuke Fukuhara; JP22fk0108146, to Kei Sato; JP21fk0108494 to G2P-Japan Consortium, Keita Matsuno, Shinya Tanaka, Terumasa Ikeda, Takasuke Fukuhara, and Kei Sato; JP21fk0108425, to Kazuo Takayama and Kei Sato; JP21fk0108432, to Kazuo Takayama, Takasuke Fukuhara and Kei Sato; JP22fk0108534, Terumasa Ikeda, and Kei Sato; JP22fk0108511, to Yuki Yamamoto, Terumasa Ikeda, Keita Matsuno, Shinya Tanaka, Kazuo Takayama, Takasuke Fukuhara, and Kei Sato; JP22fk0108506, to Kazuo Takayama and Kei Sato); AMED Research Program on HIV/AIDS (JP22fk0410055, to Terumasa Ikeda; and JP22fk0410039, to Kei Sato); AMED Japan Program for Infectious Diseases Research and Infrastructure (JP22wm0125008 to Keita Matsuno); AMED CREST (JP21gm1610005, to Kazuo Takayama; JP22gm1610008, to Takasuke Fukuhara; JST PRESTO (JPMJPR22R1, to Jumpei Ito); JST CREST (JPMJCR20H4, to Kei Sato); JSPS KAKENHI Fund for the Promotion of Joint International Research (International Leading Research) (JP23K20041, to G2P-Japan Consortium, Keita Matsuno, Takasuke Fukuhara and Kei Sato); JST SPRING (JPMJSP2108 to Shigeru Fujita); JSPS KAKENHI Grant-in-Aid for Scientific Research C (22K07103, to Terumasa Ikeda); JSPS KAKENHI Grant-in-Aid for Scientific Research B (21H02736, to Takasuke Fukuhara); JSPS KAKENHI Grant-in-Aid for Early-Career Scientists (22K16375, to Hesham Nasser; 20K15767, to Jumpei Ito); JSPS Core-to-Core Program (A. Advanced Research Networks) (JPJSCCA20190008, to Kei Sato); JSPS Research Fellow DC2 (22J11578, to Keiya Uriu); JSPS Research Fellow DC1 (23KJ0710, to Yusuke Kosugi); JSPS Leading Initiative for Excellent Young Researchers (LEADER) (to Terumasa Ikeda); World-leading Innovative and Smart Education (WISE) Program 1801 from the Ministry of Education, Culture, Sports, Science and Technology (MEXT) (to Naganori Nao); Ministry of Health, Labour and Welfare (MHLW) under grant 23HA2010 (to Naganori Nao and Keita Matsuno); The Cooperative Research Program (Joint Usage/Research Center program) of Institute for Life and Medical Sciences, Kyoto University (to Kei Sato); International Joint Research Project of the Institute of Medical Science, the University of Tokyo (to Terumasa Ikeda and Takasuke Fukuhara); The Tokyo Biochemical Research Foundation (to Kei Sato); Takeda Science Foundation (to Terumasa Ikeda and Takasuke Fukuhara); Mochida Memorial Foundation for Medical and Pharmaceutical Research (to Terumasa Ikeda); The Naito Foundation (to Terumasa Ikeda); Hokuto Foundation for Bioscience (to Tomokazu Tamura); Hirose Foundation (to Tomokazu Tamura); and Mitsubishi Foundation (to Kei Sato).

Keywords: BANAL-20-236; Bat coronavirus; SARS-CoV-2; Spillover.


Conflict of interest statement

Declaration of interests Yuki Yamamoto and Tetsuharu Nagamoto are founders and shareholders of HiLung, Inc. Yuki Yamamoto is a co-inventor of patents (PCT/JP2016/057254; "Method for inducing differentiation of alveolar epithelial cells", PCT/JP2016/059786, "Method of producing airway epithelial cells"). Jumpei Ito has consulting fees and honoraria for lectures from Takeda Pharmaceutical Co. Ltd. Kei Sato has consulting fees from Moderna Japan Co., Ltd. and Takeda Pharmaceutical Co. Ltd. and honoraria for lectures from Gilead Sciences, Inc., Moderna Japan Co., Ltd., and Shionogi & Co., Ltd. The other authors declare that no competing interests exist.

Figures

Fig. 1
Fig. 1
B236 replicated in respiratory cell cultures less efficiently than SARS-CoV-2. (a) Representative western blots of purified SARS-CoV-2 (SC2), FCS-deleted SARS-CoV-2 (SC2ΔFCS) and BANAL-20-236 (B236) virions from VeroE6/TMPRSS2 cells stained with anti-S2 (top) and anti-nucleocapsid (bottom) antibodies. (b–f) Viral growth assay. SC2, SC2ΔFCS and B236 were inoculated into Vero cells (b), VeroE6/TMPRSS2 cells (c), human airway organoid-derived air-liquid interface (AO-ALI) system (d), human induced pluripotent stem cell (iPSC)-derived lung alveolar cells (HiAlv) (e) and human induced pluripotent stem cell (iPSC)-derived airway epithelial cells (HiTrach) (f). The copy numbers of viral RNA in the culture supernatant (b and c) and the apical sides of cultures (d-f) were routinely quantified by RT-qPCR (top). The viral titer [50% tissue culture infectious dose (TCID50)] was also measured by the culture supernatant (b and c) and the apical sides of cultures (d-f) (bottom). The horizontal dashed line indicates the detection limit (103.5 TCID50/ml). Assays were performed in triplicate (d) or quadruplicate (b, c, e and f). The presented data are expressed as the average ± 95% confidence intervals (CI). In (b–f), statistically significant differences across timepoints were determined by multiple regression. The familywise error rates (FWERs) calculated using the Holm method (b–f) are indicated in the figures. (g) The log normalized count of SARS-CoV-2 reads in the SC2- and SC2ΔFCS-infected HiTrach iPSC-derived airway epithelial cells and that of B236 reads in the B236-infected cells. The count is normalized to a million unit and then log transformed. n = 4. Numbers above the box plots are adjusted P values calculated by Games–Howell test. (h) The log2 expression fold change of genes listed in the GO Biological Process term “cellular response to type I interferon” (GO:0071357) in the HiTrach iPSC-derived airway epithelial cells infected with SC2, SC2ΔFCS, and B236. Each circle indicates a data point. Red circle, DEG; grey circle, non-DEG. Numbers above the box plots are adjusted P values calculated by Dunn test. (i) The log2 expression fold change of genes related to the suppression of SARS-CoV-2 replication, , , , in the HiTrach iPSC-derived airway epithelial cells infected with SC2, SC2ΔFCS, and B236.
Fig. 2
Fig. 2
B236 is less fusogenic than SARS-CoV-2. (a–b) S-based fusion assay. S protein expression on the cell surface (a). The summarized data are shown. S-based fusion assay in VeroE6/TMPRSS2 cells and HOS-ACE2/TMPRSS2 cells (b). The recorded fusion activity (arbitrary units; Renilla luciferase activity per the surface S MFI) is shown. (c) A plaque assay was performed using VeroE6/TMPRSS2 cells. Left, representative figures. Right, the summary of the size of plaques (n = 20 for each virus). Each dot indicates the diameter of the respective plaque. (d, e) Viral growth in an airway-on-a-chip system. An ancestral SARS-CoV-2 WK-521 strain (Wuhan), Omicron BA.1 (Omicron), Delta variants, and BANAL-20-236 (B236) were inoculated into an airway-on-a-chip system. The copy numbers of viral RNA in the top (d, left) and bottom (d, right) channels of an airway-on-a-chip were routinely quantified by RT-qPCR. In (e), the percentage of viral RNA load in the bottom channel per top channel at 6 d.p.i. (i.e., % invaded virus from the top channel to the bottom channel) is shown. Assays were performed in triplicate (a, d, e) or quadruplicate (b). The presented data are expressed as the average ± standard deviation (SD). In (a, e), each dot indicates the result of an individual replicate. Statistically significant differences versus SC2 or SC2ΔFCS were determined by a two-sided Student's t test (a) or a two-sided Mann–Whitney U test (c). In (b), statistically significant differences across timepoints were determined by multiple regression. The familywise error rates (FWERs) calculated using the Holm method are indicated in the figures. In (e), statistically significant differences were determined by a two-sided Welch's test.
Fig. 3
Fig. 3
B236 is less pathogenic than SARS-CoV-2. Viral growth and pathogenicity in hamster models. Syrian hamsters were intranasally inoculated with SARS-CoV-2 (SC2), FCS-deleted SARS-CoV-2 (SC2ΔFCS) and BANAL-20-236 (B236). Six hamsters of the same age were intranasally inoculated with saline (uninfected). Six hamsters per group were used to routinely measure the respective parameters (a). Four hamsters per group were euthanized at 2 and 5 d.p.i. and used for virological and pathological analysis (b–e). (a) Body weight, enhanced pause (Penh), the ratio of time to peak expiratory flow relative to the total expiratory time (Rpef) and frequency of breath (BPM) values of infected hamsters (n = 6 per infection group). (b) Viral RNA loads in the lung hilum (left) and lung periphery (right) of infected hamsters (n = 4 per infection group). (c) Viral titer [50% tissue culture infectious dose (TCID50)] in the lung periphery of infected hamsters (n = 4 per infection group). The horizontal dashed line indicates the detection limit (101 TCID50/mg tissue). (d) Immunohistochemical (IHC) analysis of the SARS-CoV-2 or BANAL-20-236 N protein in the lungs of infected hamsters at 2 d.p.i. (top) and 5 d.p.i (bottom) (4 hamsters per infection group). In each panel, representative figures of IHC staining (top) and the digitalized N-positive area (bottom, indicated in red) are shown. The red numbers in the bottom panels indicate the percentage of the N-positive area. The percentage of N-positive cells in whole lung lobes (right, n = 4 per infection group) are shown. (e) Type II pneumocytes in the lungs of infected hamsters at 2 d.p.i. (top) and 5 d.p.i (bottom) (4 hamsters per infection group). In each panel, representative figures of H&E staining (top) and the digitalized inflammatory area with type II pneumocytes (bottom, indicated in red) are shown. The red numbers in the bottom panels indicate the percentage of inflammatory area with type II pneumocytes. The percentage of type II pneumocytes in whole lung lobes (right, n = 4 per infection group) are shown. In (a–c), data are presented as the average ± 95% CI. In (a–c), statistically significant differences across timepoints were determined by multiple regression. In (a), the 0 d.p.i. data were excluded from the analyses. The familywise error rates (FWERs) calculated using the Holm method are indicated in the figures. In (d, e), each dot indicates the result of an individual hamster. In (d, e), the statistically significant differences between SC2 and SC2ΔFCS, B236 were determined by a two-sided Mann–Whitney U test. Scale bars, 5 mm (d, e). (f) The log normalized count of SARS-CoV-2 reads in the SC2- and SC2ΔFCS-infected hamster lung hila and peripheries at 2 and 5 d.p.i. and that of B236 reads in the B236-infected lung hilum and periphery at 2 and 5 d.p.i. The count is normalized to a million unit and then log transformed. n = 4, except for certain groups where some data were excluded due to RNA quality (see Supplementary Table S8). Numbers above the box plots are adjusted P values calculated by Dunn test. (g) Number of upregulated and downregulated DEGs in the hamster lung hila and peripheries infected with SC2, SC2ΔFCS, and B236 at 2 and 5 d.p.i. (h) The log2 expression fold change of genes listed in the GO Biological Process term “cellular response to type I interferon” (GO:0071357) in the hamster lung hila and peripheries infected with SC2, SC2ΔFCS, and B236 at 2 and 5 d.p.i. Each circle indicates a data point. Red circle, DEG; grey circle, non-DEG. Numbers above the box plots are adjusted P values calculated by Dunn test. (i) The log2 expression fold change of genes related to the suppression of SARS-CoV-2 replication, , , , in the hamster lung hila and peripheries infected with SC2, SC2ΔFCS, and B236 at 2 and 5 d.p.i.
Fig. 4
Fig. 4
B236 is more enterotropic than SARS-CoV-2. (a-b) Viral growth assay. SARS-CoV-2 (SC2), FCS-deleted SARS-CoV-2 (SC2ΔFCS), and BANAL-20-236 (B236) were inoculated into human iPSC-derived colon organoids (a) and Caco-2 cells (b). The copy numbers of viral RNA in the culture supernatants were routinely quantified by RT-qPCR (top). The viral titer [50% tissue culture infectious dose (TCID50)] was also measured by the culture supernatant (right). The horizontal dashed line indicates the detection limit (103.5 TCID50/ml). Assays were performed in triplicate (a) or quadruplicate (b). The presented data are expressed as the average ± 95% CI. Statistically significant differences across time points were determined by multiple regression. The familywise error rates (FWERs) calculated using the Holm method are indicated in the figures. (c) Immunofluorescence analysis of human iPSC-derived colon organoids stained with SC2/B236 N protein (red). Nuclei were counterstained with DAPI (blue). (d) The log normalized count of B236 reads in the B236-infected iPSC-derived colon organoids and that of SARS-CoV-2 reads in the SC2- and SC2ΔFCS-infected colon organoids. The count is normalized to a million unit and then log transformed. n = 3. Numbers above the box plots are adjusted P values calculated by Tukey's HSD test. (e) Number of upregulated and downregulated DEGs in the colon organoids infected with B236, SC2, and SC2ΔFCS differentially expressed from those in mock-infected colon organoids. (f) Principal component (PC) plot of log2 expression fold change profile of genes in the HiTrach iPSC-derived airway epithelial cells and colon organoids infected with B236, SC2, and SC2ΔFCS. The number in the PC axis title shows the percentage of variance explained by the PC. The total number of PCs is six. (g) The log2 expression fold change of genes related to the suppression of SARS-CoV-2 replication in the colon organoids infected with SC2, SC2ΔFCS, and B236. (h) The log2 expression fold change of marker genes for colonic cells including goblet cell, colonocyte, enteroendocrine cell, and tuft cell. (i) Immunofluorescence analysis of human iPSC-derived colon organoids stained with SC2/B236 N protein (red) and villin (green). Nuclei were counterstained with DAPI (blue).
Supplementary Fig. S1
Percentage identity between B236 and SARS-CoV-2 proteins.
Supplementary Fig. S2
Functional enrichment analysis of the B236- and SARS-CoV-2-infected airway epithelial cells. (a) Number of upregulated and downregulated differentially expressed genes (DEGs), genes whose expression differs among comparison groups, in the human iPSC-derived airway epithelial cells (HiTrach) infected with SARS-CoV-2 (SC2), FCS-deleted SARS-CoV-2 (SC2ΔFCS), and BANAL-20-236 (B236). (b) Scatter plot showing log2 fold change of the top 100 genes with the highest disco scores whose expression was upregulated or downregulated in the B236- and SC2-infected airway epithelial cells. B236-Up/SC2-Up, B236-Down/SC2-Down, B236-Up/SC2-notUp, B236-Down/SC2-notDown, B236-notUp/SC2-Up, and B236-notDown/SC2-Down denote gene groups with different expression regulation patterns. Up, Down, notUp, and notDown stand for genes whose expression was upregulated, downregulated, not upregulated (downregulated or not significantly changed), and not downregulated (upregulated or not significantly changed) compared to the mock-infected group, respectively. (c) Functional enrichment plot showing gene ratio and adjusted P value of the top ten GO Biological Process terms enriched with the top 100 genes of each expression category shown in (b). The number in parentheses represents the number of identified genes in the GO Biological Process database.
Supplementary Fig. S3
Pseudovirus assay in human and hamster ACE2 expressing cells. HIV-1-based reporter viruses pseudotyped with the S proteins of B236 or SARS-CoV-2 were prepared. The pseudoviruses were inoculated into a series of HOS-TMPRSS2 cells stably expressing human or hamster ACE2 cells at 1 ng HIV-1 p24 antigen. The percent infectivity compared with that of the virus pseudotyped with the SARS-CoV-2 (SC2) protein are shown. Assays were performed in quadruplicate. The presented data are expressed as the average ± standard deviation (SD). Statistically significant differences were determined by a two-sided Student's t test.
Supplementary Fig. S4
Functional enrichment analysis of the B236- and SARS-CoV-2-infected hamster lung hila and peripheries at 2 and 5 d.p.i. Functional enrichment plot showing gene ratio and adjusted P value of the top ten GO Biological Process terms enriched with the top 100 genes with the highest disco scores in each expression category. See "Functional enrichment analysis” section for denomination of the gene expression categories in detail. The number in parentheses represents the number of identified genes in the GO Biological Process database.
Supplementary Fig. S5
Search for human proteases involved in SARS-CoV-2 and B236 infection. (a) The z score of log2 expression fold change of intestinal marker genes in the human iPSC-derived colon organoids, total RNA of human adult and fetal small intestines, and Caco-2 cells. The dendrogram was depicted using hierarchical clustering with Ward’s method. (b) Normalized count of six known SARS-CoV-2 entry factor genes, , , in the mock-infected airway epithelial cell cultures and colon organoids in transcripts per million (TPM) unit. (c) Normalized count of 34 human proteases, including 20 serine proteases, 6 membrane-type matrix metalloproteinases (MMPs), and 8 a disintegrin and metalloproteinases (ADAMs), in the mock-infected airway epithelial cells and colon organoids in transcripts per million (TPM) unit. (d–f) Pseudovirus infection assay with protease expression. HIV-1-based reporter viruses pseudotyped with the S proteins of SARS-CoV-2 (SC2), FCS-deleted SARS-CoV-2 (SC2ΔFCS) and BANAL-20-236 (B236) were prepared. Pseudovirus infection (1.5×10⁶ relative light unit each virus) was performed in HEK293 cells overexpressing human ACE2 and (d) serine proteases, (e) MMPs or (f) ADAMs. The fold change of infectivity in each cell was normalized to cells transfected with empty vector control.
Supplementary Fig. S6
Functional enrichment analysis of the B236- and SARS-CoV-2-infected colon organoids. (a) The log2 expression fold change of genes listed in the GO Biological Process term “cellular response to type I interferon” (GO:0071357) in the colon organoids infected with SC2, SC2ΔFCS, and B236. Each circle indicates a data point. Red circle, DEG; grey circle, non-DEG. Numbers above the box plots are adjusted P values calculated by Dunn test. (b–d) Functional enrichment plots showing gene ratios and adjusted P values of the top ten (b) GO Biological Process, (c) GO Cellular Component, and (d) KEGG terms enriched with the top 100 genes with the highest disco scores in each expression category. See “Functional enrichment analysis” section for denomination of the gene expression categories in detail. The number in parentheses represents the number of identified genes in each functional database.
Supplementary Fig. S7
Gating strategy for flow cytometry. A representative dot plot of the gating for flow cytometry is shown. FSC, forward scatter; SSC, side scatter.

Similar articles

Cited by

References

    1. Zhu N., Zhang D., Wang W., et al. A novel coronavirus from patients with pneumonia in China, 2019. N Engl J Med. 2020;382(8):727–733. - PMC - PubMed
    1. Wu F., Zhao S., Yu B., et al. A new coronavirus associated with human respiratory disease in China. Nature. 2020;579(7798):265–269. - PMC - PubMed
    1. Lu R., Zhao X., Li J., et al. Genomic characterisation and epidemiology of 2019 novel coronavirus: implications for virus origins and receptor binding. Lancet. 2020;395(10224):565–574. - PMC - PubMed
    1. Harvey W.T., Carabelli A.M., Jackson B., et al. SARS-CoV-2 variants, spike mutations and immune escape. Nat Rev Microbiol. 2021;19(7):409–424. - PMC - PubMed
    1. Carabelli A.M., Peacock T.P., Thorne L.G., et al. SARS-CoV-2 variant biology: immune escape, transmission and fitness. Nat Rev Microbiol. 2023;21(3):162–177. - PMC - PubMed