Clinical Trial
. 2024 Jun;9(6):103489.
doi: 10.1016/j.esmoop.2024.103489. Epub 2024 Jun 4.

Circulating immune-related proteins associated with immune checkpoint inhibitor efficacy in patients with pancreatic ductal adenocarcinoma

Affiliations
Clinical Trial

Circulating immune-related proteins associated with immune checkpoint inhibitor efficacy in patients with pancreatic ductal adenocarcinoma

T D Christensen et al. ESMO Open. 2024 Jun.

Abstract

Background: Most patients with pancreatic ductal adenocarcinoma (PDAC) do not benefit from immune checkpoint inhibitor treatment. However, the phase II study CheckPAC (NCT02866383) showed a clinical benefit (CB) rate of 37% and a response rate of 14% in patients with metastatic PDAC receiving stereotactic radiation therapy and nivolumab with or without ipilimumab. Translational studies were initiated to characterize the patients who would benefit from this treatment. Here, we evaluated the association between treatment outcome and 92 circulating immuno-oncology-related proteins in patients from the CheckPAC trial.

Materials and methods: The study included 78 patients with chemoresistant metastatic PDAC treated with nivolumab ± ipilimumab combined with radiotherapy. Proteins were measured in serum samples collected at baseline and on treatment with the use of the Olink Target 96 Immuno-Oncology panel. A cohort of 234 patients with metastatic PDAC treated with first-line chemotherapy were also included.

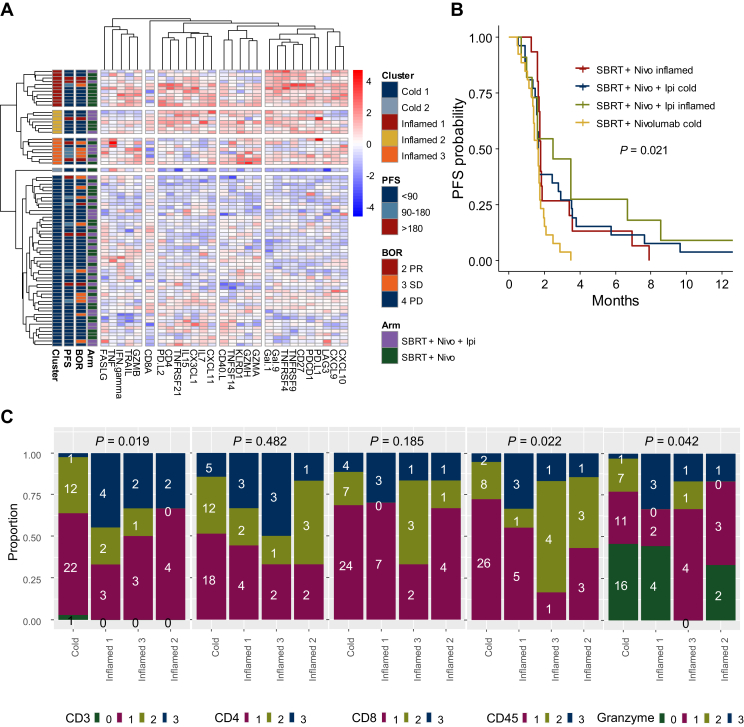
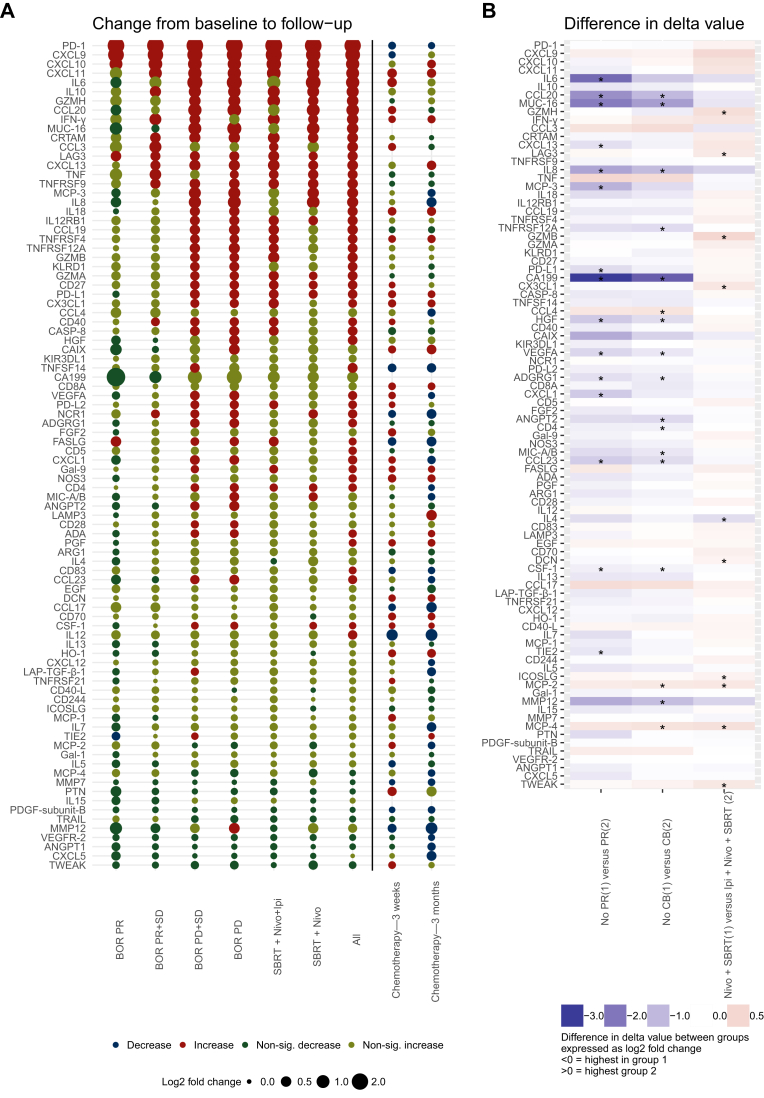
Results: High levels of Fas ligand (FASLG) and galectin 1 (Gal-1) and low levels of C-C motif chemokine 4 were associated with CB. High FASLG and Gal-1 were associated with longer progression-free survival in univariable analysis. In the multivariable Cox regression analysis, the association was significant for Gal-1 (P < 0.001) but not significant for FASLG (P = 0.06). A focused unsupervised hierarchal clustering analysis, including T-cell activation and immune checkpoint-related proteins, identified clusters of patients with higher CB rate and higher tumor expression of leukocyte or T-cell markers (CD3, CD45, granzyme B). Thirty-six proteins increased significantly during immunotherapy. Several proteins (including FASLG, checkpoint proteins, and immune activation markers) increased independently of response during immunotherapy but did not increase in the cohort of patients treated with chemotherapy.

Conclusions: Circulating levels of immune-related proteins like FASLG and Gal-1 might be used to predict the efficacy of checkpoint inhibitors in patients with metastatic PDAC.

Keywords: biomarkers; circulating proteins; immune checkpoint inhibitor; immuno-oncology; pancreatic cancer.


Figures

Figure 1
Figure 1
Difference in baseline protein level. (A) Volcano plot showing differences in levels of all proteins between patients with clinical benefit (CB) versus patients without CB. The x-axis shows difference calculated as log2 fold change. A negative log-fold change corresponds to protein levels being highest in patients with CB. The y-axis shows the negative logarithm of the P value. Proteins above the horizontal dash line have a P value <0.05. (B) Box plots showing protein levels as normalized protein expression (NPX) for patients with CB versus no CB for the three proteins with a P value <0.05. (C) Heatmap showing differences in protein levels between patients with no CB versus CB and no partial response (PR) versus PR. Difference calculated as log2-fold change. The red color indicates levels highest in patients with benefit (CB and PR) and the blue color indicates levels highest in patients without (no CB and no-PR). Statistically significant differences are marked with ∗. CB, clinical benefit; CCL4, C-C motif chemokine 4; FASLG, Fas ligand; Gal-1, galectin 1. PR, partial response.
Figure 2
Figure 2
Association between baseline protein level and PFS and OS. Kaplan–Meier plots showing PFS for patients with high, intermediate, and low concentration of selected proteins divided according to tertiles (T). T1, protein levels <33.3%; T2, protein levels between 33.3% and 66.6%; and T3, protein levels >66.7%. ANGPT2, angiopoietin 2; FASLG, Fas antigen ligand or tumor necrosis factor ligand superfamily member 6; Gal-1, galectin 1; MUC-16, mucin 16; OS, overall survival; PFS, progression-free survival.
Figure 3
Figure 3
Focused unsupervised hierarchal clustering based on baseline blood sample results. (A) Focused unsupervised hierarchal clustering including T-cell activation-related proteins and T-cell inhibitory checkpoint receptor or ligands as well as Gal-1. (B) Kaplan–Meier plot of PFS stratified according to overall cluster and treatment arm. (C) Associations between clusters and expression of CD3, CD4, CD8, CD45, and granzyme B in tumor biopsies as assessed semiquantitatively, with 0 indicating no positive cells, 1 indicating mild density of positive immune cells, 2 indicating moderate density of positive immune cells, and 3 indicating high density of positive immune cells. BOR, best overall response; Gal-1, galectin 1; Ipi, ipilimumab; Nivo, nivolumab; PD, progressive disease; PFS, progression-free survival; PR, partial response; SBRT, stereotactic body radiotherapy; SD, stable disease.
Figure 4
Figure 4
Changes in circulating proteins from baseline to follow-up. (A) Dot plot showing difference in protein levels from baseline to on-treatment for matched samples for different groups of patients. Size of dots shows difference in protein levels expressed as log2 fold change. Color indicates if protein levels increased or decreased and whether significant or not. (B) Heatmap showing difference in protein delta value (on-treatment level minus baseline level) between patients in different response groups and treatment arms. Differences are expressed as log-fold change. Negative log-fold change (blue) specifies delta value highest in group 2. Positive log-fold change (red) specifies delta value highest in group 1. ∗Significant difference. BOR, best overall response; CB, clinical benefit; FU, follow-up sample; Ipi, ipilimumab; Nivo, nivolumab; PD, progressive disease; PR, partial response; SBRT, stereotactic body radiotherapy; SD, stable disease.

References

    1. Siegel R.L., Miller K.D., Wagle N.S., Jemal A. Cancer statistics, 2023. CA Cancer J Clin. 2023;73(1):17–48. - PubMed
    1. Mizrahi J.D., Surana R., Valle J.W., Shroff R.T. Pancreatic cancer. Lancet. 2020;395(10242):2008–2020. - PubMed
    1. Conroy T., Desseigne F., Ychou M., et al. FOLFIRINOX versus gemcitabine for metastatic pancreatic cancer. N Engl J Med. 2011;364(19):1817–1825. - PubMed
    1. Von Hoff D.D., Ervin T., Arena F.P., et al. Increased survival in pancreatic cancer with nab-paclitaxel plus gemcitabine. N Engl J Med. 2013;369(18):1691–1703. - PMC - PubMed
    1. Wang-Gillam A., Li C.P., Bodoky G., et al. Nanoliposomal irinotecan with fluorouracil and folinic acid in metastatic pancreatic cancer after previous gemcitabine-based therapy (NAPOLI-1): a global, randomised, open-label, phase 3 trial. Lancet. 2016;387(10018):545–557. - PubMed

Publication types

LinkOut - more resources