. 2024 Jun 4;36(6):1394-1410.e12.
doi: 10.1016/j.cmet.2024.05.002.

Imaging brain glucose metabolism in vivo reveals propionate as a major anaplerotic substrate in pyruvate dehydrogenase deficiency

Affiliations

Imaging brain glucose metabolism in vivo reveals propionate as a major anaplerotic substrate in pyruvate dehydrogenase deficiency

Isaac Marin-Valencia et al. Cell Metab. .

Abstract

A vexing problem in mitochondrial medicine is our limited capacity to evaluate the extent of brain disease in vivo. This limitation has hindered our understanding of the mechanisms that underlie the imaging phenotype in the brain of patients with mitochondrial diseases and our capacity to identify new biomarkers and therapeutic targets. Using comprehensive imaging, we analyzed the metabolic network that drives the brain structural and metabolic features of a mouse model of pyruvate dehydrogenase deficiency (PDHD). As the disease progressed in this animal, in vivo brain glucose uptake and glycolysis increased. Propionate served as a major anaplerotic substrate, predominantly metabolized by glial cells. A combination of propionate and a ketogenic diet extended lifespan, improved neuropathology, and ameliorated motor deficits in these animals. Together, intermediary metabolism is quite distinct in the PDHD brain-it plays a key role in the imaging phenotype, and it may uncover new treatments for this condition.

Keywords: brain; glucose; imaging; ketogenic diet; metabolism; propionate; pyruvate; pyruvate dehydrogenase deficiency.


Conflict of interest statement

Declaration of interests K.R.K. is a founder with equity interest of Atish Technologies, Inc. and a member of the scientific advisory boards of NVision Imaging Technologies, Imaginostics, and Mi2. K.R.K. holds patents related to imaging and modulation of cellular metabolism. I.M.-V., K.R.K., C.R.-N., M.G.R., and A.K. are in the process of a patent application for the use of propionate as a therapeutic agent for PDHD and other neurometabolic diseases.

Figures

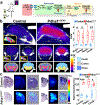
Figure 1.
Figure 1.. Structural and molecular characterization of the Pdha1hGFAP brain.
(A) Immunofluorescence staining to visualize Cre-recombinase expression indicated by GFP in a P21 hGFAP-cre;Rosa26GFP reporter mouse brain. Scale bar: 2 mm. (B) Cresyl violet staining on sagittal sections of control and Pdha1hGFAP mouse brain. Scale bar: 2 mm. (C) Western blot and quantification of Pdha1 expression and total PDH activity in control and Pdha1hGFAP cortex, hippocampus, and cerebellum (N=3/group). Western blot of Pdha1 in granule cell neurons and glial cells from P7 cerebella of Pdha1hGFAP and control mice. Molecular weight markers are displayed in Kd. (D) Tunel staining and quantification of Tunel positive area normalized to the Dapi area in cortex, hippocampus, and cerebellum (N=3/group). (E) Immunofluorescence staining and quantification of neuronal density, as reported by NeuN, and density of reactive astrocytes, as reported by cell size of GFAP+ cells, in cortex (scale bar: 200 μm), hippocampus (scale bar: 200 μm), and cerebellum (scale bar: 50 μm) (N=5/group). GCL: granule cell layer. Unpaired Student t-test was used to carry out the statistical analysis hereafter unless specified otherwise. Values are expressed in mean ± S.E.M in all figures unless indicated otherwise. *: p< 0.05, **: p< 0.01, ***: p< 0.001.
Figure 2.
Figure 2.. Brain MRI, 1H-MRS, and 13C-Hyperpolarized MRI.
(A) Sagittal and coronal T2-weighted MRI of control and Pdha1hGFAP brain. Yellow squares depict where voxels were placed to perform 1H-MRS analysis. Yellow and orange arrows illustrate T2-weighted hyperintensities in the cortex and hippocampus in the Pdha1hGFAP mouse brain, respectively. (B) PCA analysis of animal groups and individual metabolites. (C) Representative 1H-MRS of cortex, hippocampus, and cerebellum normalized to creatinine and quantification of peak intensity areas for each metabolite (N=8/group). A Welch T-test with Benjamini-HochBerg correction for multiple comparison analysis was performed, and p-adjusted values were reported. (D) Schematic of 13C-hyperpolarized (HP) pyruvate metabolism in the cell and quantification of bicarbonate:lactate ratio are illustrated (Control: N=5, Pdha1hGFAP: N=4).
Figure 3.
Figure 3.. Gliovascular unit and expression of glucose transporters.
(A) Schematic of the gliovascular unit and immunostaining of blood vessels and astrocytes in the hippocampus using GLUT1 and GFAP markers, respectively (3 sections/animal, 3 animals/group). Scale bars: 20 μm. (B) Immunofluorescence staining of blood vessels using GLUT1 marker (Bar = 200 μm), Imaris 3D reconstruction of blood vessels (Bar = 20 μm), and quantification of average and total blood vessel diameter in cortex, hippocampus, and cerebellum (N = 5/group). (C) Quantitative Western blot analysis of GLUT1 and GLUT3 in cortex, hippocampus, and cerebellum (N = 5/group).
Figure 4.
Figure 4.. FDG-PET/CT and 14C-2DG autoradiography analyses from control and Pdha1hGFAP brains.
(A) Schematic showing metabolism of FDG and 14C-2DG in neurons and astrocytes. (B) Representative coronal and sagittal FDG-PET/CT brain images of control and Pdha1hGFAP mice and brain atlas–guided PET quantification in standardized uptake value (SUV) (Control: N=8, Pdha1hGFAP: N=6). (C) Autoradiography and cresyl violet staining of coronal sections from both groups and quantification of 14C-2DG signal intensity (N=4/group). Cereb: cerebellum, Hip: hippocampus, DCN: deep cerebellar nuclei.
Figure 5.
Figure 5.. Analysis of [U-13C]-glucose metabolism in the brain.
(A) Design of the experiment. (B) Analysis of metabolites pool size based on mass spectrometry signal intensity in blood, cortex, hippocampus, and cerebellum and Pdha1hGFAP:control ratio of signal intensities (N=7/group). (C) Heatmaps of Pdha1hGFAP:control fold change of isotopologue enrichments of metabolites identified in blood, brain, cortex, hippocampus, and cerebellum. Scale restricted from 1 to −1 for illustration purposes. (D) Average of Pdha1hGFAP:control fold change of total 13C enrichment of metabolites in the brain. Cluster dendrogram demarcating metabolite groups based on labeled/total pools. (E) Isotopologue analysis of brain metabolites in the Pdha1hGFAP brain relative to the control brain expressed as fold changes. (F) Schematic of 13C enrichments of glycolytic metabolites and the first turn of the Krebs cycle metabolites in the Pdha1hGFAP brain relative to the control expressed as fold changes. 3-PG: 3-phosphoglycerate, OAA: oxaloacetate, α-KG: α-ketoglutarate.
Figure 6.
Figure 6.. Analysis of [U-13C]-propionate metabolism in the brain.
(A) Design of the [U-13C]propionate experiment. (B) Heatmap of Pdha1hGFAP:control fold change of isotopologue enrichment of metabolites identified in cortex, hippocampus, and cerebellum (Control: N=7, Pdha1hGFAP: N=6). (C) Pdha1hGFAP : control fold change of M3 enrichment of metabolites in the brain. (D) Isotopologue analysis of brain metabolites in the Pdha1hGFAP brain relative to the control brain expressed in fold change. (E) Representative 13C-NMR spectrum from control and Pdha1hGFAP mice. Demarcated regions in each spectrum (star and parenthesis) are expanded in panel F. (F) 13C-NMR spectrum and isotopomer analysis of glutamate, glutamine, and aspartate C3. (G) Isotopologue fractional enrichment of CoAs and ratios of M3 enrichments between Pdha1hGFAP and control brains (H) Schematic of the proposed compartmentalized propionate metabolism in astrocytes and neurons. Glut: glutamate, Gln: glutamine, OAA: oxaloacetate, α-KG: α-ketoglutarate, Asp: aspartate, Ala: alanine, Tau: taurine, NAA: N-acetyl-aspartate. C#: carbon labeled in position #. Sx: singlet, Dxx: doublet, Q: quartet.
Figure 7.
Figure 7.. Analysis of dietary propionate on survival, weight gain, pathological findings, and motor dysfunction of Pdha1hGFAP mice.
(A) Schematic of the three dietary regimens administered during gestation and the postnatal period, and the metabolic pathways targeted with each diet. (B) Survival curves of Pdha1hGFAP mice on chow diet (N=7), ketogenic diet (KD) (N=8), KD with sodium propionate 50 mM on the drinking water (KDP) (N=8), and chow diet with 150 mM of sodium propionate (Prop) (N=7). Log-rank statistical test was used to compare the survival distributions of animals among experimental diets. (C) Analysis of weight gain during the first 30 postnatal days of Pdha1hGFAP mice subjected to each dietary condition (Chow, N=5, KD, N=9, KDP, N=8, Prop, N=7). A pairwise t-test analysis followed by Benjamini-Hochberg p-value correction was used hereafter in this figure to compare the chow diet group with other experimental dietary groups individually. (D) Analysis of neuronal density as defined by NeuN+ cells in each region (normalized to the wildtype group of each experimental condition for comparison purposes), and reactive astrocytosis, denoted by GFAP+ cells of sizes established in Pdha1hGFAP mice on a regular diet, within the cortex, hippocampus, and cerebellum (Chow, N=7, KD, N=5, KDP, N=4, Prop, N=3). Scale bars in cortex (100 μm), hippocampus (200 μm), and cerebellum (50 μm). (E) Analysis of lateral body sway (pixels) of both control and Pdha1hGFAP mice while walking on an open field platform (Chow, N=9, KD, N=9, KDP, N=8, Prop, N=9). GCL: granule cell layer. NS: not significant.

References

    1. Finsterer J, and Zarrouk-Mahjoub S (2018). Cerebral imaging in paediatric mitochondrial disorders. Neuroradiol J 31, 596–608. 10.1177/1971400918786054. - DOI - PMC - PubMed
    1. Bianchi MC, Tosetti M, Battini R, Manca ML, Mancuso M, Cioni G, Canapicchi R, and Siciliano G (2003). Proton MR spectroscopy of mitochondrial diseases: analysis of brain metabolic abnormalities and their possible diagnostic relevance. AJNR Am J Neuroradiol 24, 1958–1966. - PMC - PubMed
    1. Weiduschat N, Kaufmann P, Mao X, Engelstad KM, Hinton V, DiMauro S, De Vivo D, and Shungu D (2014). Cerebral metabolic abnormalities in A3243G mitochondrial DNA mutation carriers. Neurology 82, 798–805. 10.1212/WNL.0000000000000169. - DOI - PMC - PubMed
    1. Marin-Valencia I, Good LB, Ma Q, Malloy CR, Patel MS, and Pascual JM (2012). Cortical metabolism in pyruvate dehydrogenase deficiency revealed by ex vivo multiplet (13)C NMR of the adult mouse brain. Neurochem Int 61, 1036–1043. 10.1016/j.neuint.2012.07.020. - DOI - PMC - PubMed
    1. Pirot N, Crahes M, Adle-Biassette H, Soares A, Bucourt M, Boutron A, Carbillon L, Mignot C, Trestard L, Bekri S, and Laquerriere A (2016). Phenotypic and Neuropathological Characterization of Fetal Pyruvate Dehydrogenase Deficiency. J Neuropathol Exp Neurol 75, 227–238. 10.1093/jnen/nlv022. - DOI - PubMed

LinkOut - more resources