. 2024 Jul 11;187(14):3690-3711.e19.
doi: 10.1016/j.cell.2024.05.003. Epub 2024 Jun 4.

Clonal hematopoiesis driven by mutated DNMT3A promotes inflammatory bone loss

Affiliations

Clonal hematopoiesis driven by mutated DNMT3A promotes inflammatory bone loss

Hui Wang et al. Cell. .

Abstract

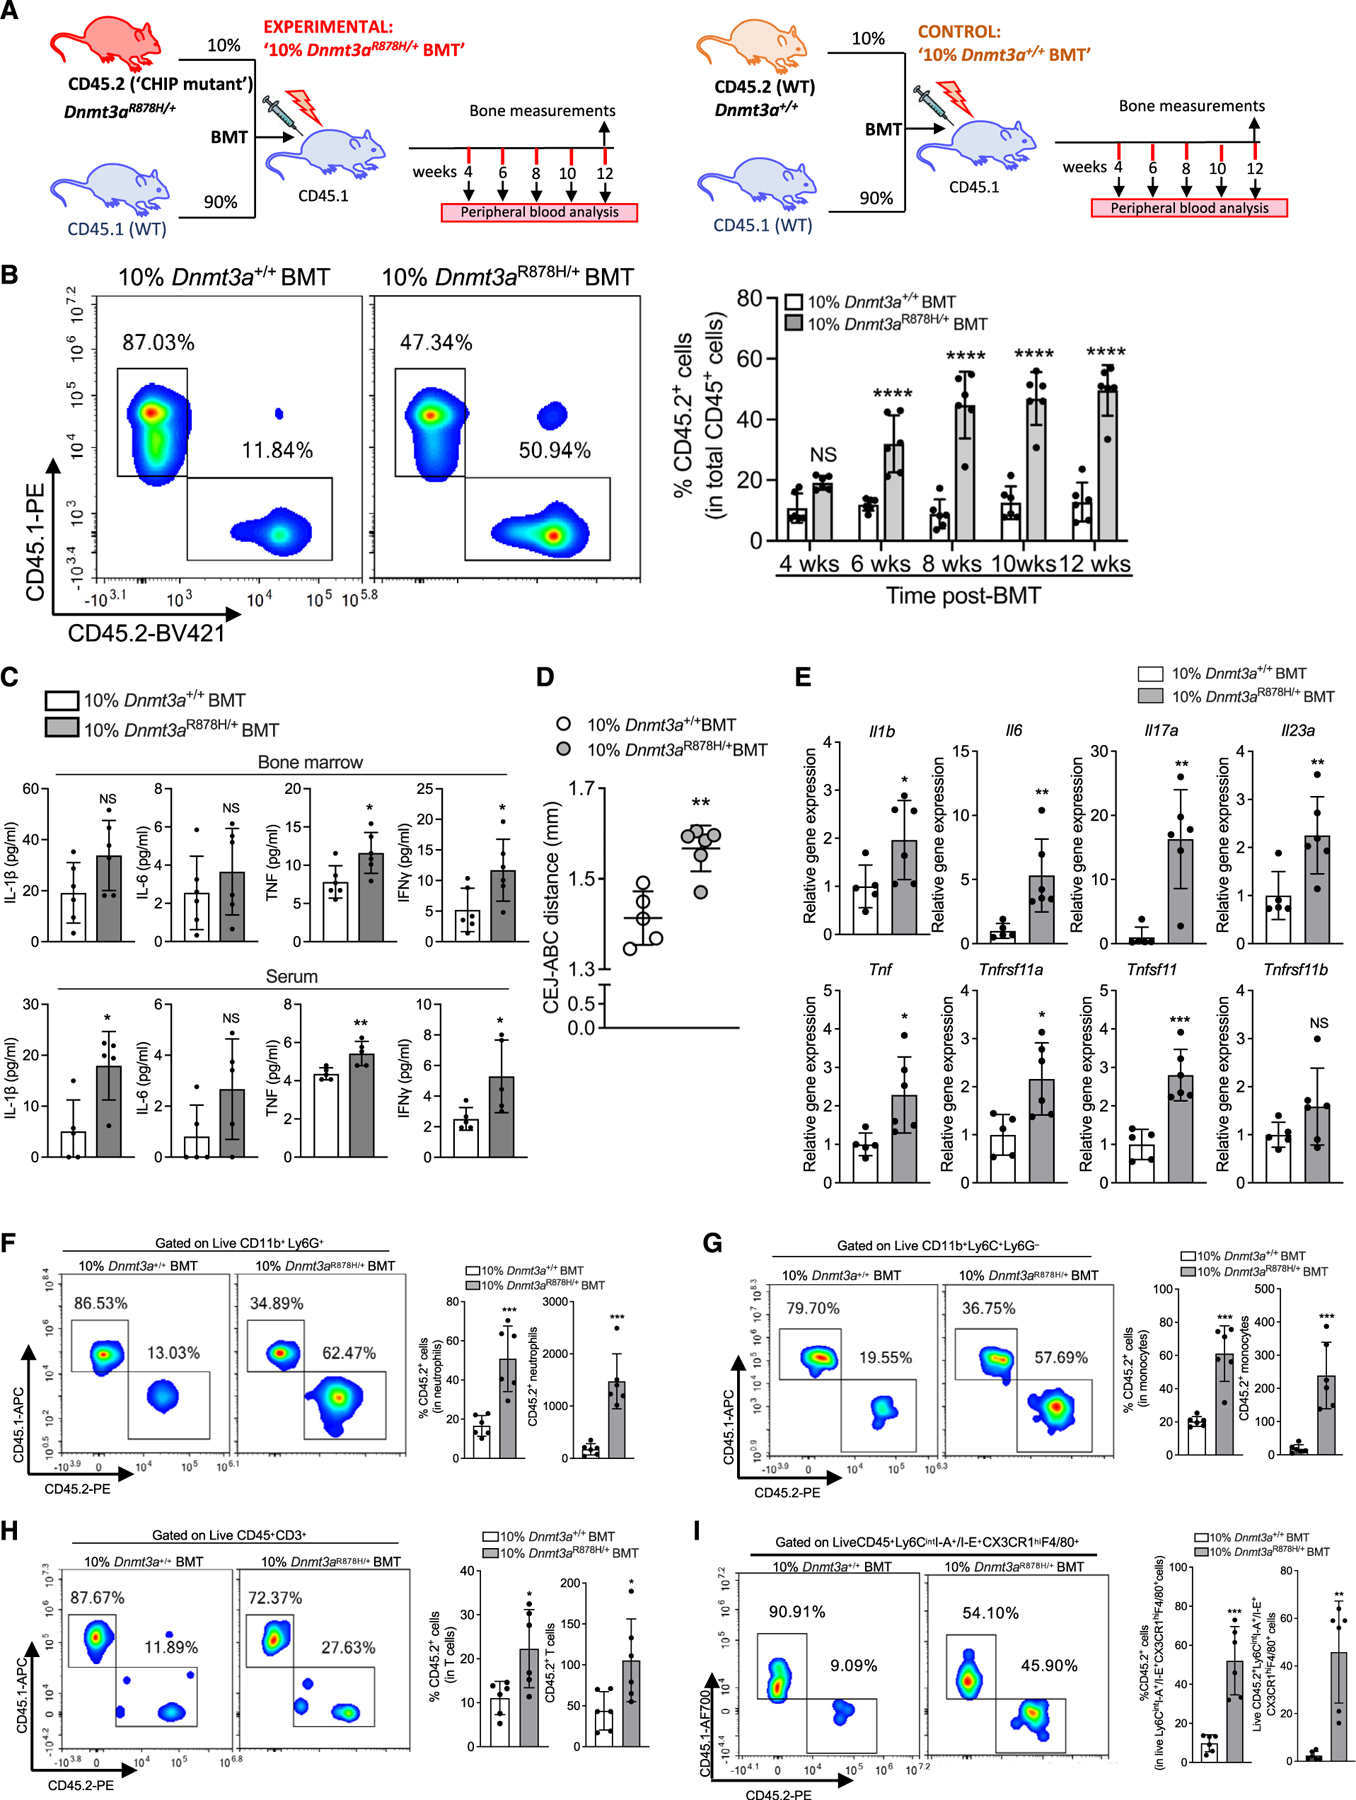
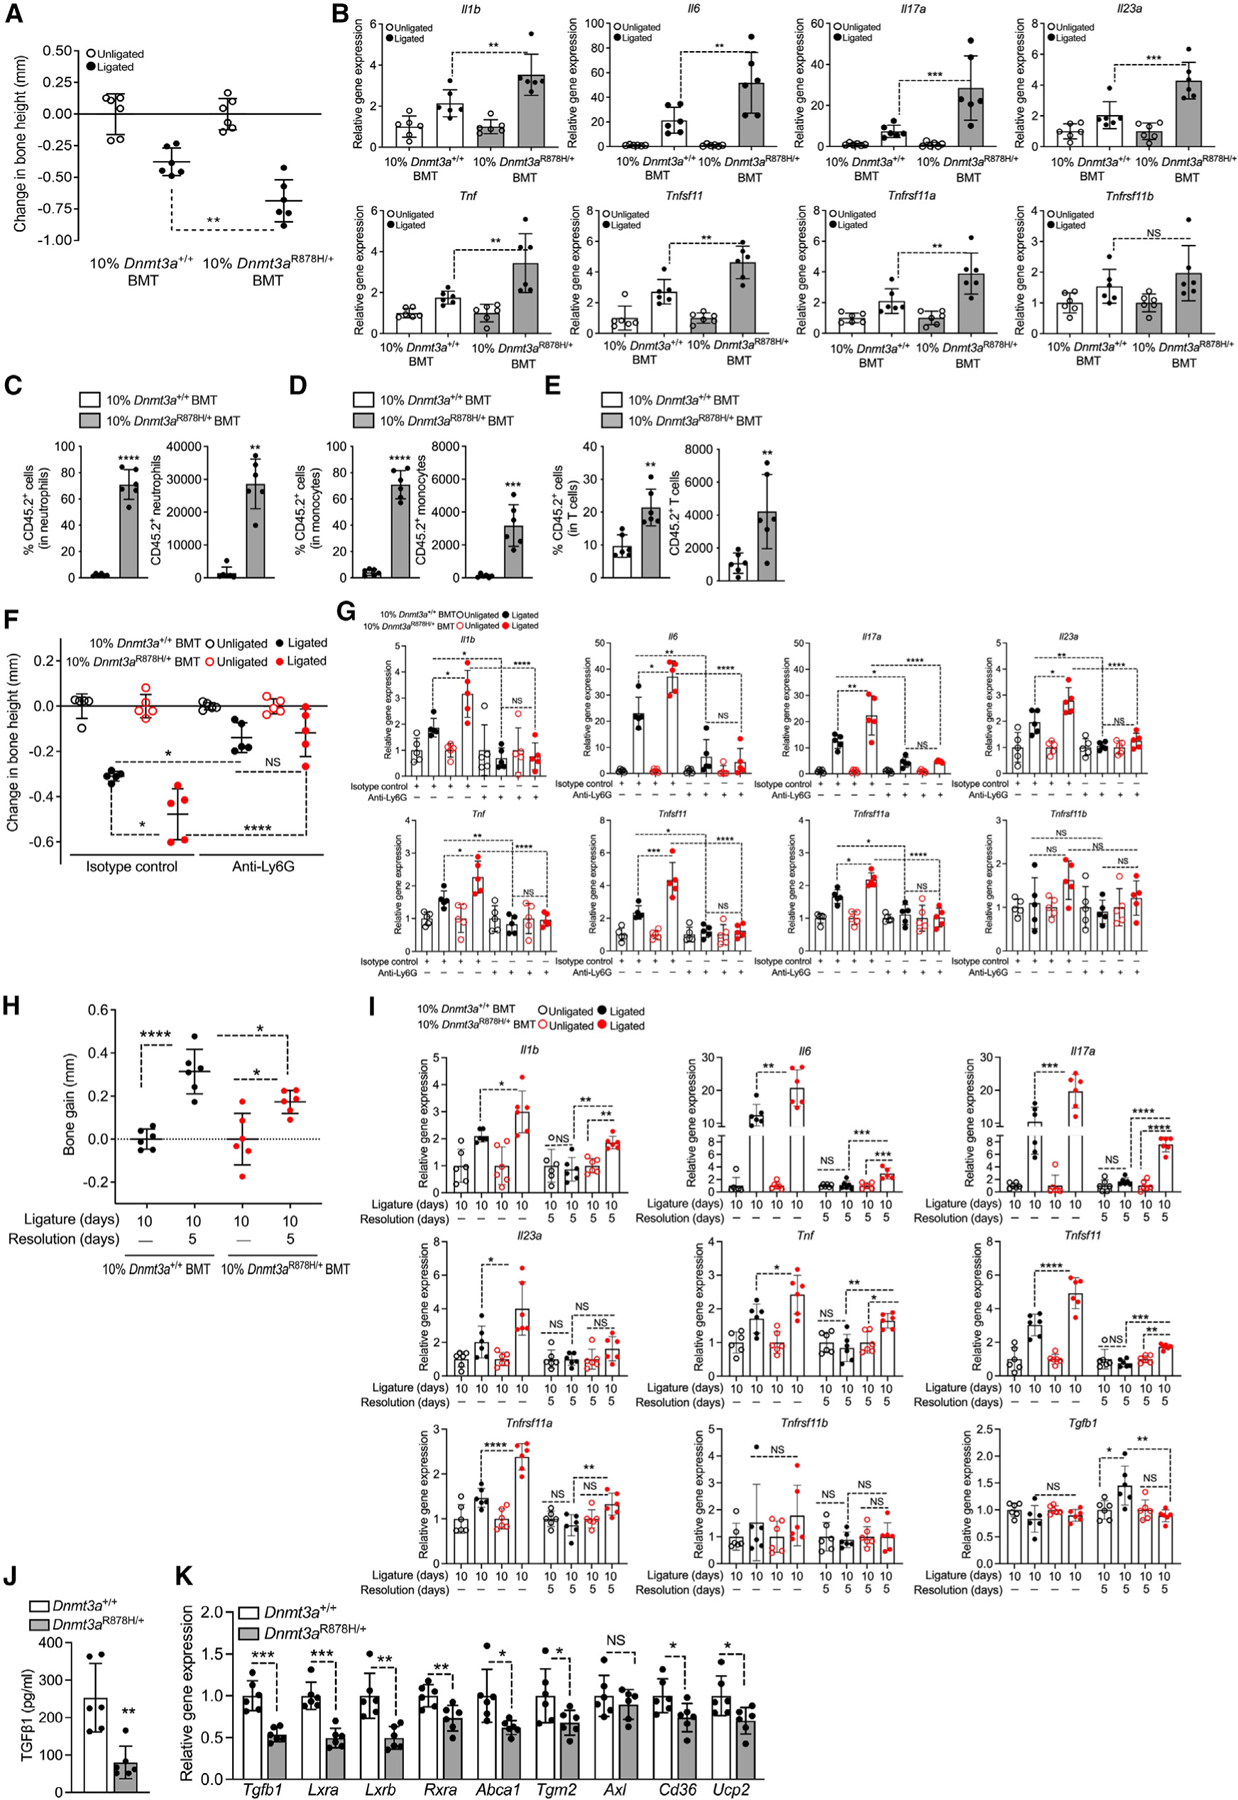
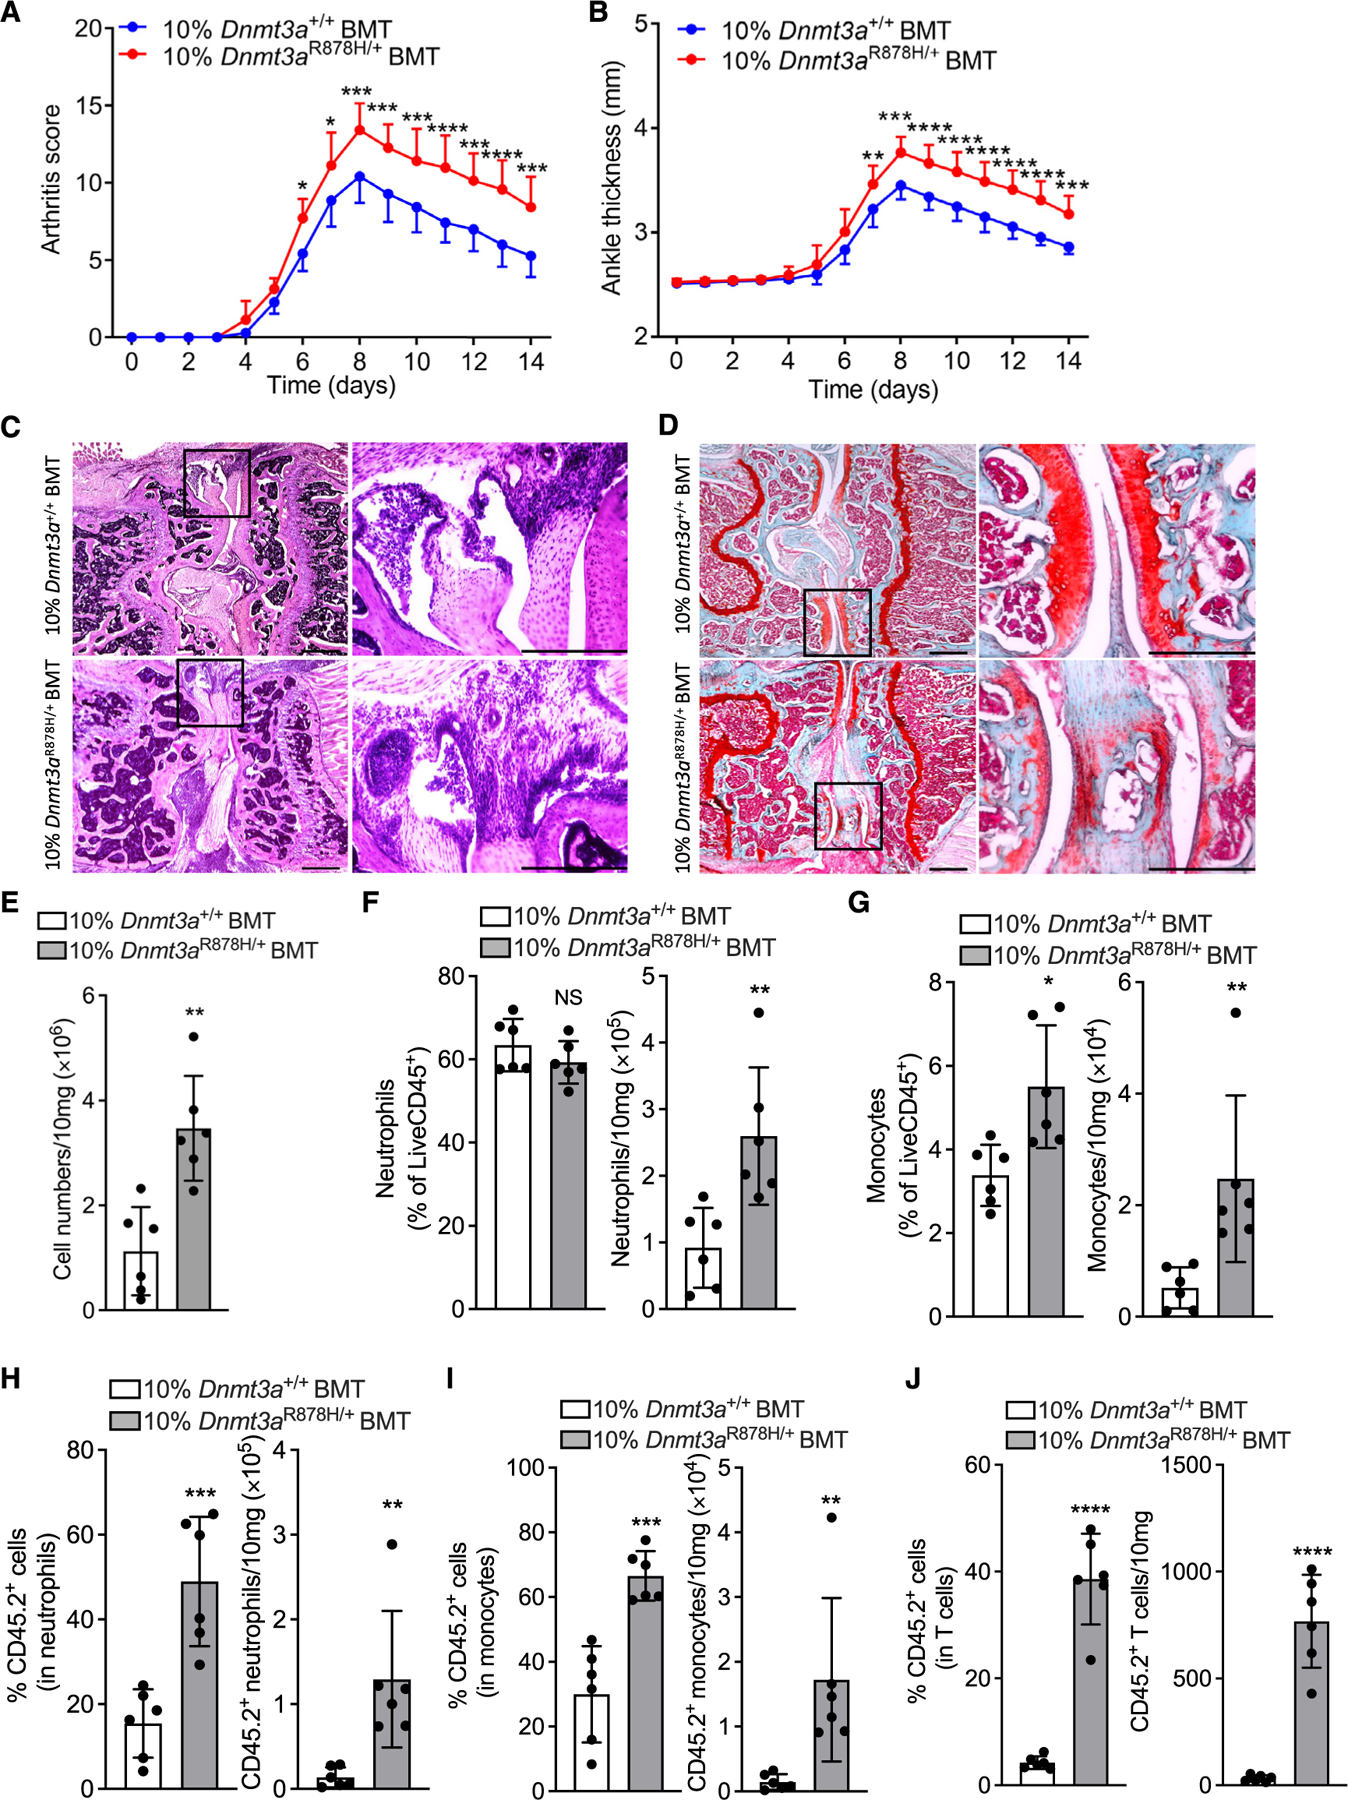
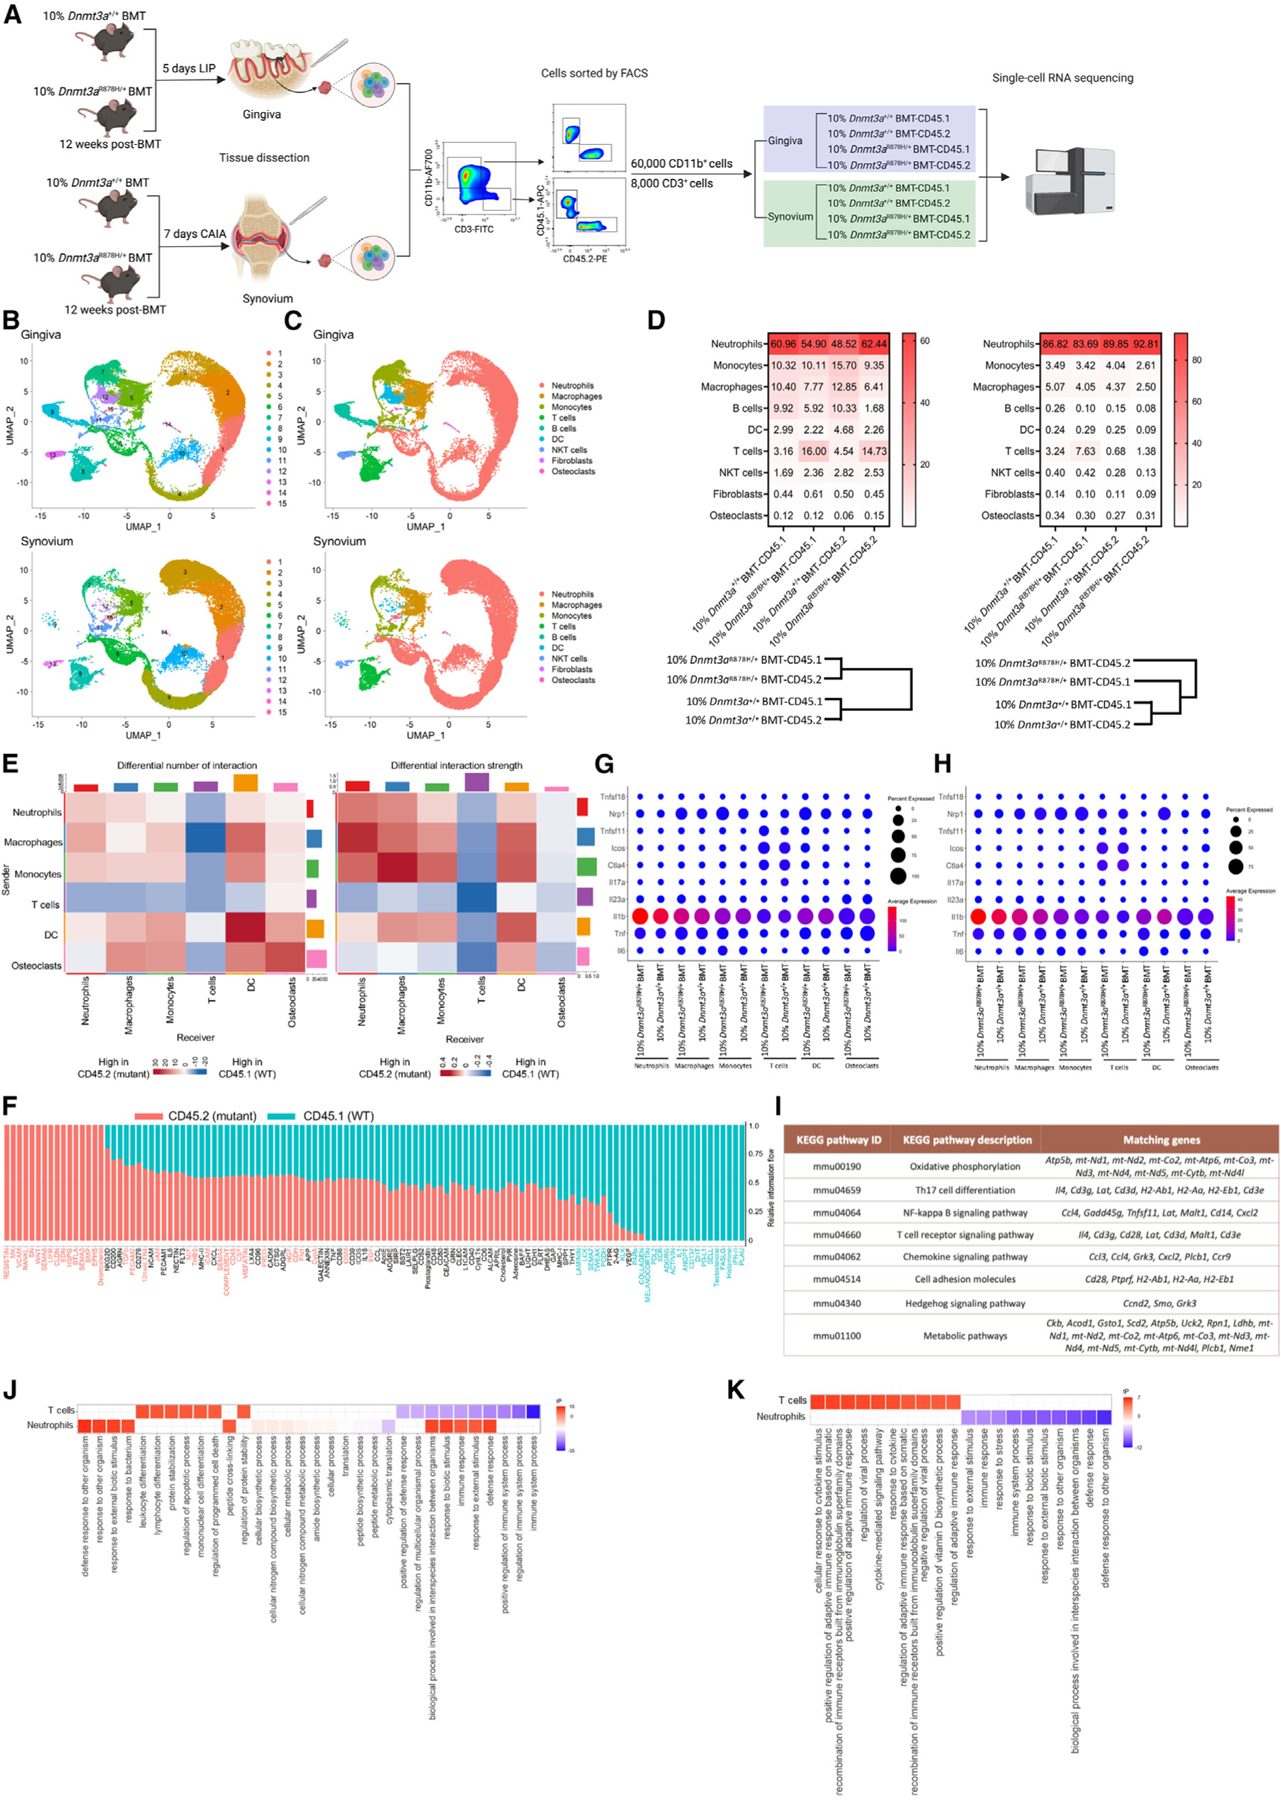
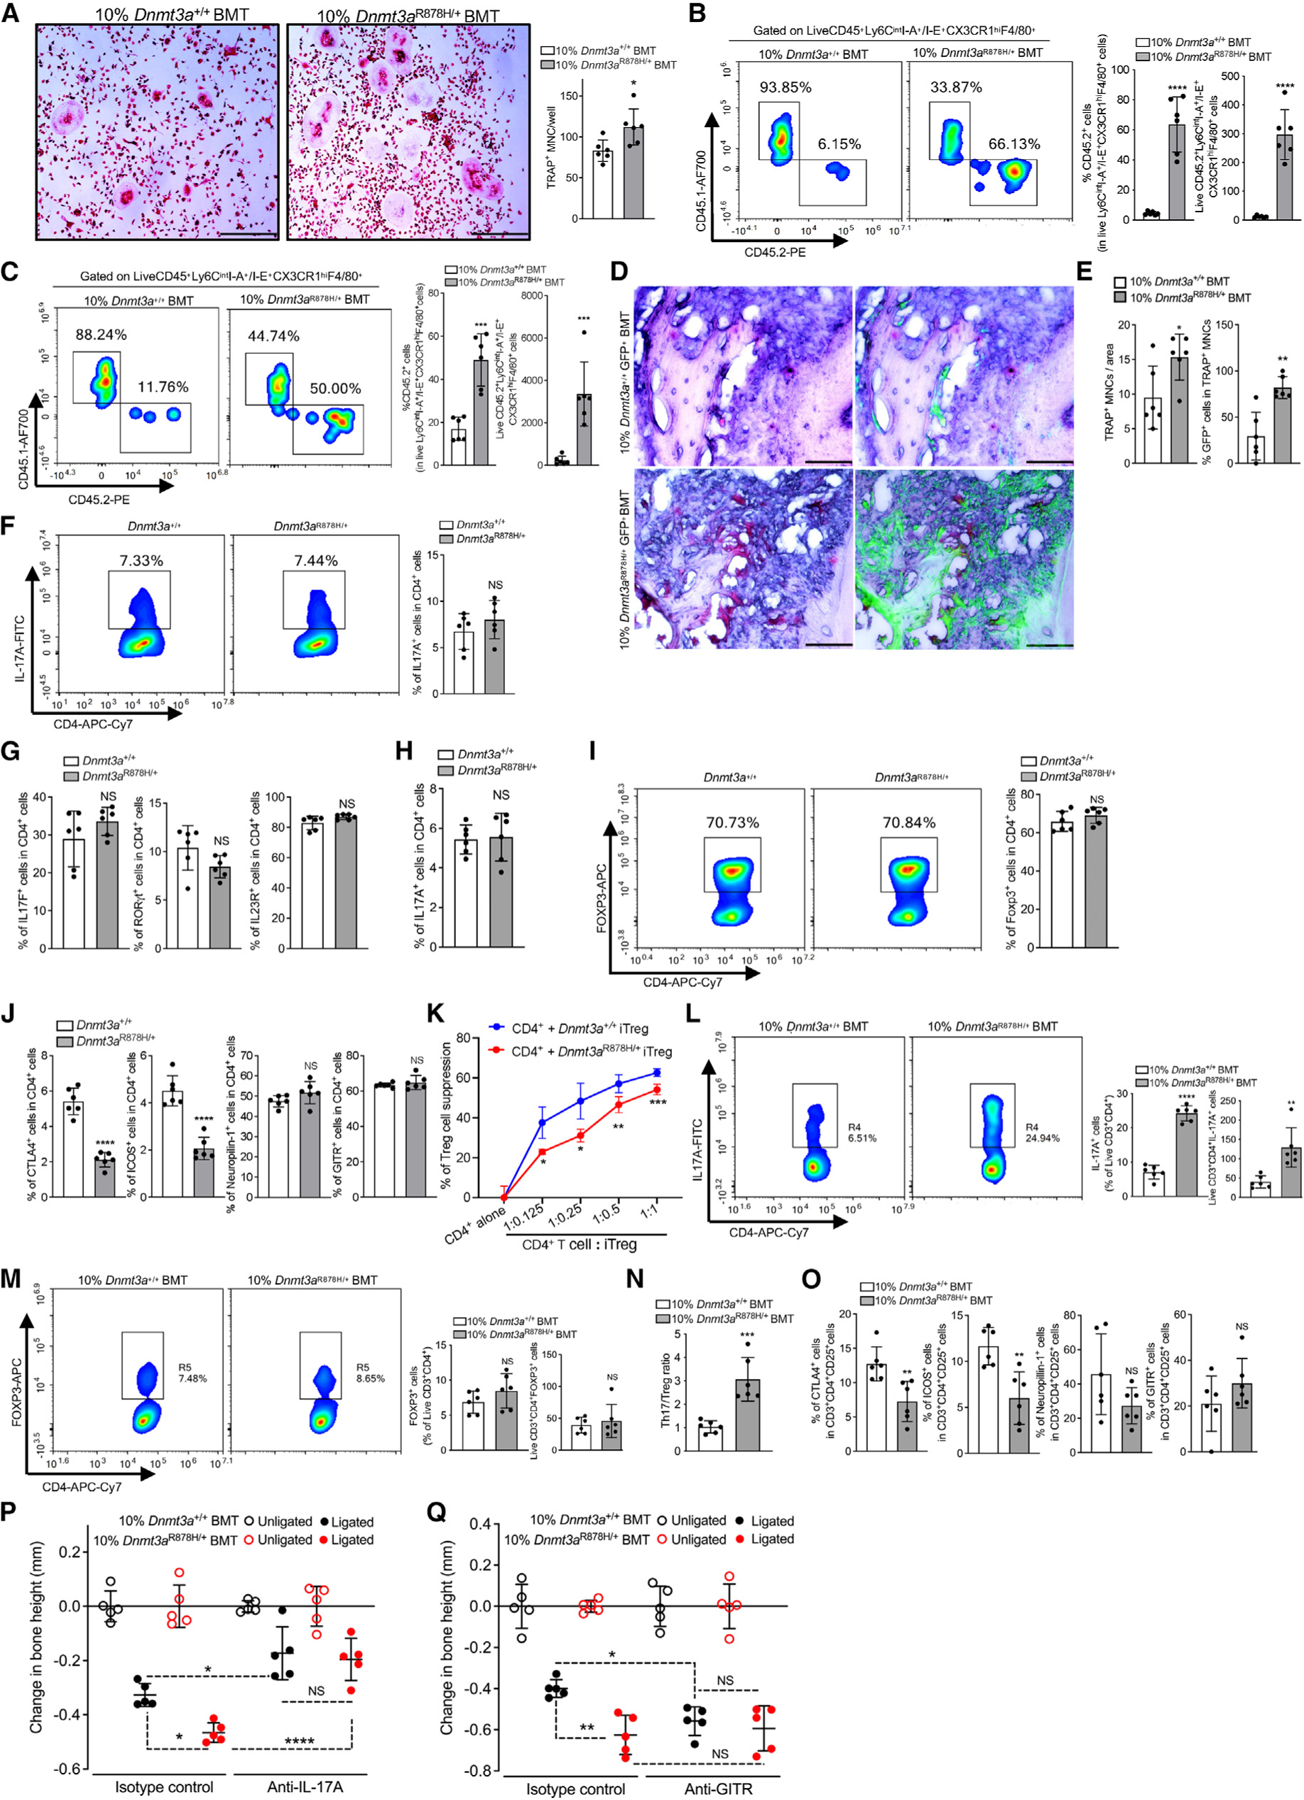
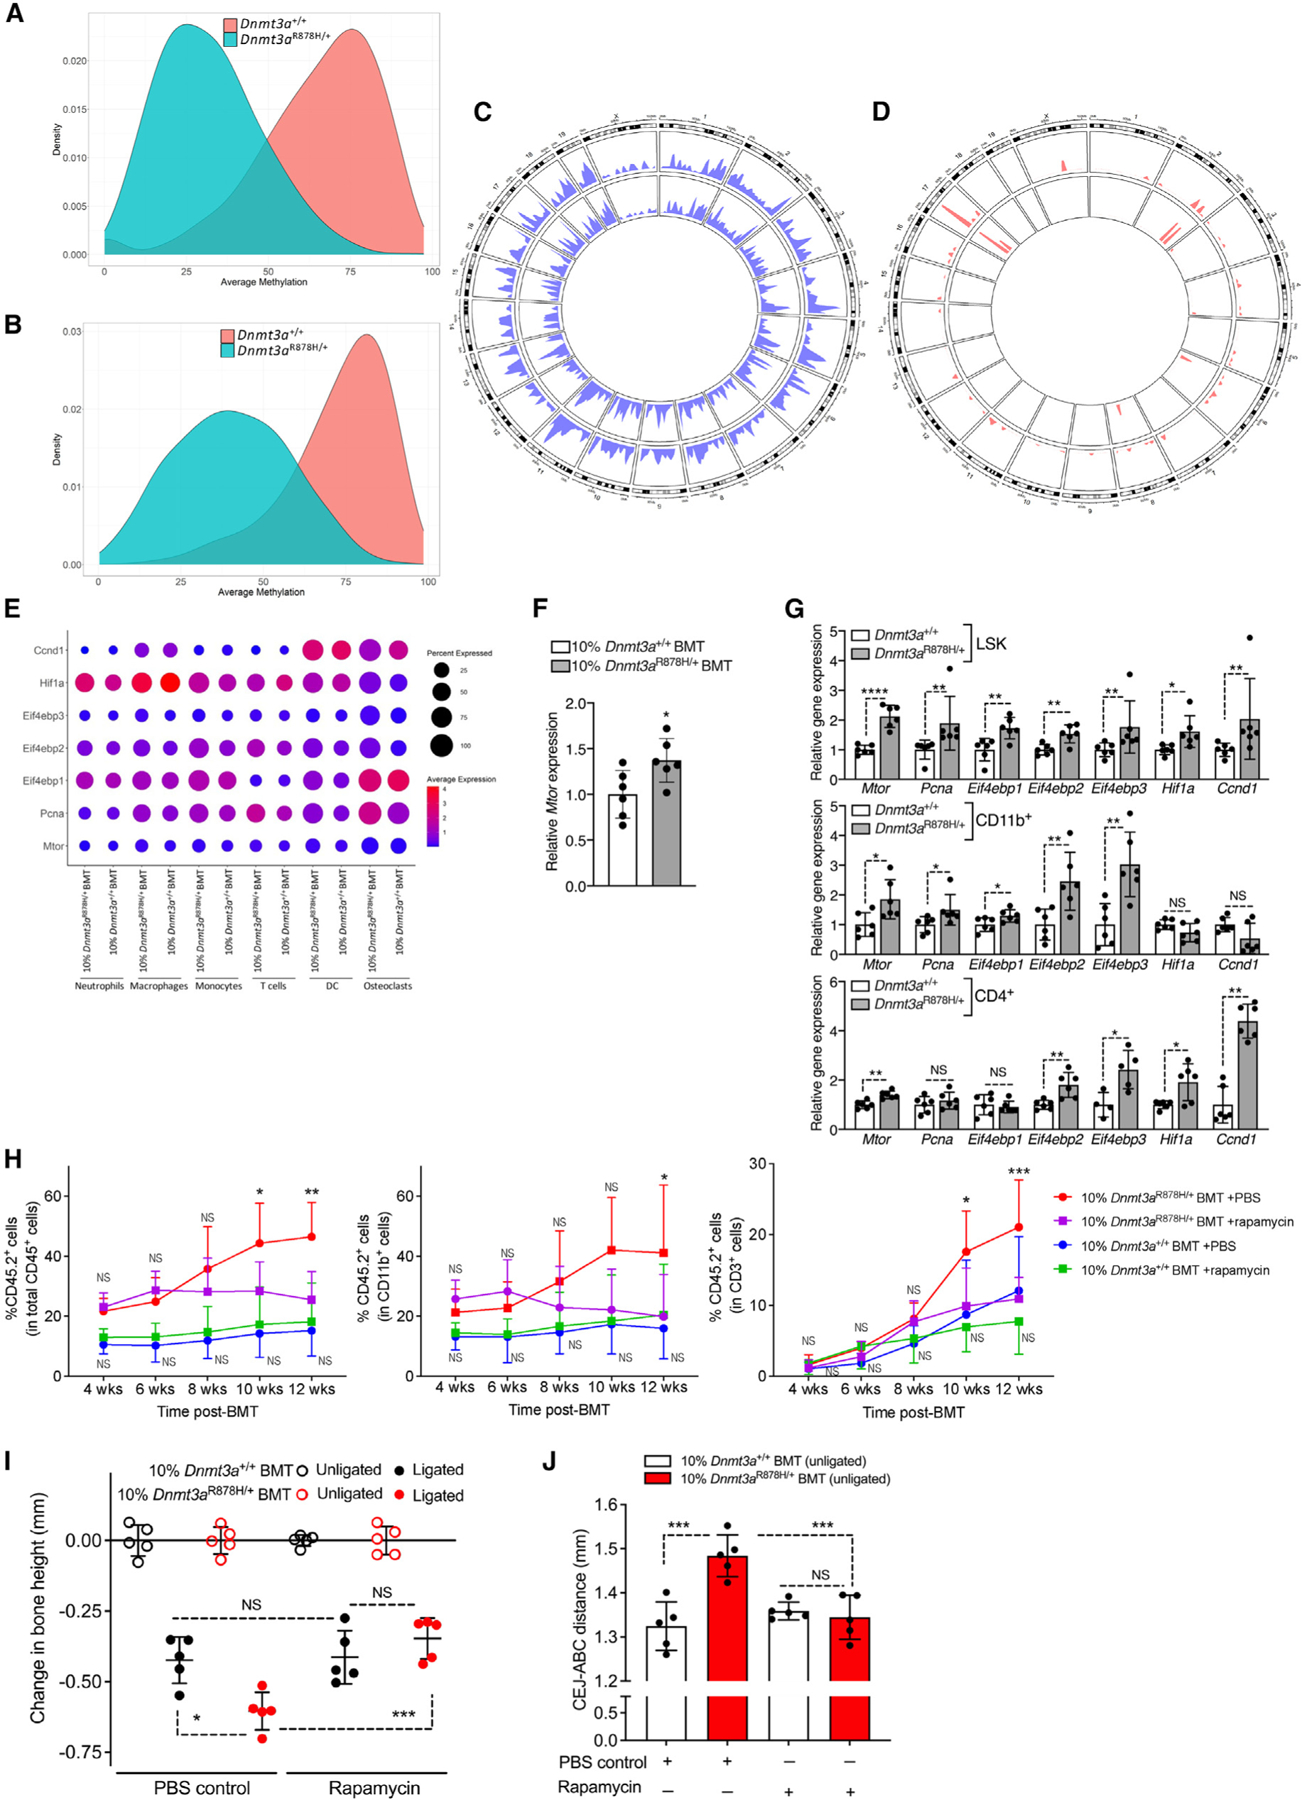
Clonal hematopoiesis of indeterminate potential (CHIP) arises from aging-associated acquired mutations in hematopoietic progenitors, which display clonal expansion and produce phenotypically altered leukocytes. We associated CHIP-DNMT3A mutations with a higher prevalence of periodontitis and gingival inflammation among 4,946 community-dwelling adults. To model DNMT3A-driven CHIP, we used mice with the heterozygous loss-of-function mutation R878H, equivalent to the human hotspot mutation R882H. Partial transplantation with Dnmt3aR878H/+ bone marrow (BM) cells resulted in clonal expansion of mutant cells into both myeloid and lymphoid lineages and an elevated abundance of osteoclast precursors in the BM and osteoclastogenic macrophages in the periphery. DNMT3A-driven clonal hematopoiesis in recipient mice promoted naturally occurring periodontitis and aggravated experimentally induced periodontitis and arthritis, associated with enhanced osteoclastogenesis, IL-17-dependent inflammation and neutrophil responses, and impaired regulatory T cell immunosuppressive activity. DNMT3A-driven clonal hematopoiesis and, subsequently, periodontitis were suppressed by rapamycin treatment. DNMT3A-driven CHIP represents a treatable state of maladaptive hematopoiesis promoting inflammatory bone loss.

Keywords: DNMT3A; T cells; arthritis; bone marrow; clonal hematopoiesis of indeterminate potential; hematopoietic stem and progenitor cells; inflammation; neutrophils; osteoclastogenesis; periodontitis.


Conflict of interest statement

Declaration of interests P.N. reports research grants from Allelica, Amgen, Apple, Boston Scientific, Genentech/Roche, and Novartis, personal fees from Allelica, Apple, AstraZeneca, Blackstone Life Sciences, Creative Education Concepts, CRISPR Therapeutics, Eli Lilly & Co, Foresite Labs, Genentech/Roche, GV, HeartFlow, Magnet Biomedicine, Merck, and Novartis, scientific advisory board membership of Esperion Therapeutics, Preciseli, and TenSixteen Bio, scientific co-founder of TenSixteen Bio, equity in MyOme, Preciseli, and TenSixteen Bio, and spousal employment at Vertex Pharmaceuticals, all unrelated to the present work. M.G.N. is an advisory board member of Cell and scientific founder of Lemba, TTxD, and Biotrip.

Figures

Figure 1.
Figure 1.. Clonal expansion of Dnmt3aR878H/+ cells after BMT promotes systemic inflammation and naturally occurring periodontitis
(A) Lethally irradiated CD45.1 mice were transplanted with 10% Dnmt3aR878H/+ CD45.2+ BM cells and 90% WT CD45.1+ BM cells (10%Dnmt3aR878H/+BMT group) or 10%Dnmt3a+/+ CD45.2+ BM cells and 90% WT CD45.1+ cells (10%Dnmt3a+/+BMT group). (B) Representative FACS plots (12 weeks post-BMT) and percentage of CD45.2+ white blood cells in peripheral blood at indicated time intervals. (C–H) All analyses were performed 12 weeks post-BMT. (C) Cytokine levels in the BM extracellular fluid (top) and serum (bottom) 12 weeks post-BMT. (D) Periodontal bone heights (CEJ-ABC distance) 12 weeks post-BMT. (E) Relative gingival mRNA expression of indicated molecules. (F–H) Representative FACS plots (left), percentage (middle), and absolute numbers (right) of CD45.2+ neutrophils (live CD11b+Ly6G+) (F), CD45.2+ monocytes (live CD11b+Ly6C+Ly6G) (G), and CD45.2+ T cells (live CD3+) (H). (I) Representative FACS plots (left), percentage (middle), and absolute numbers (right) of CD45.2+ osteoclastogenic macrophages (Ly6CintI-A+/I-E+CX3CR1hi F4/80+). Data are means ± SD (n = 5–6 mice/group). *p < 0.05, **p < 0.01, ***p < 0.001, ****p < 0.0001. NS, not significant. Two-way ANOVA with repeated measures and Sidak’s post-test (B); Student’s unpaired t test (C–I) except for (C bottom; IL-1β and IL-6), (E; Il17a and Il23a), and (I right) (Mann-Whitney U test). See also Figure S1.
Figure 2.
Figure 2.. Clonal expansion of Dnmt3aR878H/+ cells increases the severity of experimental periodontitis and impairs inflammation resolution
(A–E) BMT was performed as in Figure 1A, and after 12 weeks, recipient mice were subjected to ligature-induced periodontitis (LIP). (A) Bone loss in LIP-subjected mice. (B) Relative gingival mRNA expression of indicated molecules. (C–E) Percentage (right) and absolute numbers (left) of CD45.2+ neutrophils (CD11b+Ly6G+) (C), CD45.2+ monocytes (CD11b+Ly6C+Ly6G) (D), and CD45.2+ T cells (CD3+) (E) in the gingival tissue. (F and G) Similar experiment as in (A) and (B) except that, at 12 weeks post-BMT, recipient mice were i.p. administered anti-Ly6G (or isotype control). (F) Bone loss in LIP-subjected mice. (G) Relative gingival mRNA expression of indicated molecules. (H and I) 12 weeks post-BMT 10%Dnmt3a+/+BMT and 10%Dnmt3aR878H/+BMT mice were subjected to LIP for 10 days followed, or not, by 5 days without ligatures to enable resolution. (H) Bone gain relative to the bone heights at day 10. (I) Relative gingival mRNA expression of indicated molecules. (J and K) BMDM from Dnmt3a+/+ or Dnmt3aR878H/+ mice were allowed to efferocytose apoptotic neutrophils for 3 h. TGF-β1 protein levels in the supernatants (J) and relative mRNA expression of indicated molecules (K). Data are means ± SD (n = 5–6 mice/group). *p < 0.05, **p < 0.01, ***p < 0.001, ****p < 0.0001; NS, not significant. Student’s unpaired t test (A, C–E, J, and K) except for (C right) (Mann-Whitney U test); one-way ANOVA with Tukey’s multiple comparison test (B and F–I).
Figure 3.
Figure 3.. Clonal expansion of Dnmt3aR878H/+ cells increases the severity of inflammatory arthritis
BMT was performed as in Figure 1A, and after 12 weeks, recipient mice were subjected to CAIA. (A and B) (A) Clinical arthritis scores and (B) joint thickness at indicated time points. (C and D) (C) Representative images of H&E and (D) of safranin-O staining of tissue sections from knee joints harvested on day 7. Scale bars, 500 μm. (E–G) (E) Total cell numbers and (F) percentage (left) and numbers (right) of neutrophils (CD45+CD11b+Ly6G+) and (G) of monocytes (CD45+CD11b+Ly6C+Ly6G) in the synovium of knee joints on day 7. (H–J) (H) Percentage (left) and total counts (right) of CD45.2+ neutrophils (CD11b+Ly6G+), (I) CD45.2+ monocytes (CD11b+Ly6C+Ly6G), and (J) CD45.2+ T cells (CD3+) in the synovium. Data are means ± SD (n = 6–7 mice/group). *p < 0.05; **p < 0.01; ***p < 0.001; ****p < 0.0001; NS, not significant. Two-way ANOVA with repeated measures and Sidak’s post-test for comparison with 10%Dnmt3a+/+ BMT mice (A and B); Student’s unpaired t test (E, F, J, and G–I left); Mann-Whitney U test (G–I right).
Figure 4.
Figure 4.. Single-cell RNA sequencing analysis of gingival and synovial cells
(A) Experimental design. (B and C) Two-dimensional UMAP representation of 69,509 cells, according to (B) sample origin and results of clustering and (C) results of annotation. (D) Heatmap visualization of the distribution of sequenced cells in gingiva (top left) and synovium (top right) and cluster analysis of cell types in gingiva (bottom left) and synovium (bottom right), normalized for the number of cells per sample in the dataset. (E and F) CellChat analysis of intercellular communication networks in CD45.2+ (mutant) and CD45.1+ (WT) cells from 10%Dnmt3aR878H/+BMT mice. (E) Heatmap of differential number and strength of possible interactions between any two of the indicated analyzed cell populations in gingiva (red, increased interaction in mutant cells; blue, increased interaction in WT cells). (F) Visualization of the overall information flow of each indicated signaling pathway by calculating the sum of communication probability among all pairs of synovial cell groups in the inferred network. The red and green colors indicate increased enrichment in mutant or WT cells, respectively. (G and H) Gene expression levels in distinctly defined CD45.2+ cell types from gingiva (G) or synovium (H). (I) List of gingival upregulated enriched genes in CD45.2+ (Dnmt3aR878H/+) cells in the indicated KEGG pathway terms analyzed by STRING. (J and K) Top 10 significantly enriched GO terms sorted by PANTHER based on significantly upregulated or downregulated genes (in 10%Dnmt3aR878H/+BMT-CD45.2 vs. 10%Dnmt3a+/+BMT-CD45.2) in neutrophils and T cells from gingiva (J) and synovium (K) (Fisher test with FDR-correction, p < 0.05). See also Figures S2 and S3.
Figure 5.
Figure 5.. The R878H mutation is associated with enhanced osteoclastogenesis and impaired Treg immunosuppressive activity
(A) RANKL-induced osteoclastogenesis using BM-derived OCP (CD11b−/loLy6Chi cells) from 10%Dnmt3aR878H/+BMT and 10%Dnmt3a+/+BMT mice. Representative TRAP-stained images (left) and numbers of TRAP-positive multinucleated cells (MNCs) (right). Scale bars, 500 μm. (B and C) BMT was performed as in Figure 1A, and after 12 weeks post-BMT, recipient mice were subjected to LIP (B) or CAIA (C). Representative FACS plots (left), percentage (middle), and numbers (right) of CD45.2+ Ly6CintI-A+/I-E+CX3CR1hiF4/80+ osteoclastogenic macrophages in gingival tissue (B) or synovium (C). (D and E) Similar BMT as above using GFP-labeled donor cells. 10%Dnmt3aR878H/+GFP+BMT and 10%Dnmt3a+/+GFP+BMT mice were subjected to LIP 12 weeks post-BMT. (D) Representative TRAP-stained images without (left) and with GFP signal (right). (E) Numbers of TRAP+ MNCs per area (left) and percentages of GFP+ cells in TRAP+ MNCs (right). Scale bars, 100 μm. (F–H) Naive splenic CD4+ T cells from Dnmt3a+/+ or Dnmt3aR878H/+ mice were subjected to Th17-differentiation assay for 3 days under pathogenic (F and G) or non-pathogenic (H) conditions (see STAR Methods). (F) Representative FACS plots (left) and percentage (right) of CD4+IL-17A+ (Th17) cells. (G) Percentages of cells expressing the indicated Th17-associated markers. (H) Percentage of CD4+IL-17A+ (Th17) cells (non-pathogenic conditions). (I and J) Naive splenic CD4+ T cells from Dnmt3a+/+ or Dnmt3aR878H/+ mice were subjected to Treg-differentiation assay for 3 days. (I) Representative FACS plots (left) and percentage (right) of induced CD4+FOXP3+ (iTreg) cells. (J) Percentages of cells expressing indicated markers associated with Treg cell function. (K) Suppression of carboxyfluorescein succinimidyl ester (CFSE)-labeled CD4+CD25 T cell division by Dnmt3a+/+ iTregs or Dnmt3aR878H/+ iTregs. (L–O) BMT was performed as in Figure 1A, and after 12 weeks, gingival tissue was processed for FACS. Representative FACS plots (left), percentage (middle), and absolute numbers (right) of Th17 (live CD3+CD4+IL-17A+) cells (L) and of Treg (live CD3+CD4+FOXP3+) cells (M). Corresponding Th17/Treg ratio in the gingival tissue (N). Percentage of CD3+CD4+CD25+ T cells expressing indicated Treg-associated functional markers (O). (P and Q) BMT was performed as in Figure 1A, and after 12 weeks, recipient mice were subjected to LIP after local treatment with anti-IL-17A (or isotype control) (P) or after systemic treatment with anti-GITR (or isotype control) to deplete Tregs (Q). Bone loss was determined 5 days post-LIP. Data are means ± SD (n = 5–6 replicates (mice or cultures)/group). *p < 0.05; **p < 0.01; ***p < 0.001; ****p < 0.0001; NS, not significant. Student’s unpaired t test (A–C, E–J, and L–O) except for (G; IL-23R) (Mann-Whitney U test); two-way ANOVA with repeated measures and Sidak’s multiple comparisons test (K); one-way ANOVA with Tukey’s multiple comparisons test (P and Q). See also Figure S4.
Figure 6.
Figure 6.. Rapamycin inhibits clonal expansion of Dnmt3aR878H/+ cells and inflammatory bone loss
(A–D) Splenic CD11b+ and CD4+ cells from Dnmt3a+/+ and Dnmt3aR878H/+ mice (n = 4 mice/group) were processed for whole-genome bisulfite sequencing (WGBS). Density plot of average methylation values from WGBS of CD11b+ (A) and CD4+ (B) cells. Circos plot representation of genome-wide density of DNA hypomethylation (C) and hypermethylation (D) levels in CD11b+ and CD4+ cells. The inner track indicates the density of hypo/hyper-methylation in CD4+ cells, and the outer track indicates the density of hypo/hyper-methylation in CD11b+ cells. (E) Relative mRNA expression of Mtor and mTOR-regulated genes in the indicated CD45.2+ cell types from gingiva (data from scRNA-seq; see Figure 4). (F and G) BMT was performed as in Figure 1A, and cells were analyzed 12 weeks post-BMT. (F) Relative Mtor expression in BM cells and (G) relative mRNA expression of indicated molecules in BM LSK cells (LincKit+Sca1+), splenic CD11b+ myeloid cells, and splenic CD4+ T cells from Dnmt3a+/+ or Dnmt3aR878H/+ mice. (H–J) BMT was performed as in Figure 1A, and recipient mice were treated with rapamycin or PBS control (see STAR Methods). 12 weeks post-BMT, all groups were subjected to LIP. (H) Percentage of CD45.2+ white blood cells within total CD45+ cells (left), CD11b+ myeloid cells (middle), and CD3+ T cells (right) in the peripheral blood. (I) Bone loss in LIP-subjected mice (relative to their unligated contralateral sites). (J) Measurement of CEJ-ABC distance in unligated sites of the same mice. Data are mean ± SD (F and G: n = 6 mice/group except Eif4ebp3 in G bottom; n = 4–5 mice/group; H–J: n = 5 mice/group). *p < 0.05, **p < 0.01, ***p < 0.001, ****p < 0.0001. NS, not significant. Student’s unpaired t test (F and G) except in (G) for Pcna in LSK and CD11b+, Eif4ebp1 in CD4+, Eif4ebp3 in LSK and Ccnd1 in LSK, CD11b+, and CD4+ (Mann-Whitney U test); two-way ANOVA with repeated measures and Tukey’s multiple comparisons test (H); one-way ANOVA with Tukey’s multiple comparison test (I and J). See also Figure S5.

Similar articles

Cited by

References

    1. Jaiswal S, and Ebert BL (2019). Clonal hematopoiesis in human aging and disease. Science 366, eaan4673. 10.1126/science.aan4673. - DOI - PMC - PubMed
    1. Yura Y, Sano S, and Walsh K (2020). Clonal hematopoiesis: A new step linking inflammation to heart failure. JACC Basic Transl. Sci. 5, 196–207. 10.1016/j.jacbts.2019.08.006. - DOI - PMC - PubMed
    1. Chavakis T, Wielockx B, and Hajishengallis G (2022). Inflammatory modulation of hematopoiesis: linking trained immunity and clonal hematopoiesis with chronic disorders. Annu. Rev. Physiol. 84, 183–207. 10.1146/annurev-physiol-052521-013627. - DOI - PubMed
    1. Jaiswal S, Fontanillas P, Flannick J, Manning A, Grauman PV, Mar BG, Lindsley RC, Mermel CH, Burtt N, Chavez A, et al. (2014). Age-related clonal hematopoiesis associated with adverse outcomes. N. Engl. J. Med. 371, 2488–2498. 10.1056/NEJMoa1408617. - DOI - PMC - PubMed
    1. Genovese G, Kähler AK, Handsaker RE, Lindberg J, Rose SA, Bakhoum SF, Chambert K, Mick E, Neale BM, Fromer M, et al. (2014). Clonal hematopoiesis and blood-cancer risk inferred from blood DNA sequence. N. Engl. J. Med. 371, 2477–2487. 10.1056/NEJMoa1409405. - DOI - PMC - PubMed

MeSH terms