. 2024 Aug 7;112(15):2614-2630.e5.
doi: 10.1016/j.neuron.2024.05.009. Epub 2024 Jun 4.

Cell-class-specific electric field entrainment of neural activity

Affiliations

Cell-class-specific electric field entrainment of neural activity

Soo Yeun Lee et al. Neuron. .

Erratum in

Abstract

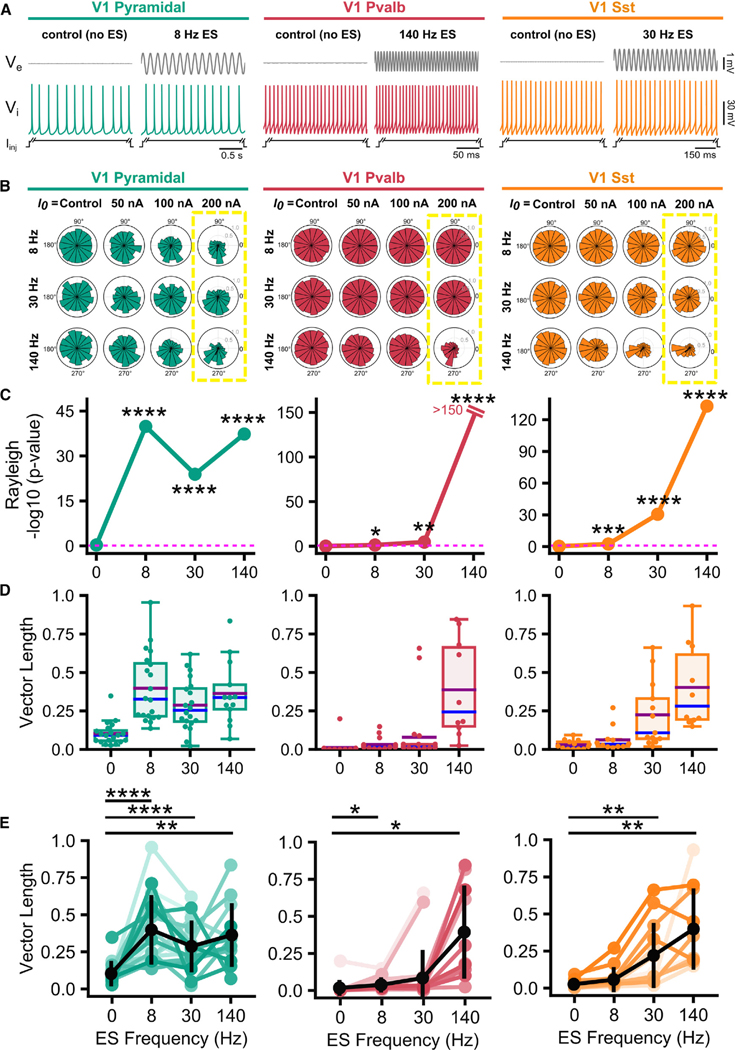
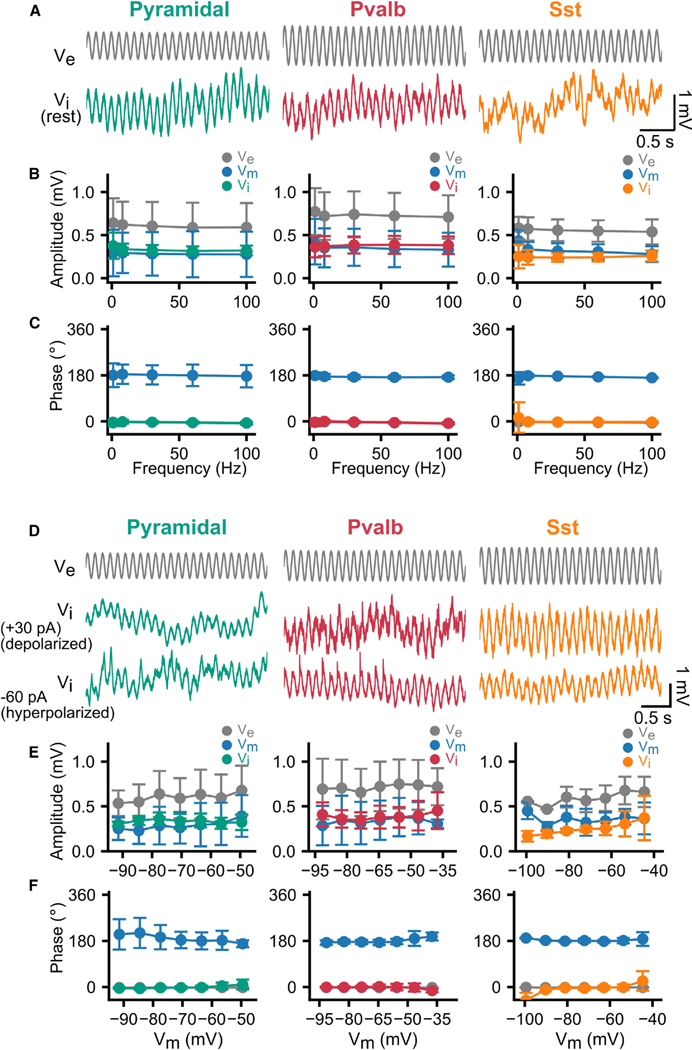
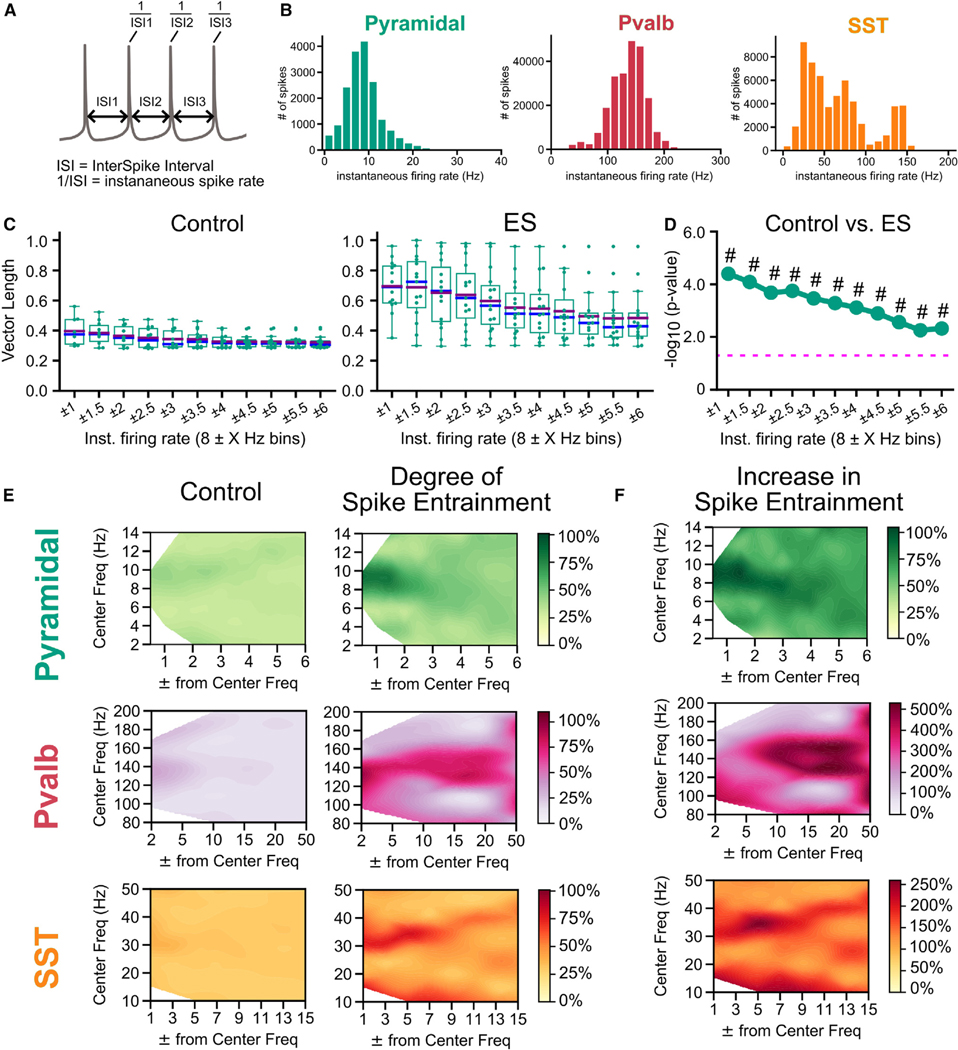
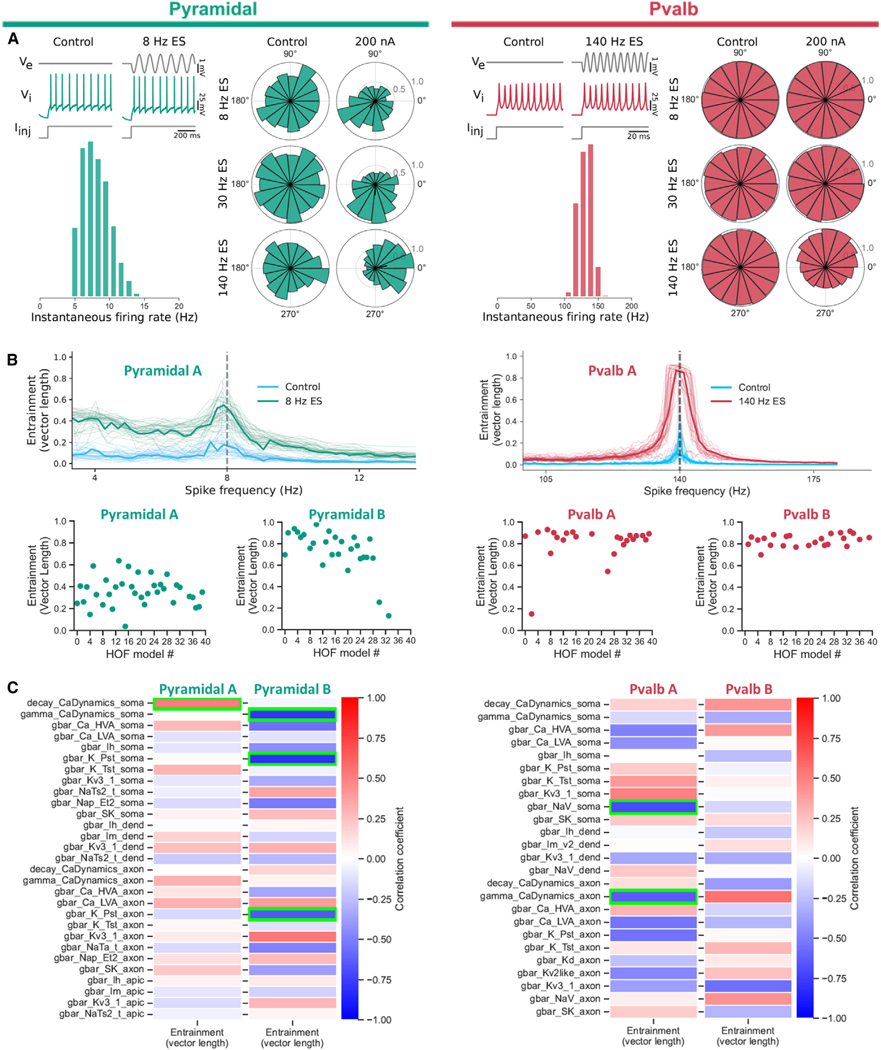
Electric fields affect the activity of neurons and brain circuits, yet how this happens at the cellular level remains enigmatic. Lack of understanding of how to stimulate the brain to promote or suppress specific activity significantly limits basic research and clinical applications. Here, we study how electric fields impact subthreshold and spiking properties of major cortical neuronal classes. We find that neurons in the rodent and human cortex exhibit strong, cell-class-dependent entrainment that depends on stimulation frequency. Excitatory pyramidal neurons, with their slower spike rate, entrain to both slow and fast electric fields, while inhibitory classes like Pvalb and Sst (with their fast spiking) predominantly phase-lock to fast fields. We show that this spike-field entrainment is the result of two effects: non-specific membrane polarization occurring across classes and class-specific excitability properties. Importantly, these properties are present across cortical areas and species. These findings allow for the design of selective and class-specific neuromodulation.

Keywords: behavior; cell types; characterization; cre-animals; electric field; entrainment; human; mouse; patch-clamp; simulation; stimulation.


Conflict of interest statement

Declaration of interests S.Y.L. has previously consulted for Starfish Neuroscience, Inc. C.A.A. and S.Y.L. are listed as inventors on a patent application related to this work. C.K. is a board member of and has a financial interest in Intrinsic Powers, Inc.

Figures

Figure 1.
Figure 1.. Cellular and cell-class-specific characterization of ES effects
(A) Top: simultaneous ES, Vi, and Ve recordings from multiple electrodes near the recorded cell. Bottom: experiment in mouse cortical slice (yellow, extracellular ES electrode; green, patched soma; blue, intracellular electrode; red, extracellular electrodes recording Ve). (B) Ve amplitude as function of distance between ES and recording electrodes (ES: 25–200 nA at 8 Hz; circles: Ve mean amplitude; error bars: SD) Trendlines: least-squares fit of the point-source approximation. (C) Ve and electric field amplitude elicited by ES at the extracellular electrode closest to the recorded soma (~15 μm). Blue, Ve amplitude for each experiment (n = 59); black, mean and SD. (D) Sample fluorescent images, cellular morphology, electrophysiology, and spike frequency vs. current input (f-I) curves from identified mouse neocortical cell classes (colored lines, individual neurons; black, median). (E) Experiments in pyramidal, Pvalb, and Sst neurons during simultaneous ES (200 nA at 8, 30, and 140 Hz) and intracellular DC current injection Iinj to elicit spiking. Top, Ve closest to the soma; bottom, Vi of a spiking neuron responding to Iinj (5 s shown). (F) Introduction of spike time analysis and quantification of spike-field entrainment. (G) Top: polar plots of spike-phase distributions for a pyramidal, Pvalb, and Sst cell in the absence (control) and presence of ES (200 nA; 8, 140, and 30 Hz ES for pyramidal, Pvalb, and Sst cells, respectively). The population vector length (black line) and skewed spike-phase distribution reflects the degree of entrainment. Number of spikes (control, ES): Pyr (52, 56), Pvalb (702, 864), and Sst (216, 218).
Figure 2.
Figure 2.. Cell-class-specific entrainment of spiking to ES
(A) Example Vi and Ve traces, with spiking induced by intracellular current injection Iinj during control (no ES) or sinusoidal ES application. (B) Spike-phase distribution for V1 cell classes for varying ES parameters. Rows, ES frequency (top to bottom); columns, ES amplitude (left to right). Control experiments show a homogeneous spike-phase distribution, i.e., no inherently preferred spike phase, while increasing ES amplitude skews the spike-phase distribution, showing increasing spike-phase entrainment. Different ES frequencies exhibit a distinct, cell-class-specific effect on the spike-phase entrainment. (C–E) Summary statistics for the highest ES amplitude (200 nA) in (B) (yellow boxes). (C) Spike entrainment to ES assessed by Rayleigh’s test, with p values plotted as a function of ES frequency. Dashed pink line: p = 0.05. Pyramidal spiking shows statistically significant spike phase entrainment to slow (8 Hz), medium (30 Hz), and fast (140 Hz) ES frequencies, while Pvalb and Sst are most strongly entrained by high ES frequencies (140 Hz) (*p < 0.05, **p < 0.01, ***p < 0.001, ****p < 0.0001, Table S2). (D) The population vector length plotted for each cell (circles) within each class. Purple and blue lines: mean and median values, respectively; whiskers: remaining distribution. (E) The population vector length for each cell (from D) across each ES frequency compared against control conditions to assess degree of entrainment (paired t test, false discovery rate [FDR]-corrected for multiple comparisons: *p < 0.05, **p < 0.01, ****p < 0.0001). Pyramidal: n = 21 cells (8 and 30 Hz), n = 13 (140 Hz); Pvalb: n = 22 (8 and 30 Hz), n = 12 (140 Hz); Sst: n = 13 for (8 and 30 Hz), n = 10 (140 Hz).
Figure 3.
Figure 3.. Non-specific, ES-frequency-independent subthreshold entrainment of all cell classes to ES
(A) Entrainment of Vi to ES for cells at rest. Gray traces, Ve at the closest extracellular location (15 μm) from the soma. Subthreshold ES (8 Hz and 100 nA) is delivered 50 μm from soma. (B and C) ES effect on neurons at rest (ES: 100 nA, 1–100 Hz). Amplitude (B) and phase (C) of the ES-induced Ve (gray), Vi (green, red, or orange), and Vm (blue) for each cortical cell class (circles: mean; error bars: SD). All cell classes exhibit ES frequency independence with induced Vi, Ve, and Vm amplitude and phase remaining constant for ES frequencies ranging from 1 to 100 Hz (one-way ANOVA, p > 0.05 for Pyr, Pvalb, and Sst). (D) ES effect on hyper- and depolarized neurons held at a range of membrane potentials via intracellular Iinj during simultaneous sinusoidal ES (8 Hz and 100 nA). (E and F) Amplitude (E) and phase (F) of the ES-induced Ve (gray), Vi (green, red, or orange), and Vm (blue) for each cortical class for hyper- and depolarized potentials (circles, mean; error bars, SD). n = 24, pyramidal; n = 22, Pvalb; n = 13, Sst cells.
Figure 4.
Figure 4.. Cell-class-specific ES entrainment of spiking correlates with spike-rate properties of the individual classes
(A) Instantaneous spike rate for each spike, calculated as the inverse of the interspike interval (ISI, time between a spike and the next consecutive spike). (B) Histogram of instantaneous spike rate distributions for all spikes recorded in each class. (Pyramidal: n = 21; Pvalb: n = 22; Sst: n = 13 cells). (C) Degree of spike entrainment (as evaluated by population vector length) to ES (8 Hz and 200 nA) for each recorded cell’s spikes in the pyramidal class containing only spikes within a specific spike-rate range/bin (vector length means bootstrapped for 10,000 trials). Bin size (boundaries) are designated by the spike rate to be analyzed (a “center” frequency) within a frequency-window range (ranging from ±1 to ±6 Hz). Tighter spike-frequency ranges are on the left, with the range widening toward the right. Boxplots, quartiles; purple and blue lines, mean and median values; whiskers, remaining distribution. (D) Plot of −log10 p values (Welch’s t test) for comparison between the same-spike-range bins (e.g., 8 ± 1 Hz control vs. 8 ± 1 Hz ES bins) between control and ES in (C). Dashed pink line: p = 0.05; #: effect size (Cohen’s d) where d > 0.8. (E) Degree of spike entrainment (expressed as % of the normalized vector length, 0–1) to control (left) or ES for spikes within specific spike-rate bins for the three classes. Results shown for ES (200 nA) at 8 Hz (Pyr), 140 Hz (Pvalb), and 30 Hz (Sst). (F) Percentual increase in spike entrainment (vector length) in ES vs. control for Pyr, Pvalb, and Sst. Pyramidal: n = 21 for ES frequencies 8 and 30 Hz and n = 13 for 140 Hz; Pvalb: n = 22 for 8 and 30 Hz and n = 12 for 140 Hz; Sst: n = 13 for 8 and 30 Hz and n = 10 for 140 Hz.
Figure 5.
Figure 5.. Computational modeling of mouse V1 neurons suggests spike-rate differences rather than individual conductances as the major contributor to class-specific spike-field coupling
(a) (Top left) A bio-realistic model of a pyramidal neuron (cell ID: 488698341) is used to emulate the experimental setup accounting for the sinusoidal ES. Intracellular DC current is combined with weak sinusoidal ES of various frequencies (8, 30, and 140 Hz) such that the spike rate remains unperturbed by the ES. (Bottom left) Model ISI distribution (control). (Right) Spike-phase relationship for the simulations (ES at 200 pA, top to bottom: 8, 30, and 140 Hz ES). Weak ES gives rise to strong spike-phase coupling in the presence, but not absence, of ES. (Top right) Same setup as for (A) but using a bio-realistic inhibitory Pvalb model (cell ID: 569998790; see also Figure S5). The Pvalb model shows preferential entrainment to fast ES, while the pyramidal model readily entrains to both slow and fast ES (Figure S6). (B) Top: hall of fame (hof) models of the pyramidal (left) and Pvalb (right) cell from (A) exhibit the robustness of the spike-field coupling (40 hof models per cell; Figure S5). Identical setup like in (A) for each hof model (spike-field entrainment, population vector length; thin lines, vector length for each hof model; thick line, mean vector length across hof models; cyan, control, no ES). With Pvalb spiking faster than pyramidal models (spike rate distributions in A), ES strongly entrains all hof models when ES frequency matches the spike rate. Bottom: spike-phase entrainment at the preferred ES frequency (pyramidal: 8 Hz; Pvalb: 140 Hz) across hof models for two pyramidal (pyramidal A: 488698341; pyramidal B: 354190013) and two Pvalb cells (Pvalb A: 569998790; Pvalb B: 471077857). (C) Correlation between model conductances and spike-phase entrainment at the preferred ES frequency (for pyramidal neurons: 8 Hz; Pearson correlation across hof models; 40 hof models per cell; B, bottom row). Green boxes, statistically significant correlations (p < 0.0017 for pyramidal and p < 0.002 for Pvalb models).
Figure 6.
Figure 6.. Subthreshold and spiking ES entrainment of human neurons
(A) Top (left): human cortical slice obtained via neurosurgical resections. (Right) Electrophysiology trace of a human pyramidal neuron during intracellular current injections. Bottom (left): human slice with electrodes applying ES, recording a neuron (white), and Ve at multiple locations. (Middle) Human pyramidal cell morphology. (Right) f-I curves of recorded cells. (B) Left: Ve amplitude as function of distance between ES (25–200 nA and 8 Hz) and recording electrodes (circles: Ve mean amplitude; error bars: SD). Trendlines: least-squares fit of point-source approximation. (C) ES-induced Ve and electric field amplitude at the extracellular electrode closest to the soma (~15 μm). Blue, Ve amplitude for each experiment (n = 5); black, mean and SD. (D) Sample trace of a human pyramidal neuron showing entrainment of Vi (green) to subthreshold ES (8 Hz and 100 nA) delivered 50 μm from soma, Ve (gray) measured closest (15 μm) to the soma. (E) Example Vi and Ve traces with spiking induced by intracellular DC stimulus Iinj during control (no ES) and sinusoidal ES. (F) Spike rate distribution for all spikes recorded from human neurons (n = 4). (G) Subthreshold ES effect (top) at rest and (bottom) at hyper- and depolarized potentials via intracellular current injection Iinj (−90 to 90 pA; ES: 100 nA at 1–100 Hz). Ve (gray), Vi (green), and Vm (blue outlined circle) amplitude (left) and phase (right) are shown (circles mean; error bars, SD). (H) Spike-phase distribution for varying ES parameters. Rows, ES frequency; columns, ES amplitude. (I–K) Summary statistics for ES amplitude = 200 nA (yellow box in H). (I) Spike-phase entrainment of human neurons to ES assessed via Rayleigh’s test (****p < 0.01; dashed pink line: p = 0.05). (J) The population vector length for each cell. Purple and blue lines: mean and median values; whiskers: remaining distribution. (K) The population vector length for each cell (from J, each line represents a cell) across ES frequencies (paired t test, false discovery rate [FDR]-corrected for multiple comparisons: *p < 0.05, Table S4). (L) Spike entrainment (vector length) in control (no ES, left) and ES (8 Hz at 200 nA) experiments (right) for each recorded cell, containing only spikes within a specific spike-rate range/bin. Bootstrapped means for each cell (bootstrapping across 10,000 trials). Bin size (boundaries) are designated by the spike rate (a center frequency) within a frequency-window range (from ±1 to ±3 Hz). (M) The spike-phase entrainment quantified via −log10 p values (Welch’s t test) for comparison between the same-spike-range bins (e.g., 8 ± 1 Hz control vs. 8 ± 1 Hz ES bins) between control vs. ES in (K). Dashed pink line: p = 0.05; #: effect size (Cohen’s d) where d > 0.8.

Update of

References

    1. Hitzig E. (1874). Untersuchungen über das Gehirn: Abhandlungen physiologischen und pathologischen Inhalts (A. Hirschwald; ).
    1. Fritsch G. (1870). Uber die elektrische Erregbarkeit des Grosshirns. Arch. Anat. Physiol. Wiss. Med 37, 300–332.
    1. Dumitrascu OM, Kamiński J, Rutishauser U, and Tagliati M. (2016). Subthalamic Nuclei Deep Brain Stimulation Improves Color Vision in Patients with Parkinson’s Disease. Brain Stimul. 9, 948–949. 10.1016/j.brs.2016.08.006. - DOI - PubMed
    1. Vitek JL, Jain R, Chen L, Tröster AI, Schrock LE, House PA, Giroux ML, Hebb AO, Farris SM, Whiting DM, et al. (2020). Subthalamic nucleus deep brain stimulation with a multiple independent constant current-controlled device in Parkinson’s disease (INTREPID): a multicentre, double-blind, randomised, sham-controlled study. Lancet Neurol. 19, 491–501. 10.1016/S1474-4422(20)30108-3. - DOI - PubMed
    1. Freund HJ, Kuhn J, Lenartz D, Mai JK, Schnell T, Klosterkoetter J, and Sturm V. (2009). COgnitive functions in a patient with parkinson-dementia syndrome undergoing deep brain stimulation. Arch. Neurol 66, 781–785. 10.1001/archneurol.2009.102. - DOI - PubMed

LinkOut - more resources