Review
. 2024 Dec 30;45(12):121001.
doi: 10.1088/1361-6579/ad548e.

Developing technologies to assess vascular ageing: a roadmap from VascAgeNet

Affiliations
Review

Developing technologies to assess vascular ageing: a roadmap from VascAgeNet

Serena Zanelli et al. Physiol Meas. .

Abstract

Vascular ageing (vascular ageing) is the deterioration of arterial structure and function which occurs naturally with age, and which can be accelerated with disease. Measurements of vascular ageing are emerging as markers of cardiovascular risk, with potential applications in disease diagnosis and prognosis, and for guiding treatments. However, vascular ageing is not yet routinely assessed in clinical practice. A key step towards this is the development of technologies to assess vascular ageing. In this Roadmap, experts discuss several aspects of this process, including: measurement technologies; the development pipeline; clinical applications; and future research directions. The Roadmap summarises the state of the art, outlines the major challenges to overcome, and identifies potential future research directions to address these challenges.

Keywords: ageing; arterial stiffness; blood pressure; cardiovascular; commercialisation; prevention; pulse wave velocity.


Conflict of interest statement

S Zanelli collaborates with Axelife, a company that designs and develops devices for assessing vascular ageing.

S Zanelli collaborates with Axelife, a company that designs and develops devices for assessing vascular ageing. P Charlton has performed consultancy work for companies developing PPG sensors.

Figures

Figure 1.
Figure 1.
The four areas of the Roadmap. Source: Reproduced from Servier Medical Art. CC BY 4.0.
Figure 2.
Figure 2.
(a) Standard longitudinal B-mode US image of a common carotid artery processed by software based on a contour tracking algorithm measuring diameter and intima media thickness (IMT). (b) Measurements of instantaneous diameter. (c) Applanation tonometry for carotid blood pressure estimation, calibrated through brachial pressure assessment, that, combined with the US derived analysis, provides elastic parameters.
Figure 3.
Figure 3.
Main limitations and possible solutions to meet challenges related to the application of US techniques in clinical practice for vascular ageing assessment.
Figure 4.
Figure 4.
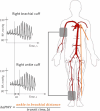
Two-site oscillometric arterial stiffness assessment by calculating the brachial–ankle pulse wave velocity (baPWV) through the measurement of the transit time between the brachial artery and tibial artery through the oscillometric amplitude. Definitions: BP—blood pressure; baPWV—brachial–ankle pulse wave velocity.
Figure 5.
Figure 5.
Single-site oscillometric arterial stiffness assessment method by the combination of cuff oscillometry, pulse wave analysis and validated algorithms including covariates such as age and systolic blood pressure. Definitions: oPWA—oscillometric pulse wave analysis; oPWV—oscillometric pulse wave velocity; SBP—brachial systolic blood pressure.
Figure 6.
Figure 6.
Applanation tonometry. Left panel: transcutaneous arterial tonometry in radial artery. Right panel: applanation tonometry principle: a circular structure with a given pressure inside (artery) is flattened; in this way circumferential pressures are equalized and the sensor records the intra-arterial pressure (P). Tensile forces (T) are perpendicular to pressure vectors. Lower panel: raw recording of a radial applanation tonometry sampled at 1 kHz.
Figure 7.
Figure 7.
Assessing vascular ageing from contact photoplethysmography. Definitions: PPG—photoplethysmography; PTT—pulse transit time; PAT—pulse arrival time; ECG—electrocardiogram. Adapted from Charlton et al (2022b). CC BY 4.0. Adapted from Charlton et al (2018). © 2018 Institute of Physics and Engineering in Medicine. CC BY 3.0. Adapted from Charlton et al (2022a). CC BY 4.0.
Figure 8.
Figure 8.
Imaging photoplethysmography (iPPG) waveform extraction and analysis: facial images are captured by a colour camera. Then the forehead is selected as region of interest (ROI). The raw iPPG signal is extracted from the ROI using spatial averaging. Before extracting the waveform, the signal is smoothed and filtered. Three waveform features can be computed: (a) temporal, (b) areas and (c) derivatives and amplitude features. These features are related to heart rate, blood pressure, vascular ageing and arterial stiffness. Adapted from Djeldjli et al (2021), Copyright (2021), with permission from Elsevier.
Figure 9.
Figure 9.
Some circulating biomarkers with the highest potential for early detection and diagnosis of cardiovascular disease and vascular ageing. Adapted from Gopcevic et al (2021). CC BY 4.0.
Figure 10.
Figure 10.
The chronological age, the vascular age calculated based on the Systematic COronary Risk Evaluation (Vasc Age SCORE) and the vascular age calculated based on Framingham risk score (Vasc Age FRS) of the study population. Data are presented as median (minimal and maximal values in error bars). *p < 0.05 compared with Chronological Age; #p < 0.05 compared with Vasc Age SCORE. Adapted from Gyöngyösi et al (2021). CC BY 4.0.
Figure 11.
Figure 11.
(Left) Current challenges using in vivo human data to develop technologies to assess vascular ageing from pulse wave (PW) signals. (Right) Advantages offered by synthetic data to overcome these challenges. * Other properties may change concurrently. ** Individual properties can be altered independently of each other.
Figure 12.
Figure 12.
Examples of synthetic PW signals. (a) Arterial network used to simulate the signals. (b) The PPG at the finger changes with ageing, allowing the study of PPG-derived vascular ageing indices. (c) Central and peripheral blood pressure (BP) waves for evaluating the estimation of the former from the latter, across different age groups. Adapted from Charlton et al (2019). CC BY 4.0. (d) Cardiac cycle-averaged diameter (D) and flow velocity (U) during flow-mediated dilation (FMD). Adapted from Jin et al (2020). CC BY 4.0.
Figure 13.
Figure 13.
Novel technology evaluation methods’ characteristics with associated TRL.
Figure 14.
Figure 14.
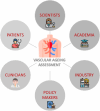
Key actors involved in the development, maintenance and use process of a vascular ageing medical device. Icons’ source: www.flaticon.com. Reproduced with permission from Flaticon.
Figure 15.
Figure 15.
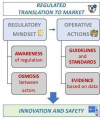
Main regulatory challenges and potential steps that can be supported by the scientific community for improving the process of translation from research to practice in the vascular ageing field. Icons’ source: www.flaticon.com. Reproduced with permission from Flaticon.
Figure 16.
Figure 16.
Gartner Hype Cycle (Gartner 2023). GARTNER is a registered trademark of Gartner, Inc. and/or its affiliates and is used herein with permission. All rights reserved. Reproduced with permission from Gartner (2023).
Figure 17.
Figure 17.
Medical technology development pathway with an illustrative example of ARTSENS® device—an academic-driven vascular ageing and fitness assessment technology. Reproduced with permission from Artsens.
Figure 18.
Figure 18.
Methods to phenotype the smallest blood vessels in the retina and brain. Retinal microvasculature may be a good proxy for cerebral microvasculature.
Figure 19.
Figure 19.
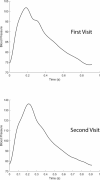
Changes in aortic waveforms in a patient with heart failure with reduced ejection fraction, from treatment initiation to the 6 month visit. Within this time period, ejection duration increased from 0.252 to 0.288 s, Augmentation Index increased from 26.1 to 35.1, and S to D ratio increased from 1.457 to 1.761.
Figure 20.
Figure 20.
PPG has potential as an accessible, low-cost and fast method of PAD detection. The toe PPG trace for the leg with PAD is clearly damped and delayed compared to the leg that has normal arteries.
Figure 21.
Figure 21.
Example of a prototype PAD assessment device development offering a low-cost and easy-to-do PAD test for primary care and which is based on the optical pulse technique of photoplethysmography (PPG). The multi-site PPG system concept, PPG probes and main processing unit are shown (Stansby et al 2022). There is great scope for the miniaturisation of such technology. Reproduced with permission from Stansby et al (2022). Copyright © 2022 by SAGE Publications.
Figure 22.
Figure 22.
Schematic representation of an ‘ideal’ device allowing simultaneous and integrated measurement of blood pressure, vascular ageing and AF screening, and potential areas of application into devices currently used for clinical (left) or out-of-office (right) evaluation based on the analysis of biological signals recorded during activities of daily living.
Figure 23.
Figure 23.
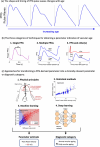
Using machine learning to assess vascular ageing from readily available clinical data. Adapted from Bikia et al (2021a). CC BY 4.0.
Figure 24.
Figure 24.
Factors contributing to vascular ageing in women and men separately.
Figure 25.
Figure 25.
The sex-specific cardiovascular phenotype of ageing in women and men.
Figure 26.
Figure 26.
Parameters describing a pressure waveform, based on characteristic points on the pressure wave (upper curve). From left to right: start of upstroke and diastolic pressure, (Pdia), maximal rate of change (max-dP/dt), shoulder point (Psho), inflection point (Pinf), systolic pressure (Psys), incisura (Pinc), dicrotic wave (Pdic). The augmentation index AIx = [(Psys − Psho)/(Psys − Pdia)] · 100%. Wave separation provides the forward and reflected pressure waves (lower curves).

References

    1. Ahola A J, Gordin D, Forsblom C, Groop P-H. Association between diet and measures of arterial stiffness in type 1 diabetes—focus on dietary patterns and macronutrient substitutions. Nutr. Metab. Cardiovasc. Dis. 2018;28:1166–72. doi: 10.1016/j.numecd.2018.07.003. - DOI - PubMed
    1. Ainsworth S, Rhodes N. Calculation of Hill slopes predicted by the four ligand exponential model for a regulatory enzyme. Int. J. Biomed. Comput. 1986;19:279–88. doi: 10.1016/0020-7101(86)90070-x. - DOI - PubMed
    1. Alastruey J, et al. Arterial pulse wave modelling and analysis for vascular age studies: a review from VascAgeNet. Am. J. Physiol. Heart Circ. Physiol. 2023;325:H1–H29. doi: 10.1152/ajpheart.00705.2022. - DOI - PMC - PubMed
    1. Al-Halawani R, Charlton P H, Qassem M, Kyriacou P A. A review of the effect of skin pigmentation on pulse oximeter accuracy. Physiol. Meas. 2023;44:05TR01. doi: 10.1088/1361-6579/acd51a. - DOI - PMC - PubMed
    1. Allen J. Photoplethysmography and its application in clinical physiological measurement. Physiol. Meas. 2007;28:R1–39. doi: 10.1088/0967-3334/28/3/R01. - DOI - PubMed

LinkOut - more resources