. 2024 Jun 5;7(8):e202402671.
doi: 10.26508/lsa.202402671. Print 2024 Aug.

Off-targets of BRAF inhibitors disrupt endothelial signaling and vascular barrier function

Affiliations

Off-targets of BRAF inhibitors disrupt endothelial signaling and vascular barrier function

Sophie Bromberger et al. Life Sci Alliance. .

Abstract

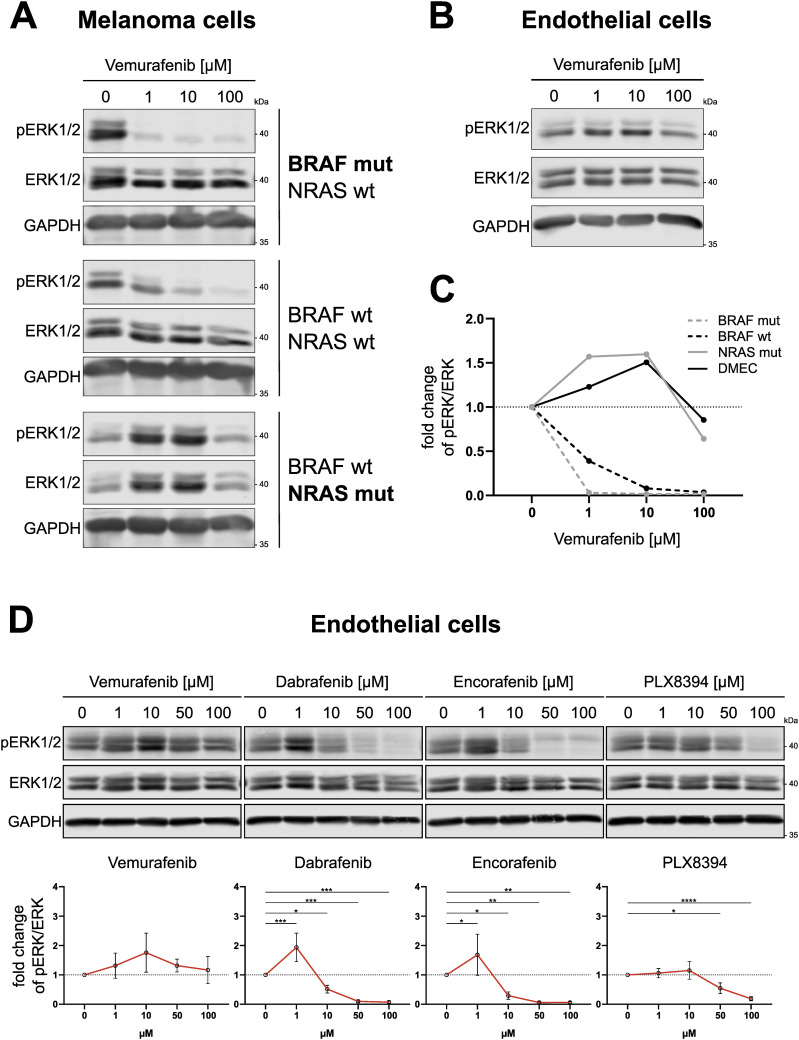
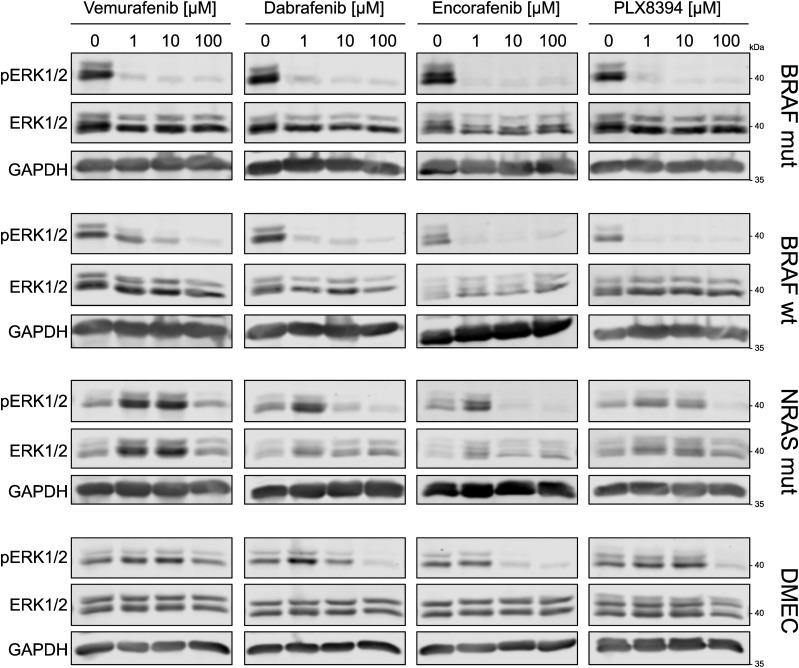
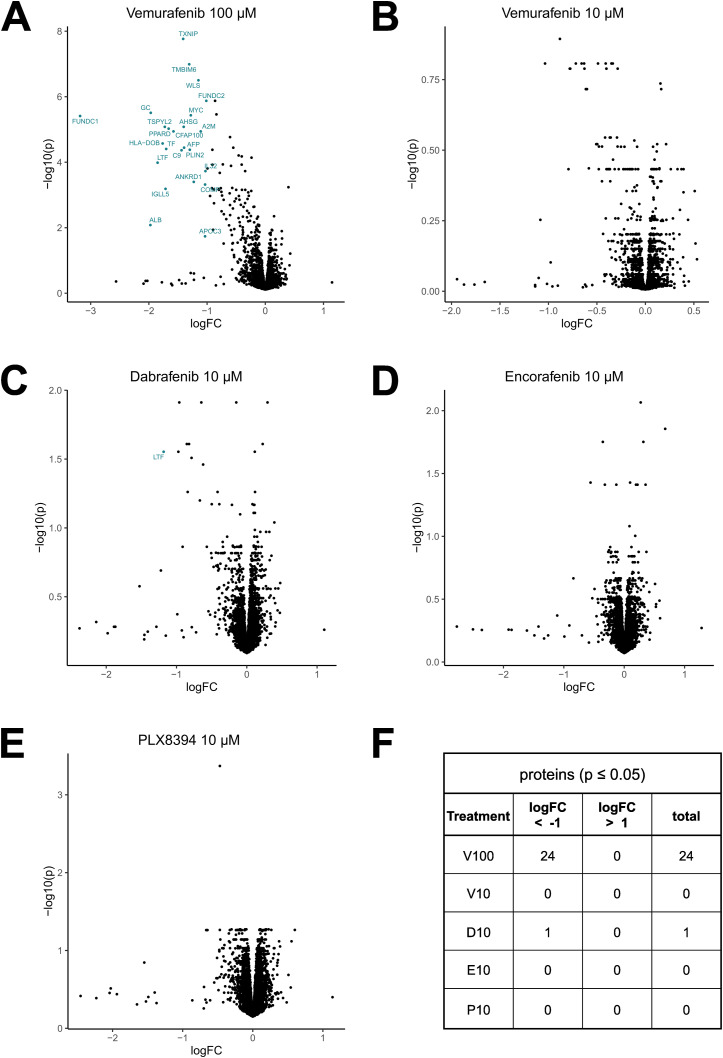
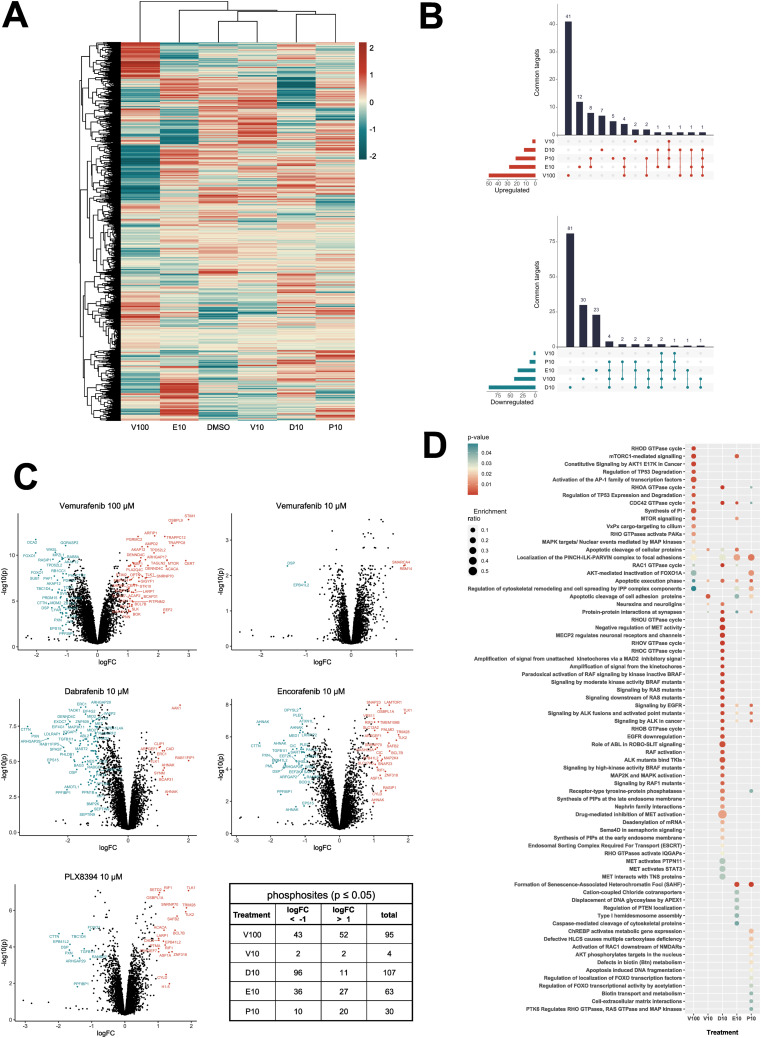
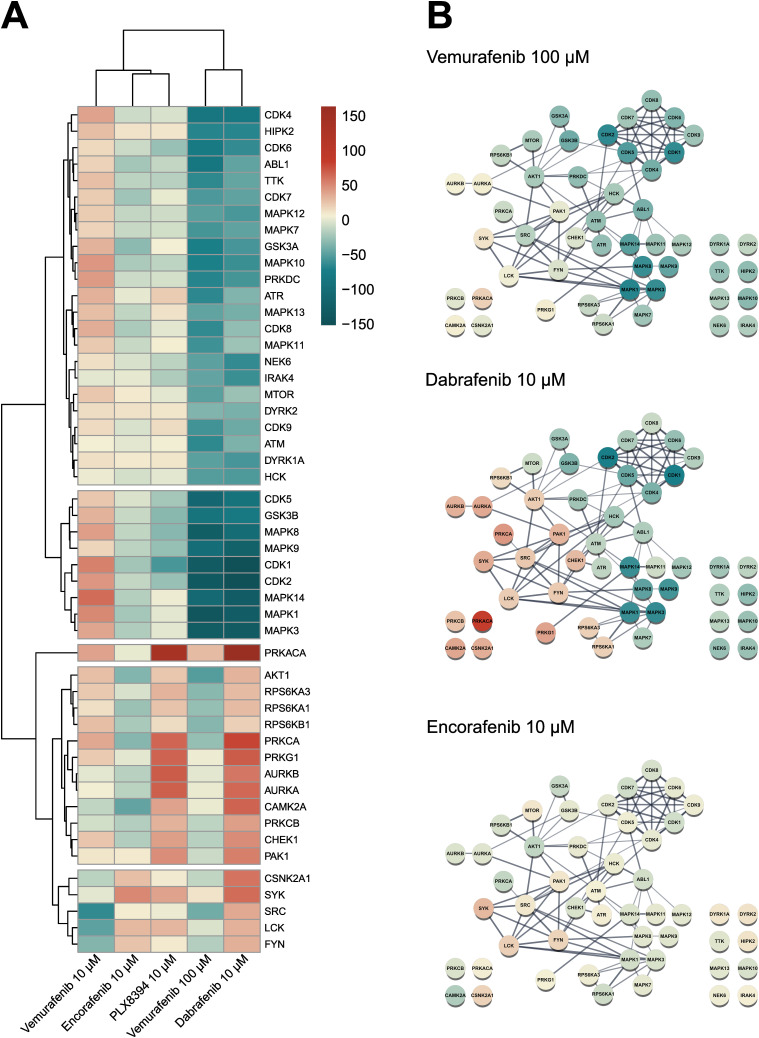
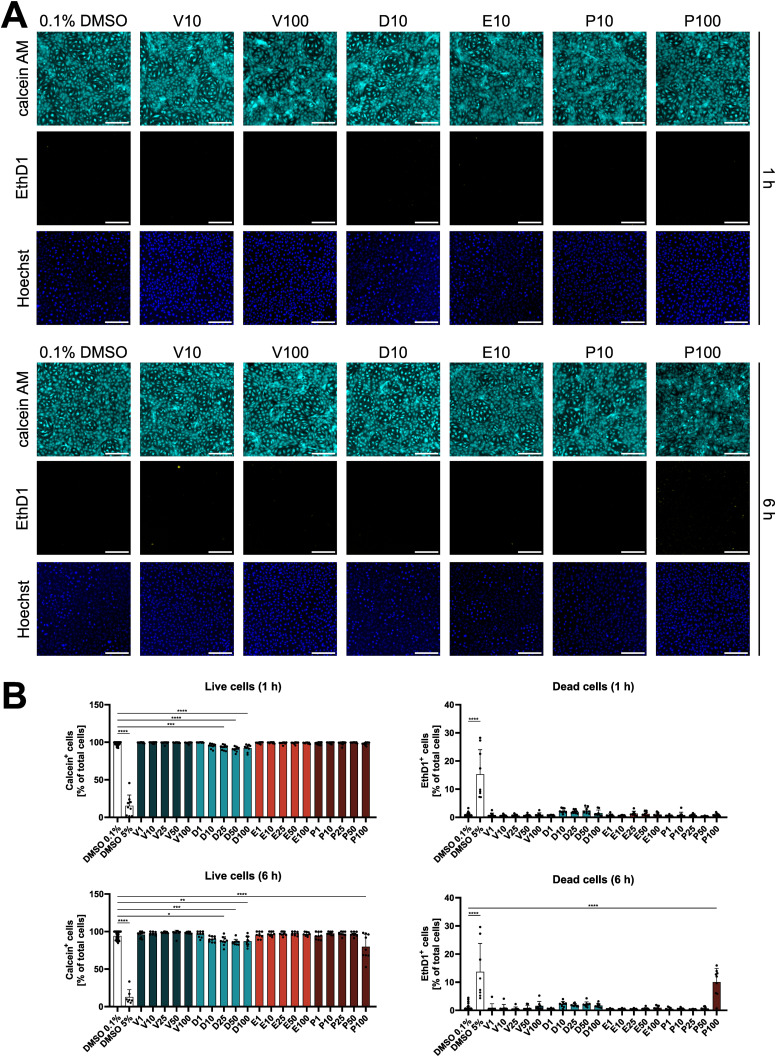
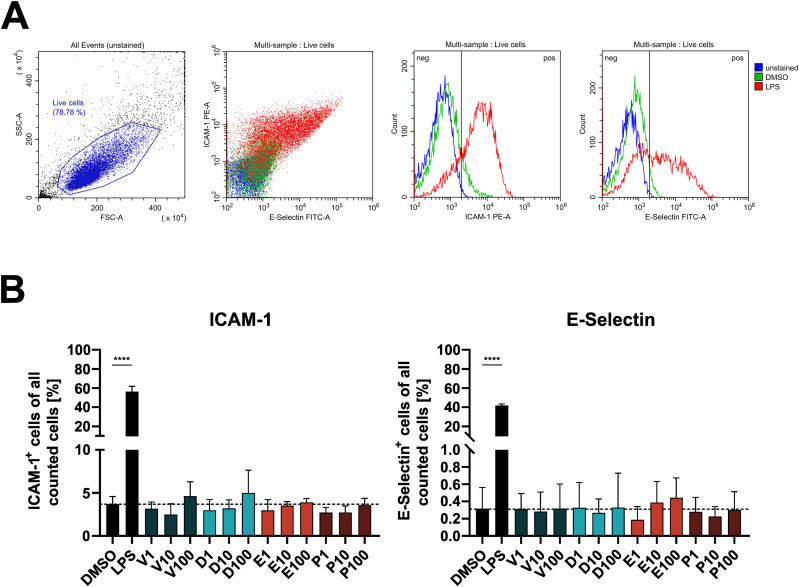
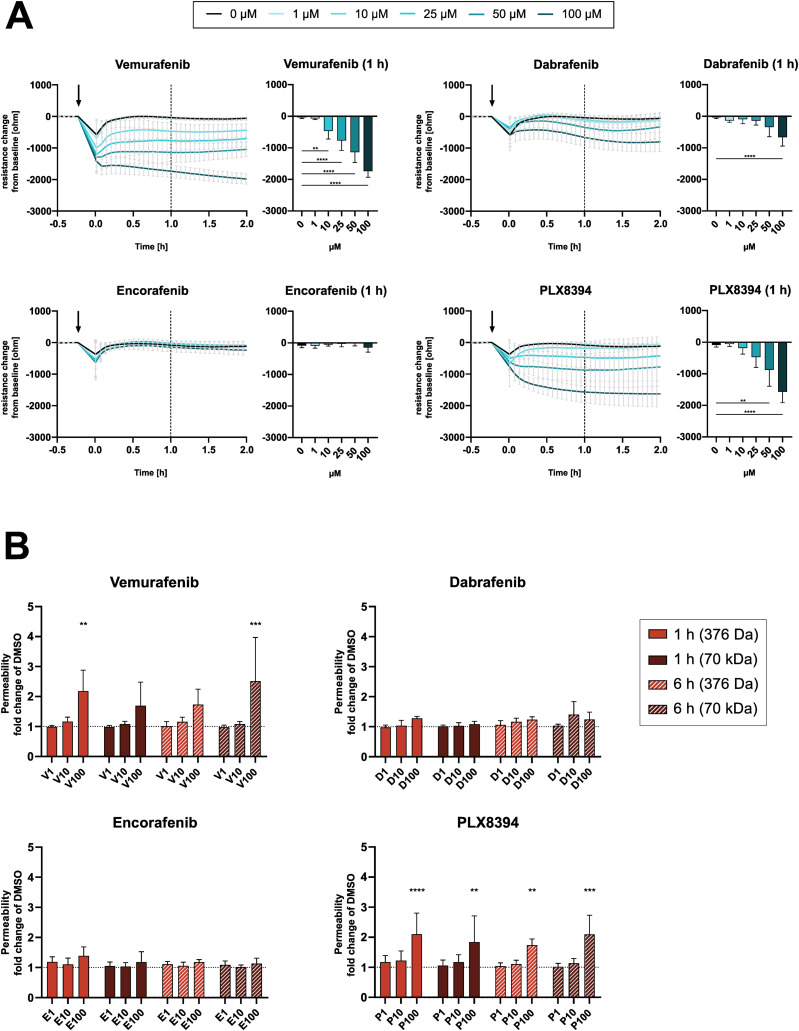
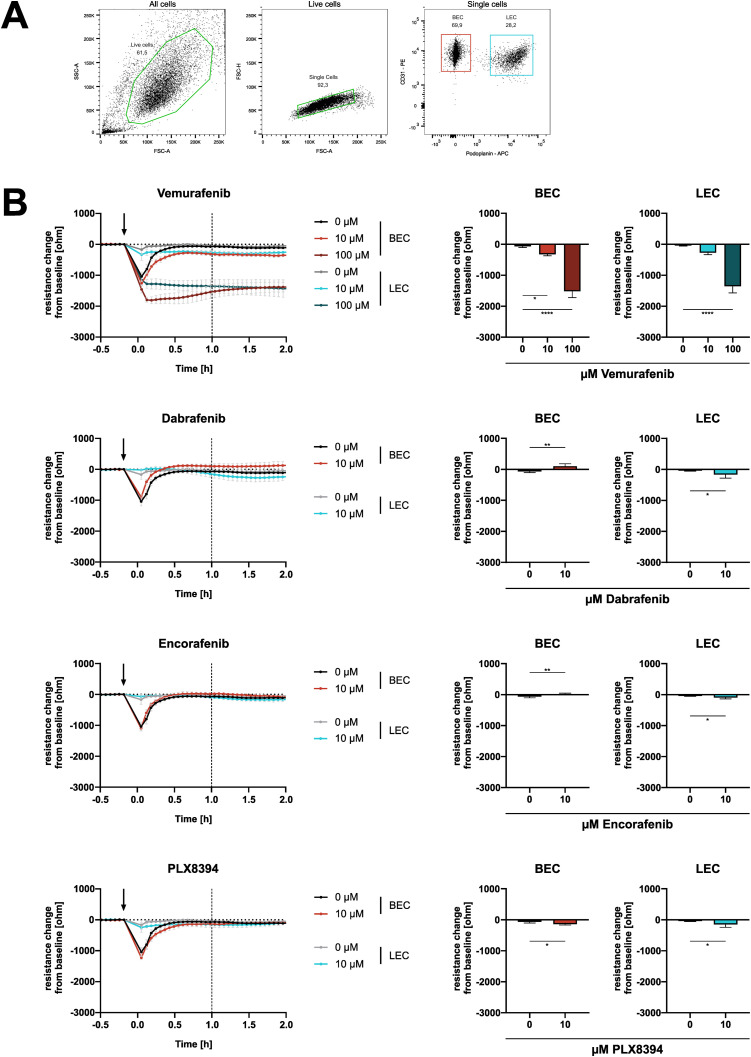
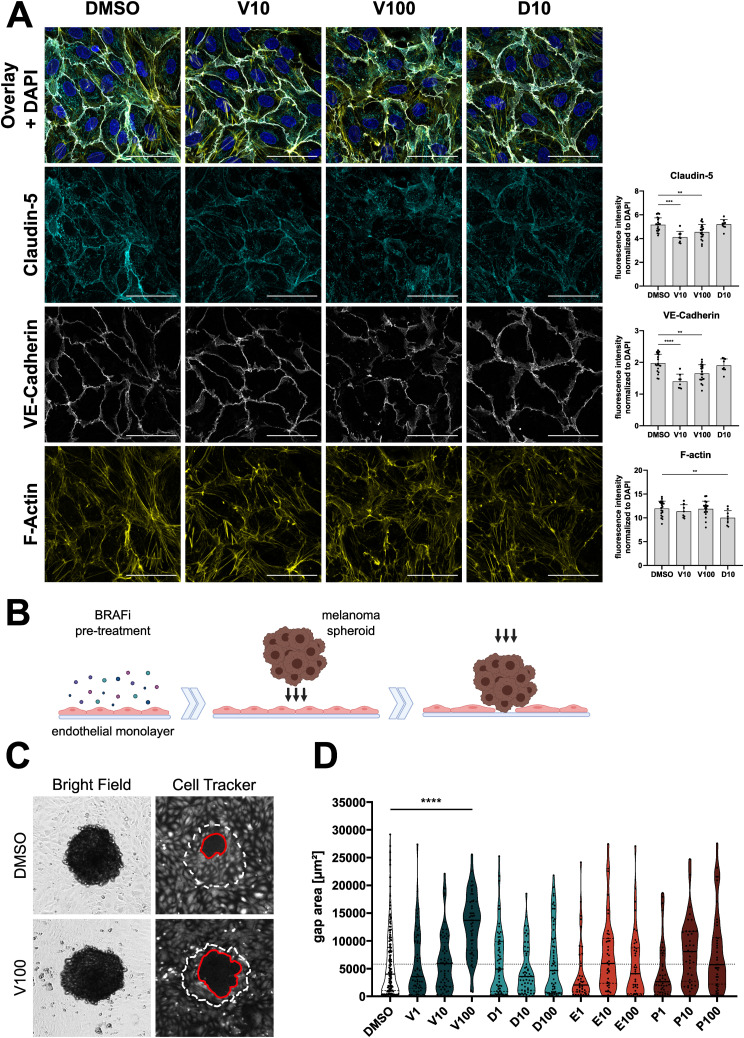
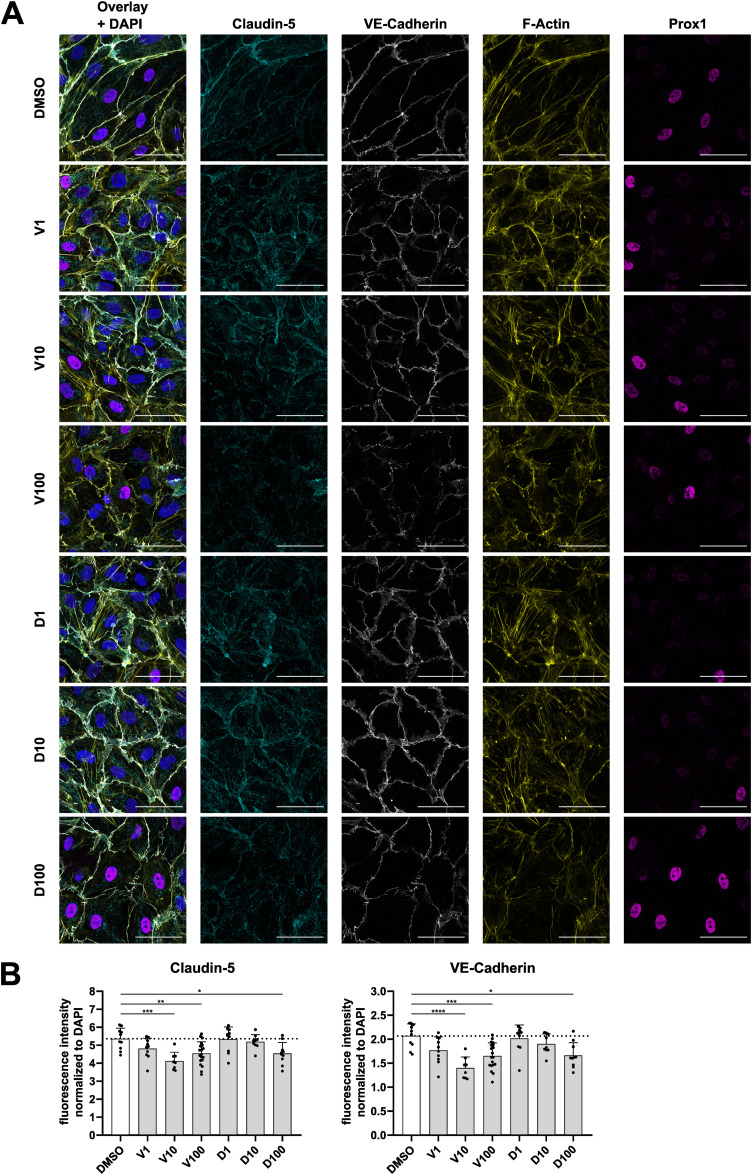
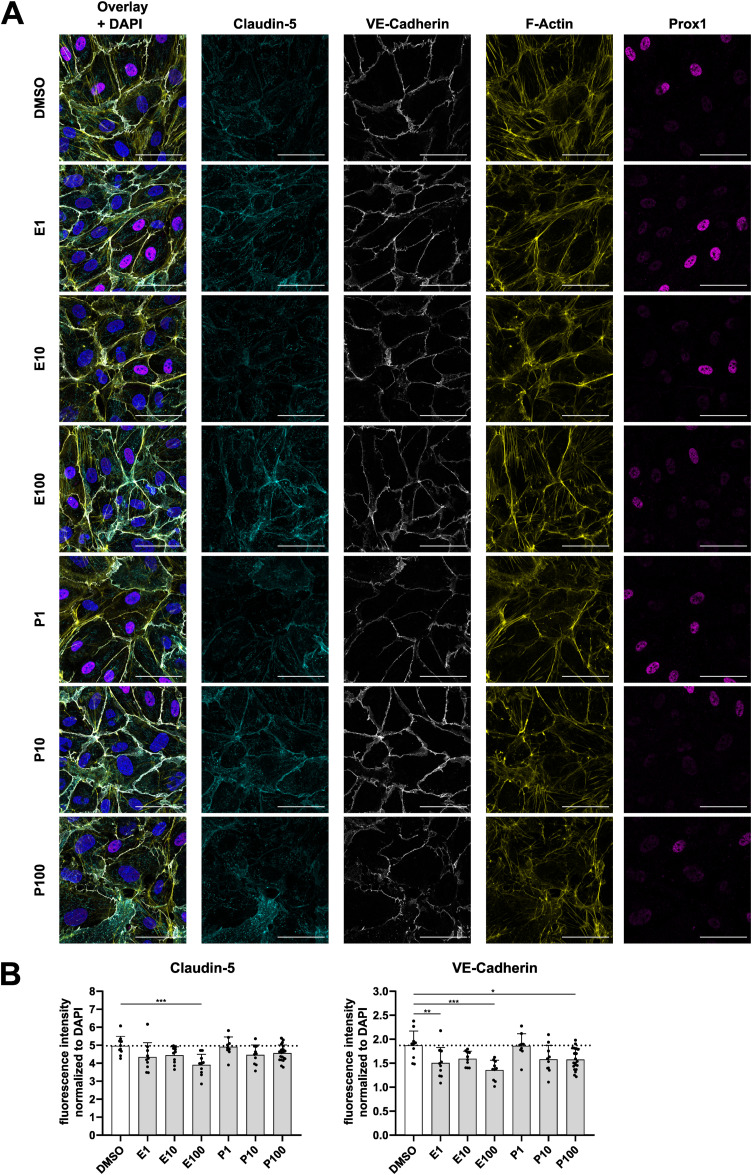
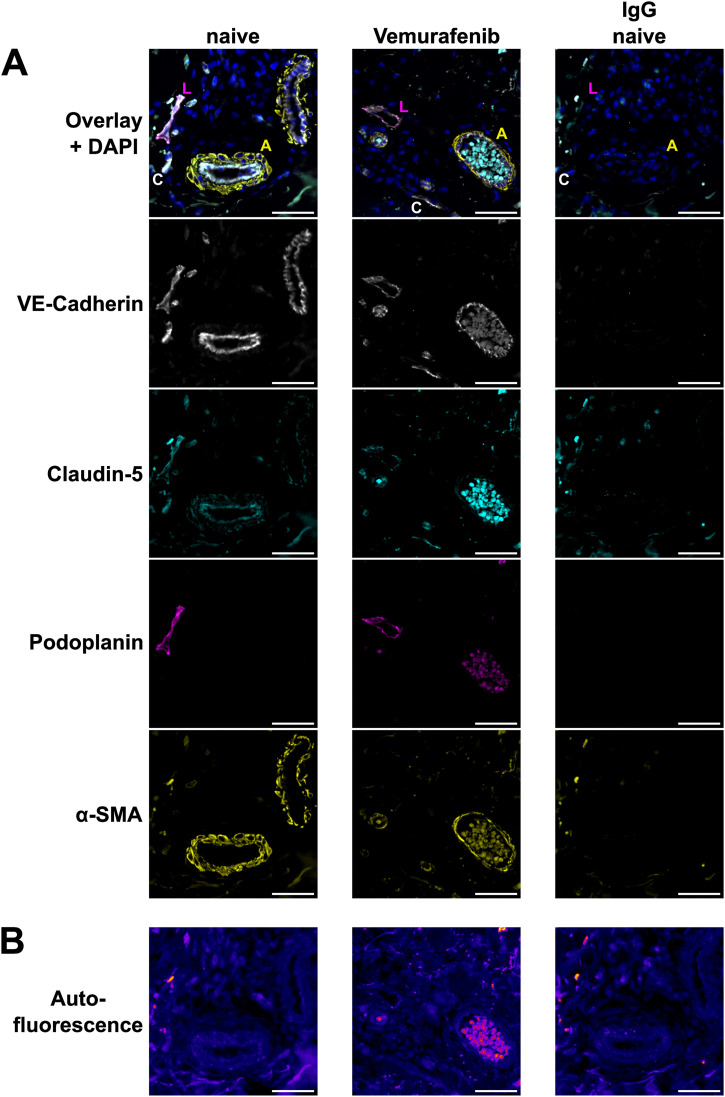
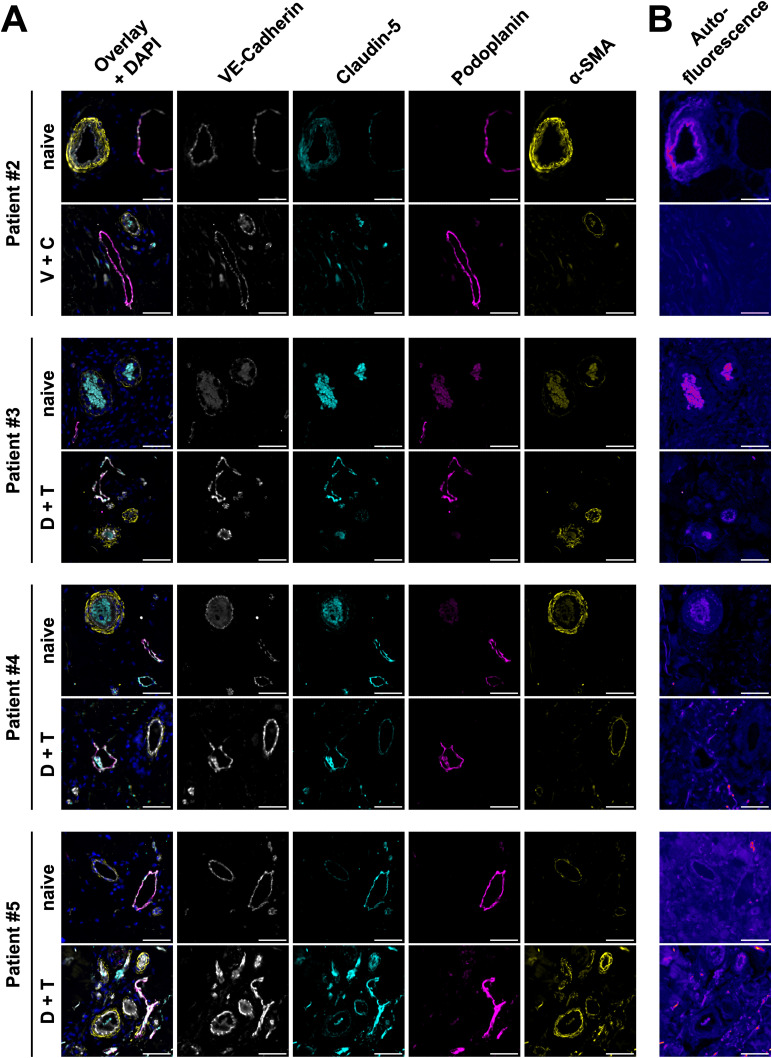
Targeted therapies against mutant BRAF are effectively used in combination with MEK inhibitors (MEKi) to treat advanced melanoma. However, treatment success is affected by resistance and adverse events (AEs). Approved BRAF inhibitors (BRAFi) show high levels of target promiscuity, which can contribute to these effects. The blood vessel lining is in direct contact with high plasma concentrations of BRAFi, but effects of the inhibitors in this cell type are unknown. Hence, we aimed to characterize responses to approved BRAFi for melanoma in the vascular endothelium. We showed that clinically approved BRAFi induced a paradoxical activation of endothelial MAPK signaling. Moreover, phosphoproteomics revealed distinct sets of off-targets per inhibitor. Endothelial barrier function and junction integrity were impaired upon treatment with vemurafenib and the next-generation dimerization inhibitor PLX8394, but not with dabrafenib or encorafenib. Together, these findings provide insights into the surprisingly distinct side effects of BRAFi on endothelial signaling and functionality. Better understanding of off-target effects could help to identify molecular mechanisms behind AEs and guide the continued development of therapies for BRAF-mutant melanoma.


Conflict of interest statement

JM Ressler received speaker honoraria from Bristol-Myers Squibb, Roche, Amgen and Novartis and travel support by Sanofi, Roche, and Bristol-Myers Squibb through institution. All other authors declare that they have no conflict of interest.

Figures

Figure 1.
Figure 1.. BRAFi induce paradoxical ERK1/2 activation in endothelial cells.
(A, B) Fluorescence-based detection of pERK1/2 (T202/Y204), total ERK1/2 and GAPDH in Western blots of melanoma cells (A) and dermal microvascular endothelial cells (B), treated with indicated concentrations of vemurafenib for 1 h. (C) Quantification of band intensities of blots shown in A+B (pERK/ERK ratio) displayed as fold change from the respective vehicle control. (D) Fluorescence-based detection and respective quantifications of ERK1/2 phosphorylation in Western blots of dermal microvascular endothelial cells treated with indicated BRAFi concentrations for 1 h. Quantification of band intensities is displayed as fold change of pERK/ERK ratio from the vehicle control (mean ± SD, n = 3–4).
Figure S1.
Figure S1.. BRAFi differentially affect ERK1/2 activation in dermal microvascular endothelial cells and melanoma cells.
Abundances of pERK1/2 (T202/Y204), total ERK1/2 and GAPDH in dermal microvascular endothelial cells and melanoma cells after 1 h of indicated BRAFi treatment. Vemurafenib blots from Fig 1A and B are inserted in the first panel for comparison.
Figure S2.
Figure S2.. BRAFi do not affect overall protein expression.
Mass spectrometry-based proteomics data of dermal microvascular endothelial cells treated with the indicated inhibitors for 1 h analyzed from the same lysates as in Fig 2. (A, B, C, D, E) Protein abundances of treated cells compared with vehicle control (Limma, logFC ± 1, P ≤ 0.05). (F) Quantification of differentially recovered peptides compared with vehicle control.
Figure 2.
Figure 2.. BRAFi disrupt the endothelial phosphoproteome.
Mass spectrometry-based phosphoproteomics data of dermal microvascular endothelial cells treated with vehicle control (DMSO), 10 μM of vemurafenib (V10), dabrafenib (D10), encorafenib (E10), PLX8394 (P10), or 100 μM vemurafenib (V100) for 1 h. (A) Z-scored phosphosite abundance per condition (n = 3 donors). (B) Overlaps of significantly up- (red) or downregulated (blue) phosphoproteins among treatments relative to the DMSO control (Limma, logFC ± 1, P ≤ 0.05). (C) Phosphoprotein abundance of treatments compared with the DMSO control. (D) Reactome pathway enrichment analysis of proteins with a significantly altered phosphorylation status, listed according to P-value and enrichment ratio calculated as entities found/total number of entities in the pathway.
Figure 3.
Figure 3.. BRAFi differentially affect endothelial kinase signaling.
(A) Predicted kinase activity scores were computed from the phosphoproteomics dataset with KinSwingR. Weighted score for predicted activity of the 50 most differentially regulated kinases across all treatments compared with vehicle control. Scale ≙ Swing score. (B) STRING physical subnetwork visualization of the same 50 kinases, Scale ≙ Swing score.
Figure S3.
Figure S3.. BRAFi do not affect endothelial cell viability.
(A) Fluorescence images of live dermal microvascular endothelial cells positive for calcein AM (cyan) and dead dermal microvascular endothelial cells positive for ethidium homodimer-1 (EthD1, yellow), after treatment with indicated BRAFi for 1 or 6 h. Hoechst (blue) was used as a nuclear counterstain to identify the total number of cells present. Wells treated with 100 μM of PLX8394 (P100) had a higher level of background fluorescence because of precipitate formation in the EthD1 channel that did not colocalize with the nuclear stain. (B) Quantification and statistical analysis of calcein- or EthD1-positive cells (n = 8–10 biological replicates from three independent experiments), measured within Hoechst-positive nuclei.
Figure S4.
Figure S4.. BRAFi do not affect surface expression of endothelial activation markers.
(A) Gating for endothelial activation markers ICAM-1 and E-Selectin, using unstained cells, or stained cells treated with 0.1% DMSO, or 10 ng/ml LPS as an example. (B) Percentage of ICAM-1 or E-Selectin positive cells upon treatment with 0.1% DMSO, 10 ng/ml LPS, or 1–100 μM BRAFi for 6 h.
Figure 4.
Figure 4.. BRAFi disrupt endothelial barrier function.
(A) electrical cell-substrate impedance sensing real-time measurements of electrical barrier resistance in a dermal microvascular endothelial cells monolayer upon BRAFi treatment, displayed as resistance change (ohm) from the time of inhibitor addition (mean ± SD, n = 5–10 biological replicates in four separate experiments). (B) Permeability of fluorescently labelled tracers Na-Fluorescein (375 Da) and TRITC-dextrane (70 kD) after 1 and 6 h of BRAFi treatment (n = 3–4 experiments with three biological replicates each). Results are depicted as fold change of the DMSO control (mean ± SD). Significance was tested using two-way ANOVA and Dunnett’s test for multiple comparisons with the DMSO control.
Figure S5.
Figure S5.. Effects of BRAFi on electrical barrier resistance are present in blood endothelial cells (BEC) and lymphatic endothelial cells (LEC).
(A) Exemplary gating for FACS-based sorting of dermal microvascular endothelial cells into BEC (CD31-positive, podoplanin-negative) and LEC (double-positive). Sorted cells of three dermal microvascular endothelial cells donors were used for electrical cell-substrate impedance sensing measurements. (B) electrical cell-substrate impedance sensing real-time measurements of electrical barrier resistance in BEC or LEC monolayers upon BRAFi treatment, displayed as resistance change (ohm) from the time of inhibitor addition (mean ± SD, n = 3–6 biological replicates in three separate experiments). Statistical testing was performed either via one-way ANOVA with Dunnett’s multiple comparisons (vemurafenib) or unpaired t tests (dabrafenib, encorafenib, PLX8394). Tests were performed between treatments and their respective DMSO control, according to cell type.
Figure 5.
Figure 5.. BRAFi differentially affect endothelial junctions and resilience against tumor cell invasion.
(A) Immunofluorescence images of confluent dermal microvascular endothelial cells (DMEC), treated with DMSO, vemurafenib, or dabrafenib for 1 h. Cyan = claudin-5, white = VE-Cadherin, yellow = F-actin. Scale bars = 50 μm. Right panel: Quantification of overall fluorescence intensities of junctional markers, normalized to the DAPI signal intensity, depicted as mean + SD (n = 9–20 images per condition). (B) Fluorescently labelled DMEC monolayers were treated with BRAFi for 6 h, before incubation with melanoma spheroids for 6 h. Melanoma cells breached the endothelial barrier and lead to gaps in the monolayers. (C) Brightfield and fluorescence images of melanoma spheroids on top of DMEC monolayers. Gaps (red line) were measured in the endothelial monolayer beneath spheroids (white dotted line). (D) The area of gaps is depicted as mean ± SD (n[treatment] = 37–60 spheroids, n[control] = 176 spheroids, from at least three independent experiments). For statistical analysis, all treatments were compared with the DMSO control.
Figure S6.
Figure S6.. Vemurafenib and dabrafenib differentially affect endothelial tight and adherens junctions.
(A) Immunofluorescence images of confluent dermal microvascular endothelial cells treated with vemurafenib, dabrafenib, or DMSO for 1 h. Cyan = claudin-5, white = VE-cadherin, yellow = F-actin, magenta = Prox1. Scale bars = 50 μm. (B) Quantification of signal intensities of indicated markers, normalized to the DAPI signal in the respective image, depicted as mean + SD (n = 9–20 images per condition).
Figure S7.
Figure S7.. Encorafenib and PLX8394 differentially affect endothelial tight and adherens junctions.
(A) Immunofluorescence images of confluent dermal microvascular endothelial cells treated with encorafenib, PLX8394, or DMSO for 1 h. Cyan = claudin-5, white = VE-cadherin, yellow = F-actin, magenta = Prox1. Scale bars = 50 μm. (B) Quantification of signal intensities of indicated markers, normalized to the DAPI signal in the respective image, depicted as mean + SD (n = 9–20 images per condition).
Figure 6.
Figure 6.. Effect of vemurafenib on patient vessels.
(A) Immunofluorescence images of vascular markers in skin biopsy sections of patient #1 before (naive) and during vemurafenib monotherapy. Markers are VE-cadherin (white), claudin-5 (cyan), podoplanin (magenta), and α-smooth muscle actin (yellow). Letters specify vessel types in the overlay images as follows: artery (A), capillary (C), lymphatic (L). Scale bars = 50 μm. (B) Sample Autofluorescence of the same tissue areas as depicted in (A). Scale bars = 50 μm.
Figure S8.
Figure S8.. Effect of BRAFi on patient vessels.
(A) Immunofluorescence images of vascular markers in skin biopsies of patient #2 (vemurafenib + cobimetinib) and #3–#5 (dabrafenib + trametinib) before and during therapy. Sections were stained for VE-cadherin (white), claudin-5 (cyan), podoplanin (magenta), and α-smooth muscle actin (yellow). Scale bars = 50 μm. (B) Sample Autofluorescence images of the same tissue areas as depicted in (A). Scale bars = 50 μm.

Similar articles

Cited by

References

    1. Abdel-Rahman O, ElHalawani H, Ahmed H (2016) Doublet BRAF/MEK inhibition versus single-agent BRAF inhibition in the management of BRAF-mutant advanced melanoma, biological rationale and meta-analysis of published data. Clin Transl Oncol 18: 848–858. 10.1007/s12094-015-1438-0 - DOI - PubMed
    1. Adelmann CH, Ching G, Du L, Saporito RC, Bansal V, Pence LJ, Liang R, Lee W, Tsai KY (2016) Comparative profiles of BRAF inhibitors: The paradox index as a predictor of clinical toxicity. Oncotarget 7: 30453–30460. 10.18632/oncotarget.8351 - DOI - PMC - PubMed
    1. Ascierto PA, Kirkwood JM, Grob JJ, Simeone E, Grimaldi AM, Maio M, Palmieri G, Testori A, Marincola FM, Mozzillo N (2012) The role of BRAF V600 mutation in melanoma. J Transl Med 10: 85. 10.1186/1479-5876-10-85 - DOI - PMC - PubMed
    1. Ascierto PA, McArthur GA, Dréno B, Atkinson V, Liszkay G, Di Giacomo AM, Mandalà M, Demidov L, Stroyakovskiy D, Thomas L, et al. (2016) Cobimetinib combined with vemurafenib in advanced BRAFV600-mutant melanoma (coBRIM): Updated efficacy results from a randomised, double-blind, phase 3 trial. Lancet Oncol 17: 1248–1260. 10.1016/S1470-2045(16)30122-X - DOI - PubMed
    1. Bankhead P, Loughrey MB, Fernández JA, Dombrowski Y, McArt DG, Dunne PD, McQuaid S, Gray RT, Murray LJ, Coleman HG, et al. (2017) QuPath: Open source software for digital pathology image analysis. Sci Rep 7: 16878. 10.1038/s41598-017-17204-5 - DOI - PMC - PubMed

MeSH terms