. 2024 Dec 10;74(1):90-102.
doi: 10.1136/gutjnl-2024-331903.

Targeting the oncogenic m6A demethylase FTO suppresses tumourigenesis and potentiates immune response in hepatocellular carcinoma

Affiliations

Targeting the oncogenic m6A demethylase FTO suppresses tumourigenesis and potentiates immune response in hepatocellular carcinoma

Ao Chen et al. Gut. .

Abstract

Objective: Fat mass and obesity-associated protein (FTO), an eraser of N 6-methyadenosine (m6A), plays oncogenic roles in various cancers. However, its role in hepatocellular carcinoma (HCC) is unclear. Furthermore, small extracellular vesicles (sEVs, or exosomes) are critical mediators of tumourigenesis and metastasis, but the relationship between FTO-mediated m6A modification and sEVs in HCC is unknown.

Design: The functions and mechanisms of FTO and glycoprotein non-metastatic melanoma protein B (GPNMB) in HCC progression were investigated in vitro and in vivo. Neutralising antibody of syndecan-4 (SDC4) was used to assess the significance of sEV-GPNMB. FTO inhibitor CS2 was used to examine the effects on anti-PD-1 and sorafenib treatment.

Results: FTO expression was upregulated in patient HCC tumours. Functionally, FTO promoted HCC cell proliferation, migration and invasion in vitro, and tumour growth and metastasis in vivo. FTO knockdown enhanced the activation and recruitment of tumour-infiltrating CD8+ T cells. Furthermore, we identified GPNMB to be a downstream target of FTO, which reduced the m6A abundance of GPNMB, hence, stabilising it from degradation by YTH N 6-methyladenosine RNA binding protein F2. Of note, GPNMB was packaged into sEVs derived from HCC cells and bound to the surface receptor SDC4 of CD8+ T cells, resulting in the inhibition of CD8+ T cell activation. A potential FTO inhibitor, CS2, suppresses the oncogenic functions of HCC cells and enhances the sensitivity of anti-PD-1 and sorafenib treatment.

Conclusion: Targeting the FTO/m6A/GPNMB axis could significantly suppress tumour growth and metastasis, and enhance immune activation, highlighting the potential of targeting FTO signalling with effective inhibitors for HCC therapy.

Keywords: CELL BIOLOGY; GENE REGULATION; HEPATOCELLULAR CARCINOMA; IMMUNE RESPONSE.


Conflict of interest statement

Competing interests: None declared.

Figures

Figure 1
Figure 1. Frequent upregulation of FTO RNA demethylase in human HCC. (A) The RNA-seq data demonstrates that FTO is frequently upregulated in our in-house HKU-QMH HCC cohort (n=41) and TCGA paired HCC cohort (n=50). (B) The mRNA level of FTO was highly expressed in 40% of 95 pairs of patients’ HCC samples when compared with non-tumourous liver tissues. (C) Representative immunohistochemical images of FTO in HCC tissue and non-tumourous liver tissue. (D) The high FTO expression was associated with a poorer overall survival of patients with HCC. (E) With a cut-off of twofold upregulation by qPCR, overexpression of FTO was significantly associated with more advanced tumour stages (p=0.000029). t-test, mean±SD, *p<0.05, **p<0.01, ***p<0.001. FTO, fat mass and obesity-associated protein; HCC, hepatocellular carcinoma; HKU, University of Hong Kong; QMH, Queen Mary Hospital; qPCR, quantitative PCR; NT, non-tumour; TCGA, The Cancer Genome Atlas.
Figure 2
Figure 2. Knockdown (KD) of fat mass and obesity-associated protein (FTO) suppressed hepatocellular carcinoma cell proliferation, metastasis and self-renewal ability. (A) Western blotting showed successful stable KD of FTO in 97L and HepG2 cells. (B) Significant inhibition on cell proliferation on FTO KD. (C) The number of migrated or invaded cells was significantly reduced on FTO KD (n=3). (D) A schematic representation of the orthotopic injection model. (E) Bioluminescent images of nude mice subjected to orthotopic liver injection of 97L-luc cells (non-target control (NTC), shFTO#1 and shFTO#2) (n=7 for each group). (F) Bioluminescent images of livers and quantification of their bioluminescent intensities. (G) Dissected livers with tumours from the three groups of mice and weights of the dissected tumours. (H) Bioluminescent images of lung tissues and metastasis rate to lungs. (I) Colony formation assay and (J) sphere formation assay on FTO KD and NTC groups in 97L and HepG2 cells (n=3). (K) In vivo limiting dilution assay showing rates of tumour formation from subcutaneous injection of 2×10³, 2×10⁴ and 2×10⁵ 97 L cells. (L), (M) The tumour incidence rate for each group was recorded at the end of the experiments after 4 weeks. Tumour initiating capacity was analysed by the CIs with the formula of CI=1/(stem cell frequency). t-test, mean±SD, *p<0.05, **p<0.01, ***p<0.001.
Figure 3
Figure 3. Fat mass and obesity-associated protein (FTO) knockdown (KD) enhanced immune response in vivo and in vitro. (A) Diagram showing orthotopic injection of luciferase-labelled Hepa1-6 cells (non- target control (NTC), shFto#1 and shFto#2) in C57BL/6 mice. (B) Bioluminescent images and quantification of their bioluminescent intensities. (n=6 in each group) (C) Livers with tumours and tumour mass. (D) Proportions of tumour infiltrating immune cells, CD45+, CD45+CD8+ and CD45+CD8+PD-1+ cells, by flow cytometry. (E) Flow cytometry showing significant increase in CD44+CD62L effector memory CD8+T cells in human peripheral blood mononuclear cells (PBMCs) on coculturing with FTO KD hepatocellular carcinoma (HCC) cells. (F), (G) Migrated M1 and M2 macrophages after coculturing with HCC cells (NTC, shFTO#1 and shFTO#2). (E)-(G) Results were from three independent experiments. One-way analysis of variance followed by Dunnett comparison test, mean±SD, *p<0.05, **p<0.01, ***p<0.001.
Figure 4
Figure 4. RNA-sequencing and m6A-methylated RNA immunoprecipitation assay identified glycoprotein non-metastatic melanoma protein B (GPNMB) as a downstream target of fat mass and obesity-associated protein (FTO)-mediated N6-methyadenosine (m6A) modification. (A) Venn diagram and (B) GO biological processes annotation analysis showing genes downregulated by >1.5-fold on FTO knockdown (KD) in HepG2 and 97L cells. (C and D) FTO KD significantly downregulated the mRNA level of potential downstream target genes (GPNMB, PDGFB and ROBO4) in 97L and HepG2 cells, respectively (n=3). (E) FTO- wildtype (FTO-WT) overexpression in PLC cells upregulated the mRNA levels of the three genes but this upregulation was abolished on FTO mutation (n=3) only for GPNMB. (F) Distribution of m6A peaks in different regions of mRNA as detected in m6A-seq assays conducted in control or FTO KD 97L cells. (G) The significantly increased (blue) m6A peaks on FTO KD in 97L cells. (H) The increased m6A abundance of mRNA in upregulated (red) or downregulated (blue) genes on FTO KD in 97L cells. (I) The m6A abundance in the GPNMB transcript. The m6A peaks were called by exome-Peak. t-test, mean±SD, *p<0.05, **p<0.01, ***p<0.001. FTO-MUT, FTO mutated; NTC, non-target control.
Figure 5
Figure 5. FTO KD attenuated GPNMB mRNA stability through YTHDF2. (A) GPNMB was frequently upregulated in our in-house RNA-seq HCC cohort (n=41 pairs) and TCGA HCC cohort (n=375). (B) The mRNA and protein levels of GPNMB were reduced in FTO stable KD 97L cells. (C) Determination of m6A abundance by Dot Blot assay in HepG2 and 97L cells on FTO stable KD. (D) The mRNA and protein level of GPNMB in PLC cells on overexpression of FTO-WT or FTO-MUT. (E) The mRNA levels of GPNMB in FTO KD 97L cells with or without silencing YTHDF2. (n=3). (F) A schematic diagram illustrating GPNMB expression was regulated by FTO-mediated m6A modification through YTHDF2-mediated mRNA degradation. t-test, mean±SD, *p<0.05, **p<0.01, ***p<0.001). FTO, fat mass and obesity-associated protein; FTO-MUT, FTO mutated; FTO-WT, FTO-wildtype; GPNMP, glycoprotein non-metastatic melanoma protein B; HCC, hepatocellular carcinoma; HKU, University of Hong Kong; QMH, Queen Mary Hospital; qPCR, quantitative PCR; m6A, N6-methyladenosine; NTC, non-target control; NT, non-tumour; TCGA, The Cancer Genome Atlas; YTHDF2, YTH N6-methyladenosine RNA binding protein F2.
Figure 6
Figure 6. Glycoprotein non-metastatic melanoma protein B (GPNMB) knockdown (KD) inhibited hepatocellular carcinoma tumour growth metastasis and stemness. (A) GPNMB KD significantly inhibited proliferation of HepG2 and 97L cells. (B) The numbers of migrated cells were significantly reduced on fat mass and obesity-associated protein KD (n=3). (C and D) Orthotopic liver injection with Hepa1-6 with or without GPNMB KD in nude mice. Bioluminescence images of livers and lungs, with quantification of their bioluminescent intensities. (E) KD of GPNMB significantly suppressed the colony formation ability in 97L and HepG2 cells (n=3). (F) KD of GPNMB significantly reduced the size and number of hepatospheres formed by 97L and HepG2 cells (n=3). (G and H) Limiting dilution assay to assess the effects of GPNMB KD on tumourigenicity in nude mice. 2×10³, 2×10⁴ and 2×10⁵ 97 L cells were injected subcutaneously into nude mice. The tumour incidence rate for each group was recorded at the end of the experiments. Tumour initiating capacity was calculated by the CIs with the formula of CI=1/(stem cell frequency). t-test, mean±SD, *p<0.05, **p<0.01, ***p<0.001. NTC, non-target control.
Figure 7
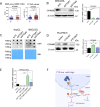
Figure 7. Fat mass and obesity-associated protein (FTO) activated AKT, ERK and WNT pathways and suppressed immune cell activation through upregulating glycoprotein non-metastatic melanoma protein B (GPNMB). (A) The cell proliferation, (B) migratory ability and (C) sphere forming ability on rescue of FTO knock down (KD) with overexpression of GPNMB in 97 L cells (n=3). (D) Western blotting showing GPNMB KD suppressed activation of AKT, ERK, WNT signalling pathway in 97L cells. (E) Overexpression of GPNMB rescued the activation of AKT, ERK, WNT signalling pathways shown with western blotting in 97L cells. (F) Western blots showing presence of GPNMB in small extracellular vesicles (sEVs) derived from PLC (EV, FTO-wildtype (FTO-WT), FTO-mutated (FTO-MUT)) and 97L cells (non-target control (NTC), shGPNMB). CD63, CD81, HSP70, CD9, CD63 and ALIX are positive EV markers and GM130 is a negative EV marker, and they were used as loading control. (G) Representative electron micrographs showing the morphology of sEVs from PLC and 97L cells (upper panel) (scale bar=200 nm), and immunogold labelling (lower panel) (scale bar=30 nm). (H) Western blot showing the protein expression of GPNMB, surface-sEVs marker CD63 and intra-sEV marker HSP70 in 97L-derived sEVs treated with increasing concentrations of proteinase K. (I) The correlation between GPNMB expression and CD8+ T cell fraction was confirmed in Sc-seq data of hepatocellular carcinoma patients. (J) Flow cytometry showing significant increase CD44+CD62L effector memory T cells on treating with sEVs derived from GPNMB KD 97L cells compared with NTC group. (K) Co-immunoprecipitation assay showing GFP-GPNMB located on the surface of sEVs interacted with SDC4 as a surface receptor on human CD8+ T cells. Total cell lysate (input) was used as positive control. (L) Flow cytometry showing significant increase CD44+CD62L effector memory T cells on treating with SDC4 blocking antibody. t-test, mean±SD, **p<0.01, ***p<0.001.
Figure 8
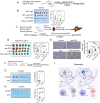
Figure 8. Blockade of fat mass and obesity-associated protein (FTO) sensitised hepatocellular carcinoma to anti-PD-1 immune checkpoint blockade therapy. (A) Schematic diagram illustrating the workflow of anti-PD-1 treatment in orthotopic liver injection mouse model with Hepa1-6 cells injection (non-target control (NTC)/shFto+IgG, NTC/shFto+anti-PD-1). (B) Tumours dissected from livers and their tumour masses. (C) A schematic summary of FTO inhibitor CS2 and anti-PD-1 treatment in hydrodynamic tail vein injection (p53 KO/c-Myc) model with induced tumours in mice. (D) Livers with tumours and liver weights representing the tumour masses on treatment with anti-PD-1, CS2 and CS2+anti-PD-1 combination treatment. (E) Immunohistochemical staining of tumour infiltrating CD8+ T cells in liver tumour tissues of mice (left panel) (scale bar=100 µm) and quantification (right panel). (F) A summary of FTO inhibitor treatment in human colorectal adenocarcinoma HCT-15 cells and human cholangiocarcinoma HuCCT1 cell-derived subcutaneous xenografts. (G and H) Tumour xenografts of HCT-15 and HuCCT1 cells treated with vehicle control and CS2. (I) A schematic summary of this study. t-test, mean±SD, *p<0.05, **p<0.01.

References

    1. Meyer KD, Saletore Y, Zumbo P, et al. Comprehensive analysis of mRNA methylation reveals enrichment in 3′ UTRs and near stop codons. Cell. 2012;149:1635–46. doi: 10.1016/j.cell.2012.05.003. - DOI - PMC - PubMed
    1. Frye M, Harada BT, Behm M, et al. RNA modifications modulate gene expression during development. Science. 2018;361:1346–9. doi: 10.1126/science.aau1646. - DOI - PMC - PubMed
    1. Shi H, Wei J, He C. Where, when, and how: context-dependent functions of RNA methylation writers, readers, and erasers. Mol Cell. 2019;74:640–50. doi: 10.1016/j.molcel.2019.04.025. - DOI - PMC - PubMed
    1. Yang Y, Hsu PJ, Chen Y-S, et al. Dynamic transcriptomic M6A decoration: writers, erasers, readers and functions in RNA metabolism. Cell Res. 2018;28:616–24. doi: 10.1038/s41422-018-0040-8. - DOI - PMC - PubMed
    1. Zhao BS, Roundtree IA, He C. Post-transcriptional gene regulation by mRNA modifications. Nat Rev Mol Cell Biol. 2017;18:31–42. doi: 10.1038/nrm.2016.132. - DOI - PMC - PubMed

MeSH terms

Substances