. 2024 Jul 31;44(31):e2322232024.
doi: 10.1523/JNEUROSCI.2322-23.2024.

Brain Network Interconnectivity Dynamics Explain Metacognitive Differences in Listening Behavior

Affiliations

Brain Network Interconnectivity Dynamics Explain Metacognitive Differences in Listening Behavior

Mohsen Alavash et al. J Neurosci. .

Erratum in

Abstract

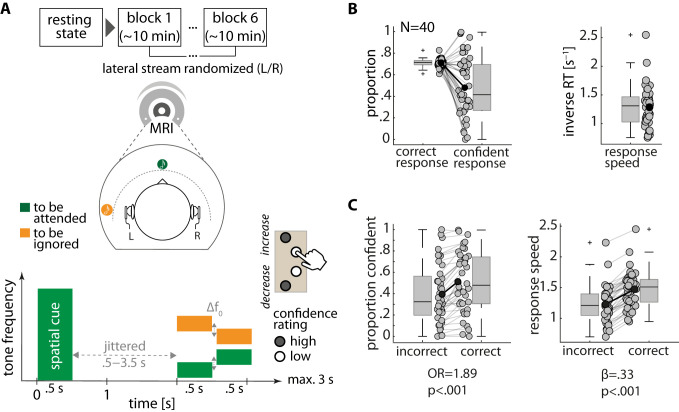
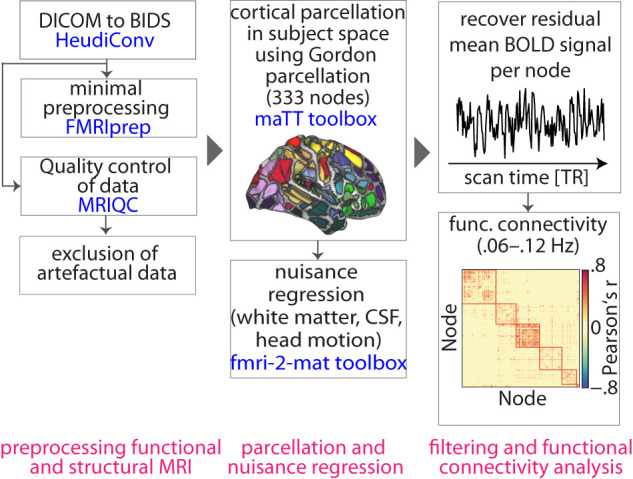
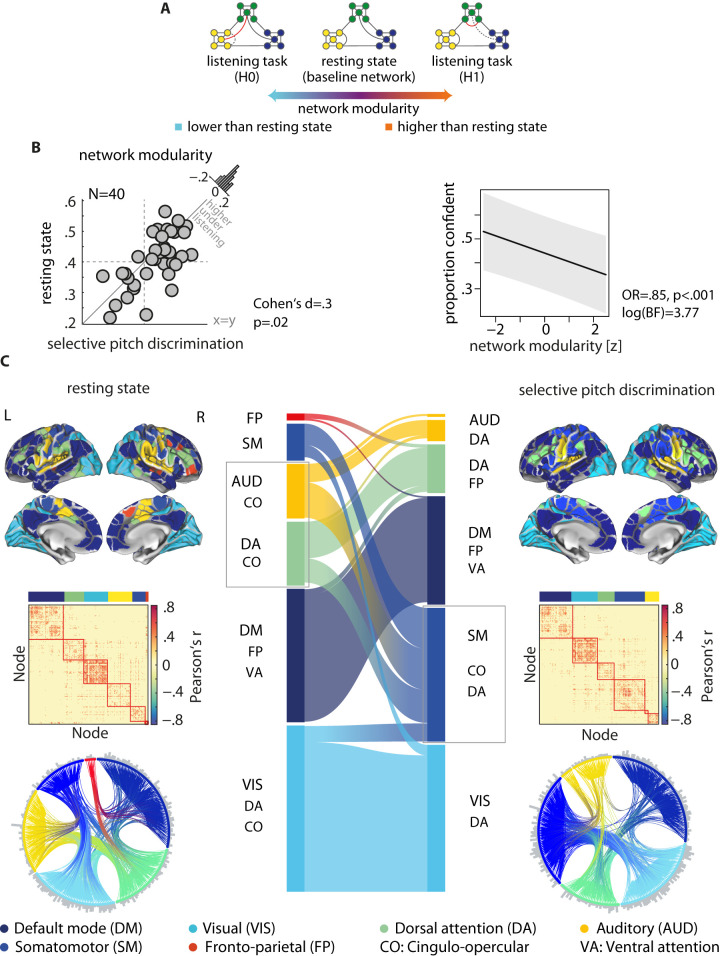
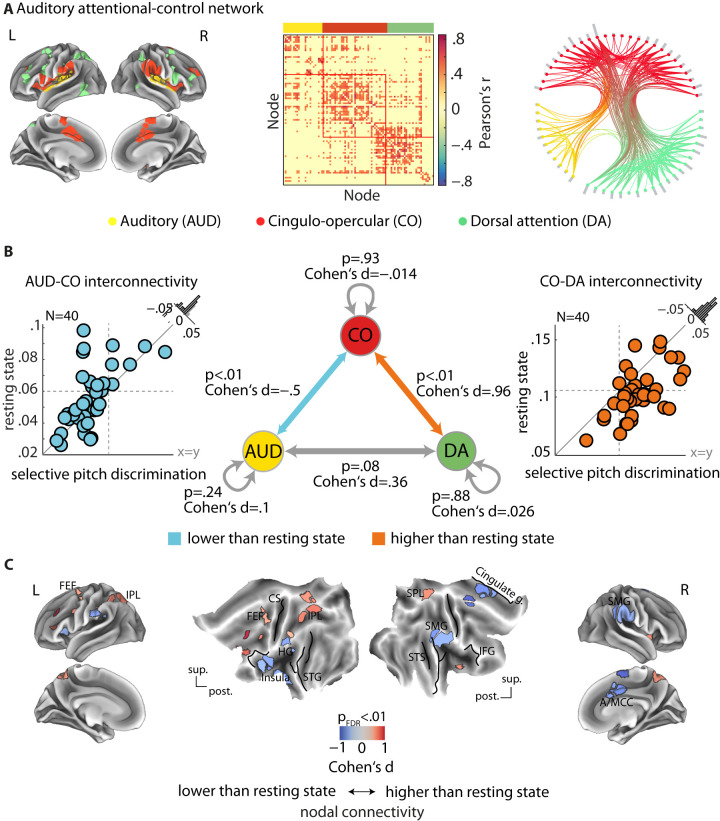
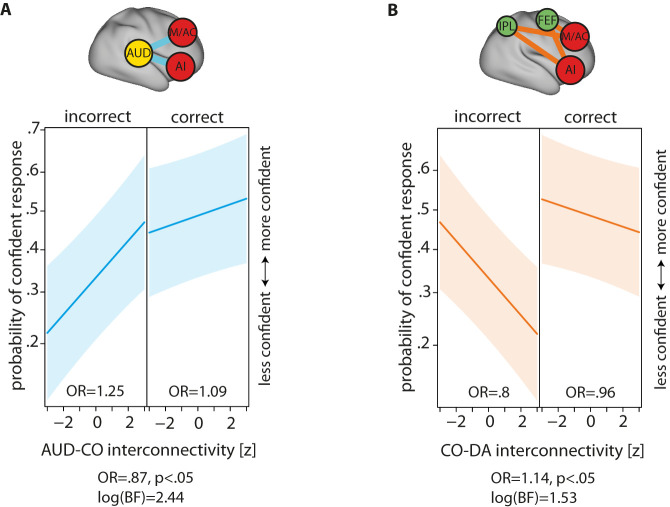
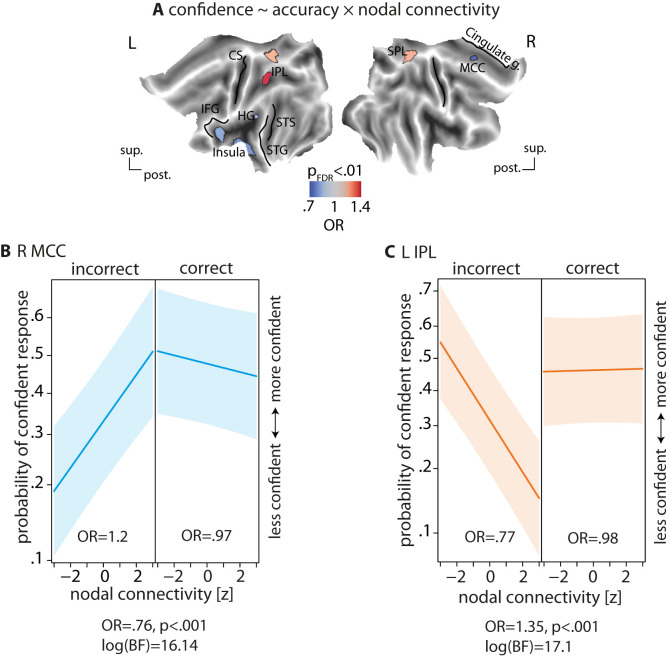
Complex auditory scenes pose a challenge to attentive listening, rendering listeners slower and more uncertain in their perceptual decisions. How can we explain such behaviors from the dynamics of cortical networks that pertain to the control of listening behavior? We here follow up on the hypothesis that human adaptive perception in challenging listening situations is supported by modular reconfiguration of auditory-control networks in a sample of N = 40 participants (13 males) who underwent resting-state and task functional magnetic resonance imaging (fMRI). Individual titration of a spatial selective auditory attention task maintained an average accuracy of ∼70% but yielded considerable interindividual differences in listeners' response speed and reported confidence in their own perceptual decisions. Whole-brain network modularity increased from rest to task by reconfiguring auditory, cinguloopercular, and dorsal attention networks. Specifically, interconnectivity between the auditory network and cinguloopercular network decreased during the task relative to the resting state. Additionally, interconnectivity between the dorsal attention network and cinguloopercular network increased. These interconnectivity dynamics were predictive of individual differences in response confidence, the degree of which was more pronounced after incorrect judgments. Our findings uncover the behavioral relevance of functional cross talk between auditory and attentional-control networks during metacognitive assessment of one's own perception in challenging listening situations and suggest two functionally dissociable cortical networked systems that shape the considerable metacognitive differences between individuals in adaptive listening behavior.

Keywords: adaptive listening behavior; cinguloopercular network; confidence; dorsal attention network; fMRI; metacognitive differences.


Conflict of interest statement

The authors declare no competing financial interests.

Figures

Figure 1.
Figure 1.
Listening paradigm and individuals’ behavior. A, Functional MRI experiment. Following a 10 min eyes-open resting state, participants performed six blocks of purely auditory selective pitch discrimination task. During the task, two competing tone sequences were presented using in-ear headphones. The virtual spatialization of sounds was achieved using individually selected head-related transfer functions (HRTFs). One tone sequence was always presented at front and the other was switched between left and right over task blocks (left/right order randomized across participants). Each trial started by presentation of a broadband auditory cue (0–10 kHz; 0.5 s) followed by a jittered silent interval. Next, two tone sequences, each consisting of two brief (0.5 s) complex tones, were presented at different locations (front, left, or right). Fundamental frequencies of low-frequency tones within each sequence were fixed at 177 and 267 Hz. Frequencies of high-frequency tones were titrated throughout the experiment (Δf0: tracking parameter). Participants had to judge whether the target tone sequence at the cued location had increased or decreased in pitch. Participants also reported their confidence in their own decision (high: outer buttons; low: inner buttons). B, Individuals’ listening behavior. Listeners’ behavior was measured both objectively and subjectively using response accuracy, speed (i.e., inverse response time; 1/RT), and confidence rating. Individuals showed considerable variability in their listening behavior, notably in response speed and confidence. C, Prediction of single-trial response confidence and speed from accuracy. Listeners were more confident and faster in their responses on correct trials as compared with incorrect trials (linear mixed-effects models with single-trial accuracy as a binary predictor). Box plots. The central line indicates the median, and the bottom and top edges of the box indicate the 25th and 75th percentiles, respectively. The whiskers extend to the most extreme data points not considered outliers. The outliers are marked by “+” symbol. Individual data. The central solid circle indicates the mean.
Figure 2.
Figure 2.
Analysis steps through which artifact-clean mean regional BOLD signals were recovered per cortical parcel. The results were used to construct graph-theoretical model of the whole-brain network during resting state and the listening task. Each step required publicly available toolboxes which are indicated in blue text.
Figure 3.
Figure 3.
Reconfiguration of whole-brain network under the listening task relative to resting state. A, Two possible network reconfigurations (i.e., left/right toy graphs compared with middle graph). Higher functional segregation is characterized by an increase in network modularity, a measure that quantifies grouping of nodes into relatively dense subsystems (here shown in distinct colors), which are sparsely interconnected. Toward higher functional segregation, the hypothetical baseline network loses the shortcut between the blue and green module (dashed link). Instead, within the green module, a new connection emerges (red link). B, During the listening task, network modularity significantly increased (left plot), the degree of which predicted lower proportion of confident responses across listeners (right plot). Histograms show the distribution of the change (task minus rest) across all 40 listeners. C, Whole-brain resting-state network decomposed into distinct modules shown in different colors. The network modules are visualized on the cortical surface, within the functional connectivity matrix, and on the connectogram using a consistent color scheme. Modules are identified according to their node labels as in Gordon parcellation. Group-level modularity partition was obtained using graph-theoretical consensus community detection. Gray peripheral bars around the connectograms indicate the number of connections per node. Flow diagram in the middle illustrates the reconfiguration of brain network modules from resting state (left) to the listening task (right). Modules are shown in vertical boxes with their heights corresponding to their connection densities. The streamlines illustrate how nodes belonging to a given module during resting state change their module membership under the listening task.
Figure 4.
Figure 4.
Modulation of connectivity across auditory and attentional-control networks. A, The auditory attentional-control network composed of auditory (AUD), cinguloopercular (CO), and dorsal attention (DA) nodes. Nodes are identified according to their labels in Gordon parcellation. The correlation structure and connection pattern across these nodes are illustrated by group-level functional connectivity matrix and the connectogram (circular diagram), respectively. Gray peripheral bars around the connectogram indicate the number of connections per node. B, Modulation of cinguloopercular connectivity with auditory and dorsal attention networks during the listening task. From rest to task, AUD–CO mean interconnectivity decreased (left plot), whereas CO–DA interconnectivity increased (right plot). Mean connectivity across nodes within each network or between auditory and dorsal attention networks did not change significantly (middle graph, gray arrows). Histograms show the distribution of the change (task minus rest) across all 40 participants. C, Modulation of nodal connectivity across the auditory attentional-control network. Nodal connectivity (also known as strength) was quantified as the sum of correlation values per node. The result was compared between task and rest per node using paired permutation tests and corrected for multiple comparison across nodes (FDR correction at significance threshold 0.01). Nodes exhibiting significant decrease in their connectivity during the listening task overlapped with the bilateral supramarginal gyri (SMG), the left anterior insula, and the anterior/middle cingulate cortices (A/MCC). Nodes showing significant increase in their connectivity overlapped with the superior parietal/intraparietal lobule (SPL/IPL) and the frontal eye fields (FEF). CS, central sulcus; HG, Heschl gyrus; IFG, inferior frontal gyrus; STG/S, superior temporal gyrus/sulcus.
Figure 5.
Figure 5.
Prediction of individual listening confidence from interconnectivity dynamics of auditory attentional-control network. A, Prediction of single-trial response confidence from mean AUD–CO interconnectivity during the selective pitch discrimination task. Across listeners, lower AUD–CO interconnectivity predicted less confident responses during the task, the degree of which was more pronounced during incorrect judgments compared with correct ones. B, Prediction of single-trial response confidence from mean CO–DA interconnectivity. Across listeners, higher CO–DA interconnectivity predicted less confident responses during the task, the degree of which was stronger during incorrect judgments compared with correct ones. Experimental variables including single-trial pitch differences, congruency of tone pairs, and location of spatial cue have been accounted for in the models. Shaded areas show two-sided parametric 95% CI. OR, odds ratio parameter estimates from generalized linear mixed-effects model; AI, anterior insula; FEF, frontal eye fields; IPL, inferior parietal lobule; M/AC, mid-/anterior cingulate.
Figure 6.
Figure 6.
Prediction of individual listening confidence from nodal connectivity of the auditory attentional-control network. A, Interaction between response accuracy and nodal connectivity in predicting single-trial confidence using generalized linear mixed-effects models. Experimental variables including single-trial pitch differences, congruency of tone pairs, and location of spatial cue have been accounted for in the models. The models were tested for each node of the auditory attentional-control network. The p values obtained for the interaction term were corrected for multiple comparisons across nodes (FDR correction at significance threshold 0.01). Two sets of nodes showed significant interactions: regions near the HG, the AI, and the MCC showed odds ratios smaller than one (indicating a more positive slope during incorrect than correct judgments), and regions overlapping with the superior/inferior parietal lobules (SPL/IPL) showed odds ratios larger than one (indicating a more negative slope during incorrect than correct judgments). B, To illustrate, resolving the interaction found at the right MCC indicated that lower connectivity of this node predicted lower confidence following incorrect judgments. C, Resolving the interaction found at the left IPL indicated that higher connectivity of this node predicted lower confidence following incorrect trials. Shaded areas show two-sided parametric 95% CI. OR, odds ratio parameter estimates from generalized linear mixed-effects model; CS, central sulcus; HG, Heschl gyrus; IFG, inferior frontal gyrus; STG/S, superior temporal gyrus/sulcus.
Figure 7.
Figure 7.
Group-level activation maps of task events. To derive individual estimates of cortical activity in response to different task events, an activation analysis using univariate general linear models (GLMs) was conducted and individual statistical parametric maps were obtained. The GLM model was estimated per cortical node of the parcellation used for connectivity analysis. The design matrix included the following regressors: cue left, cue right, cue front, concurrent tones (modeled as 1 s epoch), and button press. The onset of these events in milliseconds was convolved with canonical hemodynamic response function (HRF) with temporal resolution of 1 ms, and the results were downsampled to one TR (i.e., 1 s). These regressors were used to predict the same nodal time series used for connectivity analysis, i.e., the mean BOLD time series recovered following nuisance regression and bandpass filtering per node. Finally, group-average statistical maps were obtained by submitting the beta estimates to one-sided t tests (against implicit baseline) per node, and the results were thresholded at p < 0.01 following correction for multiple comparisons across nodes using family-wise error correction (FEW) procedure. The resulting corrected maps are visualized for different conditions in (A) cue left, (B) cue right, (C) cue front, and (D) concurrent tone presentation. None of the differential contrasts across the cue conditions, i.e., left versus right or left/right versus front, survived the significance threshold.

Similar articles

Cited by

References

    1. Abraham A, Pedregosa F, Eickenberg M, Gervais P, Mueller A, Kossaifi J, Gramfort A, Thirion B, Varoquaux G (2014) Machine learning for neuroimaging with scikit-learn. Front Neuroinform 8:14. 10.3389/fninf.2014.00014 - DOI - PMC - PubMed
    1. Ais J, Zylberberg A, Barttfeld P, Sigman M (2016) Individual consistency in the accuracy and distribution of confidence judgments. Cognition 146:377–386. 10.1016/j.cognition.2015.10.006 - DOI - PubMed
    1. Alavash M, Daube C, Wöstmann M, Brandmeyer A, Obleser J (2017) Large-scale network dynamics of beta-band oscillations underlie auditory perceptual decision-making. Netw Neurosci 1:166–191. 10.1162/NETN_a_00009 - DOI - PMC - PubMed
    1. Alavash M, Doebler P, Holling H, Thiel CM, Giessing C (2015a) Is functional integration of resting state brain networks an unspecific biomarker for working memory performance? Neuroimage 108:182–193. 10.1016/j.neuroimage.2014.12.046 - DOI - PubMed
    1. Alavash M, Hilgetag CC, Thiel CM, Giessing C (2015b) Persistency and flexibility of complex brain networks underlie dual-task interference. Hum Brain Mapp 36:3542–3562. 10.1002/hbm.22861 - DOI - PMC - PubMed

LinkOut - more resources