

Prediction of Follicular Thyroid Neoplasm and Malignancy of Follicular Thyroid Neoplasm Using Multiparametric MRI
- PMID: 38839672
- PMCID: PMC11612114
- DOI: 10.1007/s10278-024-01102-0
Prediction of Follicular Thyroid Neoplasm and Malignancy of Follicular Thyroid Neoplasm Using Multiparametric MRI
Abstract
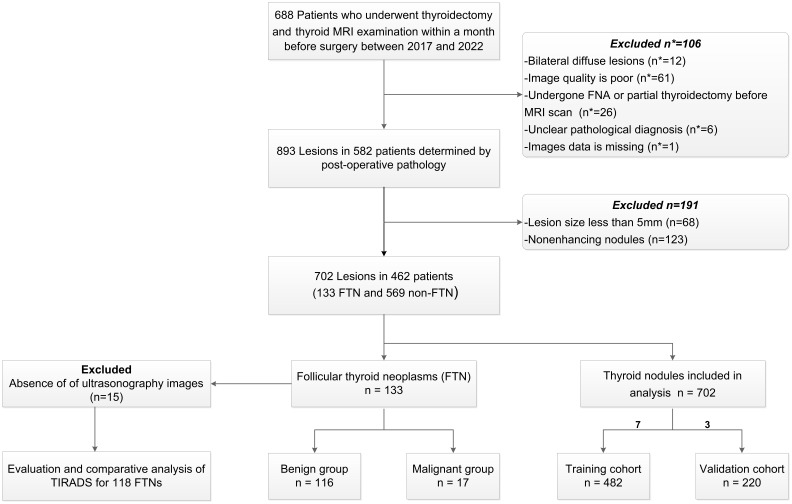
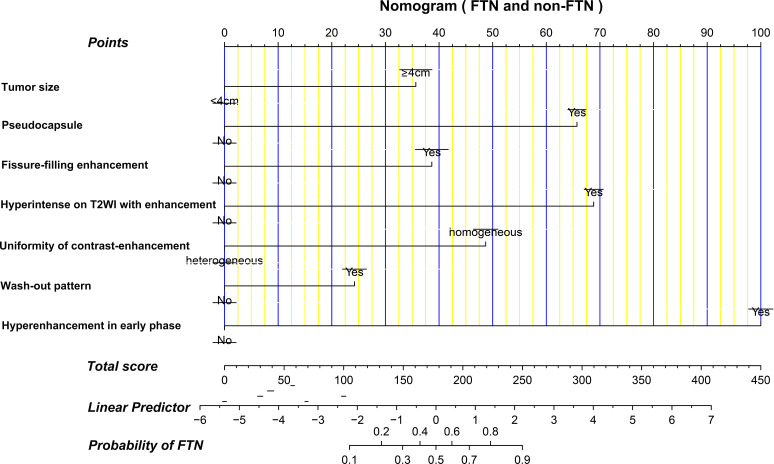
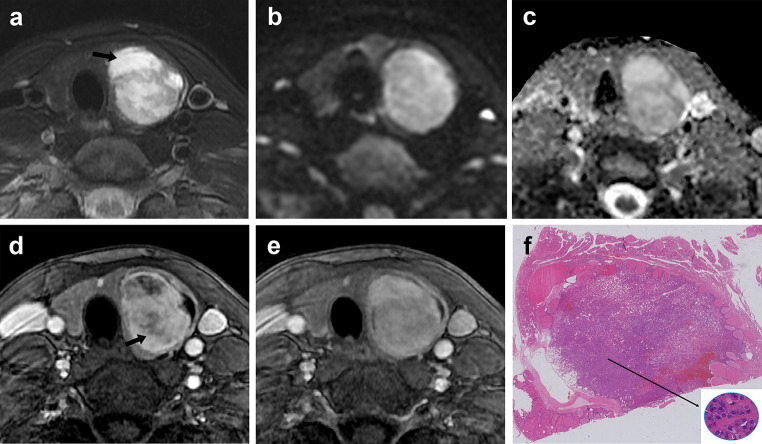
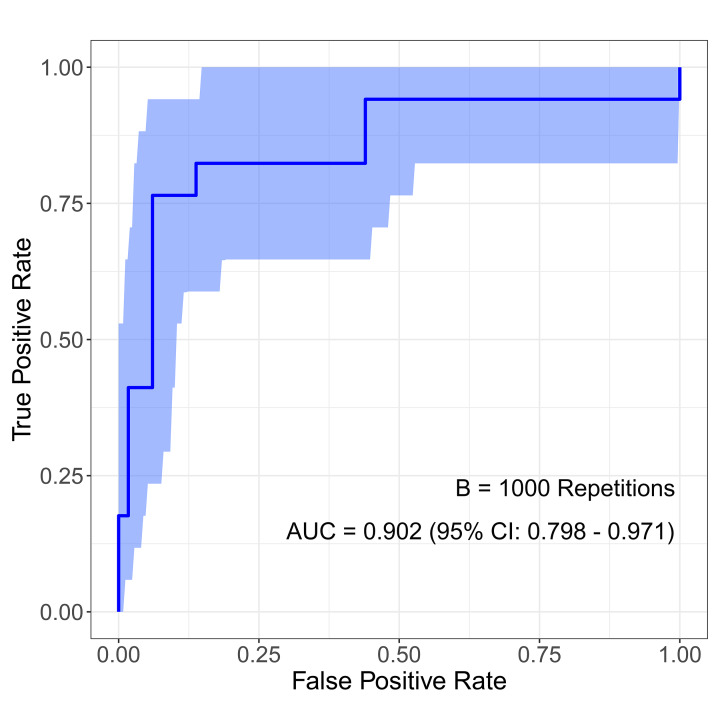
The study aims to evaluate multiparametric magnetic resonance imaging (MRI) for differentiating Follicular thyroid neoplasm (FTN) from non-FTN and malignant FTN (MFTN) from benign FTN (BFTN). We retrospectively analyzed 702 postoperatively confirmed thyroid nodules, and divided them into training (n = 482) and validation (n = 220) cohorts. The 133 FTNs were further split into BFTN (n = 116) and MFTN (n = 17) groups. Employing univariate and multivariate logistic regression, we identified independent predictors of FTN and MFTN, and subsequently develop a nomogram for FTN and a risk score system (RSS) for MFTN prediction. We assessed performance of nomogram through its discrimination, calibration, and clinical utility. The diagnostic performance of the RSS for MFTN was further compared with the performance of the Thyroid Imaging Reporting and Data System (TIRADS). The nomogram, integrating independent predictors, demonstrated robust discrimination and calibration in differentiating FTN from non-FTN in both training cohort (AUC = 0.947, Hosmer-Lemeshow P = 0.698) and validation cohort (AUC = 0.927, Hosmer-Lemeshow P = 0.088). Key risk factors for differentiating MFTN from BFTN included tumor size, restricted diffusion, and cystic degeneration. The AUC of the RSS for MFTN prediction was 0.902 (95% CI 0.798-0.971), outperforming five TIRADS with a sensitivity of 73.3%, specificity of 95.1%, accuracy of 92.4%, and positive and negative predictive values of 68.8% and 96.1%, respectively, at the optimal cutoff. MRI-based models demonstrate excellent diagnostic performance for preoperative predicting of FTN and MFTN, potentially guiding clinicians in optimizing therapeutic decision-making.
Keywords: Follicular neoplasm; Multiparametric MRI; Nomogram; Preoperative assessment; Thyroid.
© 2024. The Author(s).
Conflict of interest statement
Declarations. Ethics Approval: The institutional review board of Minhang hospital, Fudan University approved this study. Consent to Participate: Informed consent was exempted due to the retrospective nature. Consent to Publish: Informed consent was waived because it was a retrospective study and the images we used did not include personal information. Competing Interests: The authors declare that they have no competing interests.
Figures


Similar articles
-
New Thyroid Imaging Reporting and Data System (TIRADS) Based on Ultrasonography Features for Follicular Thyroid Neoplasms: A Multicenter Study.Ultrasound Med Biol. 2025 Aug;51(8):1343-1351. doi: 10.1016/j.ultrasmedbio.2025.05.004. Epub 2025 May 31. Ultrasound Med Biol. 2025. PMID: 40451671
-
Interpretable Machine Learning to Predict the Malignancy Risk of Follicular Thyroid Neoplasms in Extremely Unbalanced Data: Retrospective Cohort Study and Literature Review.JMIR Cancer. 2025 Feb 10;11:e66269. doi: 10.2196/66269. JMIR Cancer. 2025. PMID: 39930991 Free PMC article. Review.
-
A nomogram for predicting malignancy in thyroid nodules diagnosed as atypia of undetermined significance/follicular lesions of undetermined significance on fine needle aspiration.Surgery. 2014 Jun;155(6):1006-13. doi: 10.1016/j.surg.2013.12.035. Epub 2014 Jan 3. Surgery. 2014. PMID: 24630147
-
Multimodal ultrasound radiomics model combined with clinical model for differentiating follicular thyroid adenoma from carcinoma.BMC Med Imaging. 2025 May 5;25(1):152. doi: 10.1186/s12880-025-01685-2. BMC Med Imaging. 2025. PMID: 40325381 Free PMC article.
-
Diagnostic Efficiency of ACR-TIRADS Score for Differentiating Benign and Malignant Thyroid Nodules of Various Pathological Types.Med Sci Monit. 2024 May 20;30:e943228. doi: 10.12659/MSM.943228. Med Sci Monit. 2024. PMID: 38764217 Free PMC article.
Cited by
-
Routine Blood Tests as Predictive Tools for Differentiating Follicular Thyroid Carcinoma From Follicular Adenoma.Int J Gen Med. 2025 Feb 12;18:733-744. doi: 10.2147/IJGM.S502626. eCollection 2025. Int J Gen Med. 2025. PMID: 39963518 Free PMC article.
-
MRI-based model to predict preoperative extrathyroidal extension in papillary thyroid carcinoma.Eur Radiol. 2025 May 18. doi: 10.1007/s00330-025-11684-0. Online ahead of print. Eur Radiol. 2025. PMID: 40382730
References
-
- Angell TE: RAS-positive thyroid nodules. Current opinion in endocrinology, diabetes, and obesity 24:372–376, 2017 - PubMed
-
- Ito Y, et al.: Clinical outcomes of follicular tumor of uncertain malignant potential of the thyroid: real-world data. Endocr J 69:757–761, 2022 - PubMed
-
- Machens A, Lorenz K, Weber F, Dralle H: Risk Patterns of Distant Metastases in Follicular, Papillary and Medullary Thyroid Cancer. Hormone and metabolic research = Hormon- und Stoffwechselforschung = Hormones et metabolisme 54:7–11, 2022 - PubMed
MeSH terms
Grants and funding
LinkOut - more resources
Full Text Sources
Medical