

Development of Neighborhood Trajectories Employing Historic Redlining and the Area Deprivation Index
- PMID: 38839733
- PMCID: PMC11190128
- DOI: 10.1007/s11524-024-00883-7
Development of Neighborhood Trajectories Employing Historic Redlining and the Area Deprivation Index
Abstract
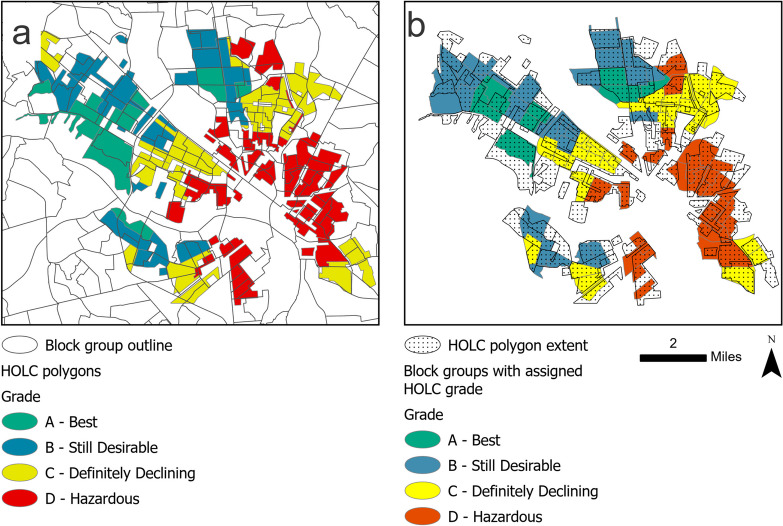
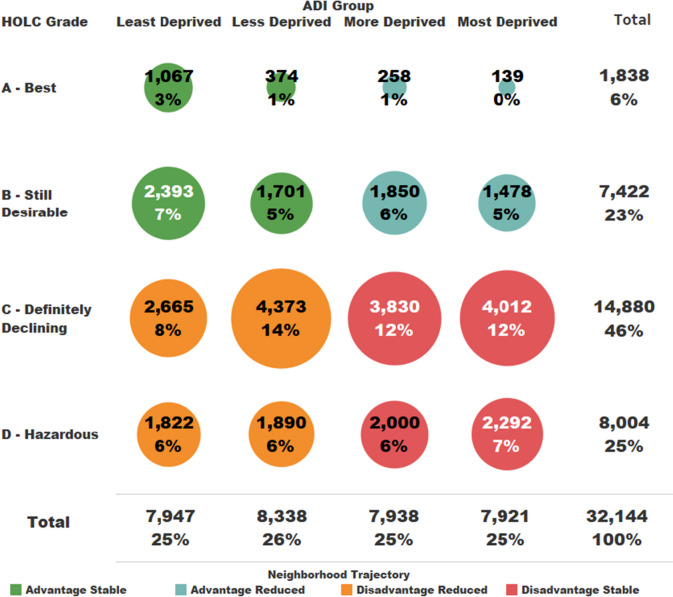
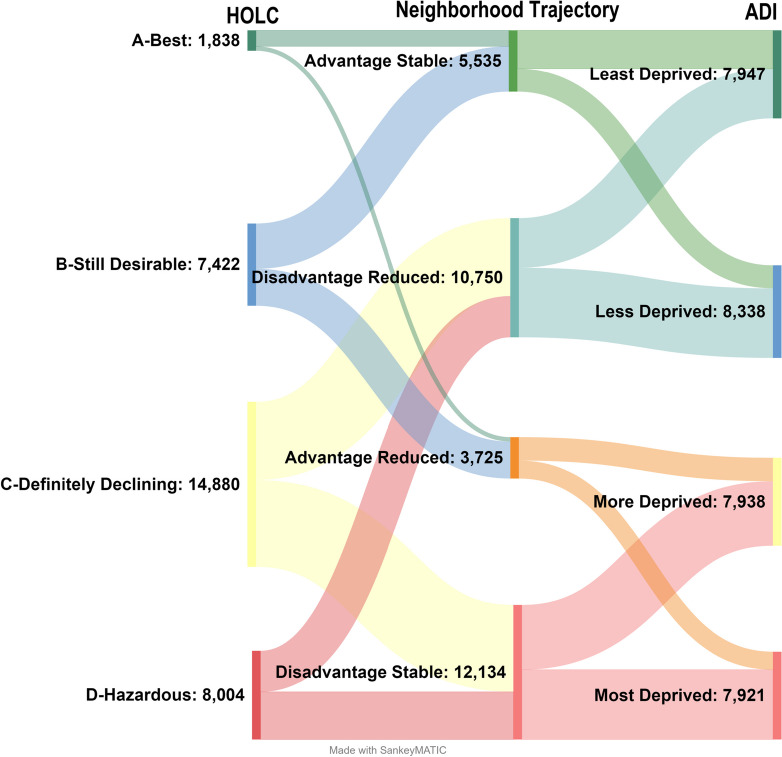
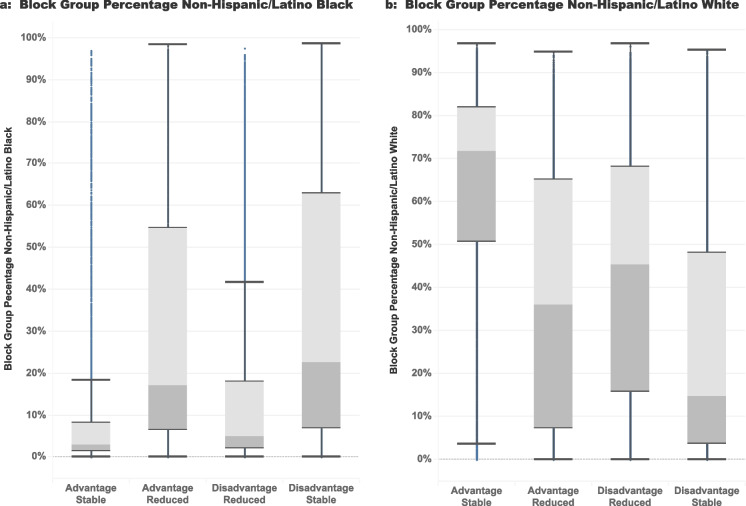
The role of historic residential redlining on health inequities is intertwined with policy changes made before and after the 1930s that influence current neighborhood characteristics and shape ongoing structural racism in the United States (U.S.). We developed Neighborhood Trajectories which combine historic redlining data and the current neighborhood socioeconomic characteristics as a novel approach to studying structural racism. Home Owners' Loan Corporation (HOLC) neighborhoods for the entire U.S. were used to map the HOLC grades to the 2020 U.S. Census block group polygons based on the percentage of HOLC areas in each block group. Each block group was also assigned an Area Deprivation Index (ADI) from the Neighborhood Atlas®. To evaluate changes in neighborhoods from historic HOLC grades to present degree of deprivation, we aggregated block groups into "Neighborhood Trajectories" using historic HOLC grades and current ADI. The Neighborhood Trajectories are "Advantage Stable"; "Advantage Reduced"; "Disadvantage Reduced"; and "Disadvantage Stable." Neighborhood Trajectories were established for 13.3% (32,152) of the block groups in the U.S., encompassing 38,005,799 people. Overall, the Disadvantage-Reduced trajectory had the largest population (16,307,217 people). However, the largest percentage of non-Hispanic/Latino Black residents (34%) fell in the Advantage-Reduced trajectory, while the largest percentage of Non-Hispanic/Latino White residents (60%) fell in the Advantage-Stable trajectory. The development of the Neighborhood Trajectories affords a more nuanced mechanism to investigate dynamic processes from historic policy, socioeconomic development, and ongoing marginalization. This adaptable methodology may enable investigation of ongoing sociopolitical processes including gentrification of neighborhoods (Disadvantage-Reduced trajectory) and "White flight" (Advantage Reduced trajectory).
Keywords: Area Deprivation Index; Neighborhood Trajectory; Redlining; Structural Racism.
© 2024. The New York Academy of Medicine.
Figures

Update of
-
Development of Neighborhood Trajectories employing Historic Redlining and the Area Deprivation Index.Res Sq [Preprint]. 2023 Dec 22:rs.3.rs-3783331. doi: 10.21203/rs.3.rs-3783331/v1. Res Sq. 2023. Update in: J Urban Health. 2024 Jun;101(3):473-482. doi: 10.1007/s11524-024-00883-7. PMID: 38196649 Free PMC article. Updated. Preprint.
References
-
- Cha-Jua SK, Lang C. The “Long Movement” as vampire: temporal and spatial fallacies in recent Black freedom studies. J Afr Am Hist. 2007;92(2):265–288.
MeSH terms
Grants and funding
LinkOut - more resources
Full Text Sources
