. 2024 Jun 5;15(1):4782.
doi: 10.1038/s41467-024-49129-9.

Coexistence of state, choice, and sensory integration coding in barrel cortex LII/III

Affiliations

Coexistence of state, choice, and sensory integration coding in barrel cortex LII/III

Pierre-Marie Gardères et al. Nat Commun. .

Abstract

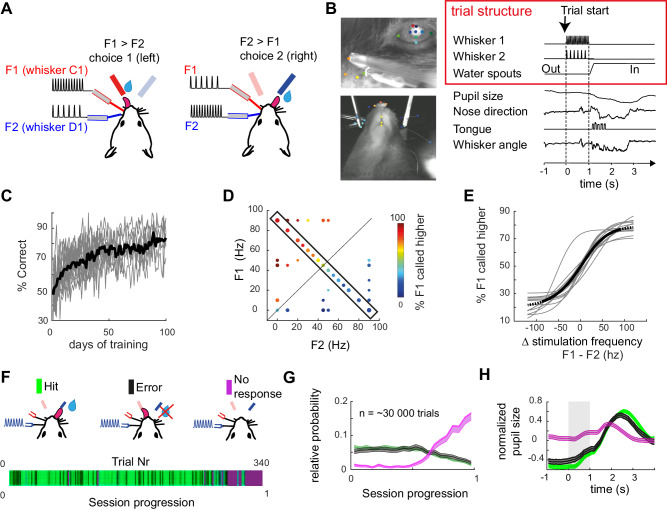
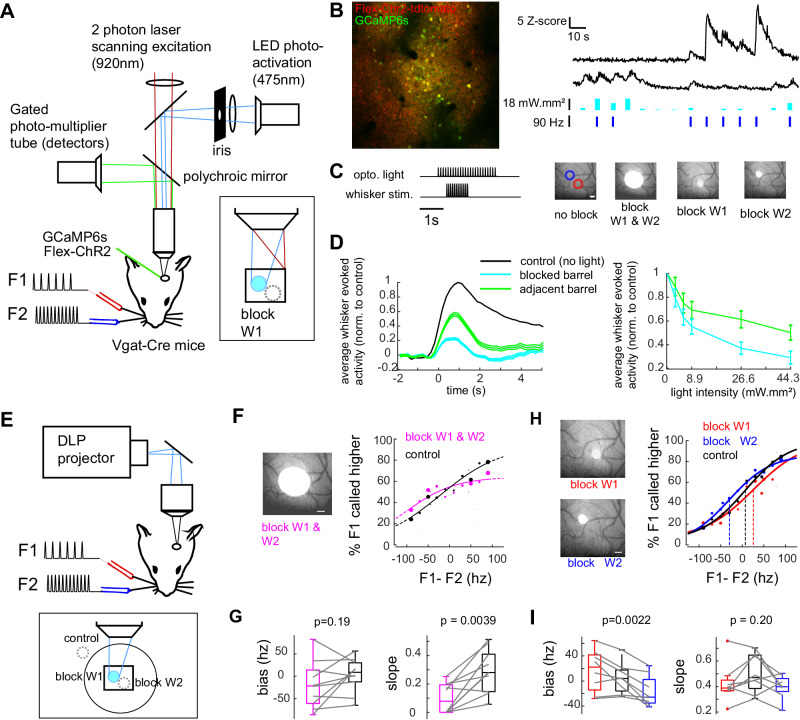
During perceptually guided decisions, correlates of choice are found as upstream as in the primary sensory areas. However, how well these choice signals align with early sensory representations, a prerequisite for their interpretation as feedforward substrates of perception, remains an open question. We designed a two alternative forced choice task (2AFC) in which male mice compared stimulation frequencies applied to two adjacent vibrissae. The optogenetic silencing of individual columns in the primary somatosensory cortex (wS1) resulted in predicted shifts of psychometric functions, demonstrating that perception depends on focal, early sensory representations. Functional imaging of layer II/III single neurons revealed mixed coding of stimuli, choices and engagement in the task. Neurons with multi-whisker suppression display improved sensory discrimination and had their activity increased during engagement in the task, enhancing selectively representation of the signals relevant to solving the task. From trial to trial, representation of stimuli and choice varied substantially, but mostly orthogonally to each other, suggesting that perceptual variability does not originate from wS1 fluctuations but rather from downstream areas. Together, our results highlight the role of primary sensory areas in forming a reliable sensory substrate that could be used for flexible downstream decision processes.


Conflict of interest statement

The authors declare no competing interests.

Figures

Fig. 1
Fig. 1. Performance and behavior during discrimination of simultaneous vibrotactile stimulation applied to adjacent whiskers.
A Schematic of the task. left: W1 whisker is deflected with higher frequency than W2, left licks trigger a reward delivery. Right: F2 > F1, licks to the right trigger a reward delivery. B Face tracking and trial structure. Left: two example views simultaneously recorded. Some face parts are tracked using DeepLabCut (ref. ) and are labeled with random colors (see methods). Right: trial time structure with example face tracking (downsampled to 30 Hz). Waterspouts come in a reachable position at the end of the whisker stimulation. Scales are normalized between minimum and maximum amplitudes. C Learning curves of 15 individual mice. Calcium imaging and further analysis were carried out on a subset of sessions after the animal was considered expert (reached >70% Correct trials). D Behavioral performance in the stimulus space. Each point represents a set of two frequencies applied to the two whiskers. The diagonal represents the task boundary (F1 = F2). E Psychometric function drawn from conditions within the rectangle in D (i.e., with a constant summed frequency F1 + F2 = 90 Hz). Traces are psychometric fits for individual animals (see methods). The black thick line represents average fit. F Three possible behavioral outcomes in one example session. Top: 3 possible behavioral outcomes: first lick right, first lick left, and no lick during the response window. Bottom: example session with behavioral outcome color coded. The trial index is a normalization of trial number between 0 and 1 (respectively first to last trial of the session). G Relative distribution of hits, errors, and misses within the daily session progression (average across sessions and mice), normalized by category represented as mean values ± s.e.m. Misses typically appeared in blocks at the end of the session. H Normalized pupil size in the pre-stimulus period predicts engagement of the subject; represented as mean values ± s.e.m.
Fig. 2
Fig. 2. Activity levels in neighboring cortical columns increase with stimulation frequencies of their preferred whisker.
A Simultaneous Imaging of W1 and W2 cortical representations in wS1 L2/3. Left: Contralateral recording in the head-fixed mouse. Middle: Example Intrinsic optical imaging (6 replications with similar results). Right: Example Ca2+ imaging field of view (FOV) spanning the two barrels; blue circles indicate example ROIs for which calcium transients are depicted in (D). B Five example neurons fluorescence (black) and deconvolved firing rate traces (blue). C Response to single whisker stimulation at 90 Hz (W1 and W2, top and bottom rows respectively). Left: pixel-wise change in fluorescence Δf/f0 is color-coded. Right: average FR of each neuron in response to single whisker stimuli. Neurons are sorted by increasing FR1 - FR2, with FR1 and FR2 representing firing rate during 90 Hz stimulation of W1 and W2. Same sorting order in top and bottom plots. D All neurons aligned to the mid-points between cortical columns. Selectivity index (SI) is represented by color and the average FR is represented as dot size. SI = (FR1 + FR2)/ (FR1 - FR2). E Inhibitory versus excitatory response to whisker stimulation. Top: Example FOV of a VGAT-cre mice. Cortical column centers are marked by a cross. Bottom: SI for INs and putative ENs (n = 267 and 974 neurons, respectively, from three animals). SI are represented as mean ± CI95 across neurons in bins of 50 µm. F Population average FR in response to increasing single whisker stimulation frequency. Error shades represent s.e.m. across FOVs, n = 11 FOV from seven animals. G Average FR of the principal whisker (PW) population and adjacent whisker (AW) population in response to single and multi-whisker stimulation. The statistical test represents the increase or decrease of population activity with the stimulation frequency of the PW alone (left) or AW while PW is held to 90 Hz stimulation (right). ***p < 0.001 (LME model test). N = 18 columns from 9 FOV. FR is represented as mean ± CI95 across columns. Figure 2A left panel is adapted from C S Barz, P M Garderes, D A Ganea, S Reischauer, D Feldmeyer, F Haiss, Functional and structural properties of highly responsive somatosensory neurons in mouse barrel cortex, Cerebral Cortex, Volume 31, Issue 10, October 2021, Pages 4533–4553, 10.1093/cercor/bhab104 and released under a Creative Commons CC-BY-NC license: https://creativecommons.org/licenses/by-nc/4.0/.
Fig. 3
Fig. 3. Differential optogenetic inhibition of a single barrel induces selective shifts in perception.
A Setup for combined optogenetic and calcium imaging (see methods). B Left: Example FOV of one VGAT-cre animal expressing GCaMP6s and ChR2. Right: example fluorescence transients in response to whisker and light stimulation for a putative excitatory neuron (top) and a putative inhibitory neuron (bottom). Light and whisker stimulation amplitude are indicated below. C Optogenetic stimulation parameters. Left: Trial structure. Right: Light patterns, from left to right: - no block (W1 and W2 columns are illustrated as 200 µm diameter circles); - Illumination of the two columns (450 µm diameter disk, FWHM); - selective illumination of W1 column (105 µm diameter disk, FWHM); - selective illumination of W2 column. D Impact of selective inhibition (105 µm diameter disk) onto targeted and adjacent barrels evoked response (n = 901 neurons from three animals), during 90 Hz stimulation of the preferred whisker. Inhibitory neurons and non-whisker responsive neurons were excluded from the analysis (see details in the methods). Left: time course of whisker evoked response. Right: mean residual activity across different optogenetic light intensities. Data were represented as mean values ± CI95. E Setup for optogenetic during behavior. A DLP projector was used to display light patterns on the cortex. F Non-selective barrel inhibition. Psychometric fit during intermingled trials with either sham optogenetic (black) and 450 µm diameter disk optogenetic blocking (magenta). G Psychometric slope and bias quantification during non-selective column inhibition Friedman test, n = 10 mice. H Selective barrel inhibition. psychometric fit during intermingled trials with either inhibition of the W1 barrel (red), inhibition of the W2 barrel (blue), or sham control (black). Data pooled from eight mice. I Psychometric slope and bias quantification during selective column inhibition. In FI, Optogenetic trials were paired with the closest occurring sham control trial having the same stimulation frequencies. Trials were matched for all statistical analysis and psychometric fits. Friedman test, n = 8 mice.
Fig. 4
Fig. 4. Multi-whisker suppression improves frequency comparison performance in the stimulus space.
A Linear regression of single-neuron activity on whisker stimulation frequencies. Top row: Example regression of one neuron in 20 trials (see text and methods). Bottom left: fraction of explained variance across neurons. Bottom right: fraction of variance explained by each regressor (average over n = 3706 neurons), relative to the total variance explained by the model. B Cell by cell distribution of model weight. Note the positive correlation between single whisker weights (left) and the negative correlation between single and interaction weights (right). CE Three example neurons (left to right columns) showing different forms of multi-whisker integration. C Average firing rate during three stimulation conditions: stimulation at 45 Hz of W1 only (red), of W2 only (blue), or of W1 and W2 together (green). D Activity level in the stimulus space, measured as FR and represented by the size of the solid circle. E Bottom row, activity level in the stimulus space, fitted with the model in (A). The best threshold boundary (red line) maximizes discrimination of the target F1 > F2 over the stimulus space. Discrimination is measured as the area under the curve (AUC) using receiver operating characteristic analysis (ROC). Note that multi-whisker suppression (example neuron 2) increases discriminability compared to no suppression (example neuron 1).
Fig. 5
Fig. 5. Weighted population averages display reliable frequency categorization across behavioral outcomes.
A Sensory evidence pooled in two subpopulations weighted averages Rw1 and Rw2. Neurons were split in two pools depending on their selectivity for W1 or W2. β weights are obtained directly from the single neuron linear model in Eq. (1). B Decoding of the target side (i.e., F1 > F2) from the difference Rw1–Rw2 with an increasing number of neurons in each pool. n = 11 FOVs from seven mice. C Neurometric and psychometric functions compared. Left: psychometric/neurometric curves Data were represented as mean values ± CI95 across n = 11 FOVs from seven mice. We decoded negative Rw2 (- Rw2), so neurometric curves are in the same direction. Right: Comparison of the fitted slope and lapse rate of the three psychometric/neurometric functions. D Neurometric function of Rw1 - Rw2 computed separately in trials with choice 1 or choice 2. not significant when testing sensitivity slope (p = 0.93), lapse rate (0.61) and bias (p = 0.26), n = 11 FOV (LME model test). Threshold for decoding were near zero (mean ± sem 5.5 × 10−4 ± 2.2 × 10−3). E Neurometric function of Rw1 - Rw2 for engaged (black) and disengaged (gray) trials. p > 0.05 when testing sensitivity slope (p = 0.09), lapse rate (p = 0.72) and bias (p = 0.20), n = 11 FOVs from 7 mice (LME model test). Threshold for decoding were near zero (mean ± sem 8.1 × 10−4 ± 2.7 × 10−3).
Fig. 6
Fig. 6. Sensory fluctuations in wS1 are not correlated with behavioral choices.
A Target side discriminability (i.e., F1 > F2 versus F2 < F1). left; AUROC distribution of all neurons (n = 3118) right: AUROC depends on selectivity. The population is split into 10 bins of increasing preferred whisker beta weight. Only trials with |ΔF | < = 30 Hz and no impulsive movements are included in the analysis. Data were represented as mean values ± CI95. B Response side discriminability (i.e., choice 1 versus 2). Left: AUROC choice distribution of all neurons, depending on their preferred whisker. Right: AUROC choice doesn’t depend on whisker selectivity. Population split as in (A). Data were represented as mean values ± CI95. C Top: model including choice 1 and choice 2 as regressor (respectively βC1 and βC2). Bottom: Model weights for sensory and choice selectivity are uncorrelated (Spearman r = −0.03; LME model test p > 0.05, n = 3706 neurons). D Choice coding evidence pooled into two subpopulations weighted averages Rc1 and Rc2. E Time course of choice and sensory information. Top: Earliest response time of the animals (from video analysis, see Fig. S2). Middle: target side decoding (F1 > F2 versus F2 > F1) from Rw1, Rw2, or Rw1-Rw2. Bottom: animal’s choice side decoding from Rc1, Rc2, or Rc1-Rc2. Matched number of Choice 1/Choice 2 trials in each stimulus condition. Error shades represent s.e.m. F Neural activity in the sensory and choice dimensions. Left: trials with F2 > F1 only. Right: trials with F1 > F2 only. The red arrow represents the transition from choice 1 to choice 2 trials (averages of neural activity across trials). θ is the angle between the x-axis and the transition arrow orientation. Fitted ellipses contain 80% of data points. Choices are best separated on the choice axis, and hardly on the sensory axis. G Breakdown of the representational angle for the different stimulation conditions. conditions with at least five FOVs and five trials per FOVs are included. Angles are represented as mean ± s.e.m. across FOVs n = 5 to 11 FOVs.
Fig. 7
Fig. 7. An orthogonal representation of engagement coexists with a selective gain for single whisker representation.
A Engagement-related pupillary contraction prior to stimulus onset. Right: Miss probability in ten deciles with increasing rank of pupil diameter (normalized per session). Data were represented as mean values ± CI95; n = 10,000 trials from five mice (LME model test). B Engagement decreases slow oscillations prior to stimulus onset. Left, spectral power density from one example neuropil, averaged over all trials. Right, Miss probability in ten deciles with increasing theta power density (normalized per session). Data are represented as mean values ± CI95. n = 30,440 trials from seven mice; (LME model test). C Top: model including engagement regressor (with weight βeng, see methods). Bottom: Model weights for sensory and engagement selectivity are uncorrelated (Spearman r = −0.05; LME model test p > 0.05, n = 3706 neurons from seven mice). D Decoding of engagement over time using. engaged/disengaged trials matched for stimulus condition. Data were represented as mean values ± s.e.m. E Neural activity in the sensory and engagement dimensions. Left: trials with F2 > F1 only. Right: trials with F1 > F2 only. The red arrow represents the transition from engaged to disengaged (averages of neural activity across trials). θ is the angle between the sensory x-axis and the transition arrow orientation. Fitted ellipses contain 80% of data points. Bottom Angles in different stimulation conditions are represented as mean ± s.e.m. across FOVs. n = 5 to 11 FOVs. F Engagement ratio of activityas a function of neuronal sensory weights. Computed in engaged/disengaged trials with matched stimulus conditions. The neuronal population of n = 3706 neurons is split into 10 equal bins of beta weights (βF1, βF2, or βF1xF2). Data were represented as mean values ± s.e.m. G Rw1, Rw2, and Rw1xw2 Engagement ratio over time. Rws are computed from independent pools of neurons. Data were represented as mean values ± s.e.m across n = 11 FOVs. H Quantification of engagement ratio during the stimulus period in (G). Statistical comparison across n = 11 FOVs. LME model post hoc test.
Fig. 8
Fig. 8. Graphical summary of the main findings.
A We developed a 2AFC task in which mice had to compare the intensity of stimulation of two adjacent whiskers. B This paradigm enables the manipulation and simultaneous recordings of two rival sensory alternatives during perceptual decision-making. C The optogenetic silencing of individual cortical columns resulted in predicted shifts of psychometric functions, linking the perception of a stimulus feature to its early sensory representations. D Combination of two whiskers stimulation results mostly in suppressive interactions, with only a small fraction of neurons showing strong supralinear responses. Suppressive interactions improved the decoding of the target whisker stimulation. E When the animal engages in the task, we observe a sensory gain (increased responsiveness) which correlates positively with whisker selectivity and negatively with supralinear interactions. Such engagement-dependent gain may selectively enhance the relevant stimulus features (here, whisker identity). F At the level of a large neuronal population, it appears that the coding of choice is independent of the coding of the two rival sensory alternatives. Thus, choice-related activity is represented orthogonally to the sensory representation. Generally, sensory encoding remains reliable across all behavioral outcomes. Figure 8A is adapted from C S Barz, P M Garderes, D A Ganea, S Reischauer, D Feldmeyer, F Haiss, Functional and structural properties of highly responsive somatosensory neurons in the mouse barrel cortex, Cerebral Cortex, Volume 31, Issue 10, October 2021, Pages 4533–4553, 10.1093/cercor/bhab104 and released under a Creative Commons CC-BY-NC license: https://creativecommons.org/licenses/by-nc/4.0/.

Similar articles

References

    1. Gold JI, Shadlen MN. The neural basis of decision making. Annu Rev. Neurosci. 2007;30:535–574. doi: 10.1146/annurev.neuro.29.051605.113038. - DOI - PubMed
    1. Hernández A, et al. Decoding a perceptual decision process across cortex. Neuron. 2010;66:300–314. doi: 10.1016/j.neuron.2010.03.031. - DOI - PubMed
    1. Siegel M, Buschman TJ, Miller EK. Cortical information flow during flexible sensorimotor decisions. Science. 2015;348:1352–1355. doi: 10.1126/science.aab0551. - DOI - PMC - PubMed
    1. Salzman CD, Britten KH, Newsome WT. Cortical microstimulation influences perceptual judgements of motion direction. Nature. 1990;346:174–177. doi: 10.1038/346174a0. - DOI - PubMed
    1. Britten KH, Newsome WT, Shadlen MN, Celebrini S, Movshon JA. A relationship between behavioral choice and the visual responses of neurons in macaque MT. Vis. Neurosci. 1996;13:87–100. doi: 10.1017/S095252380000715X. - DOI - PubMed