. 2024 Jun 5;15(1):4775.
doi: 10.1038/s41467-024-49049-8.

The manganese transporter SLC39A8 links alkaline ceramidase 1 to inflammatory bowel disease

Affiliations

The manganese transporter SLC39A8 links alkaline ceramidase 1 to inflammatory bowel disease

Eun-Kyung Choi et al. Nat Commun. .

Abstract

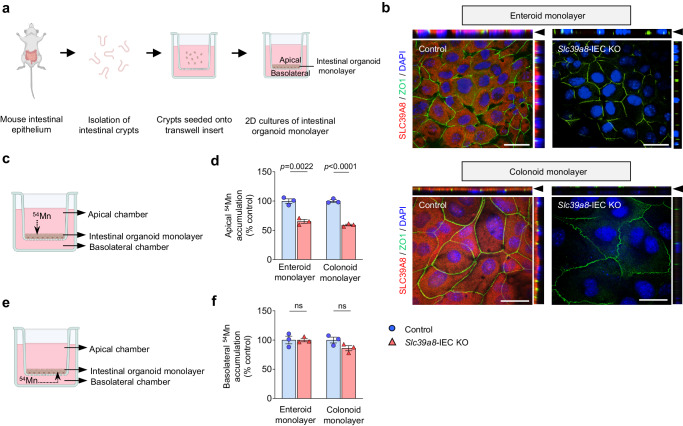
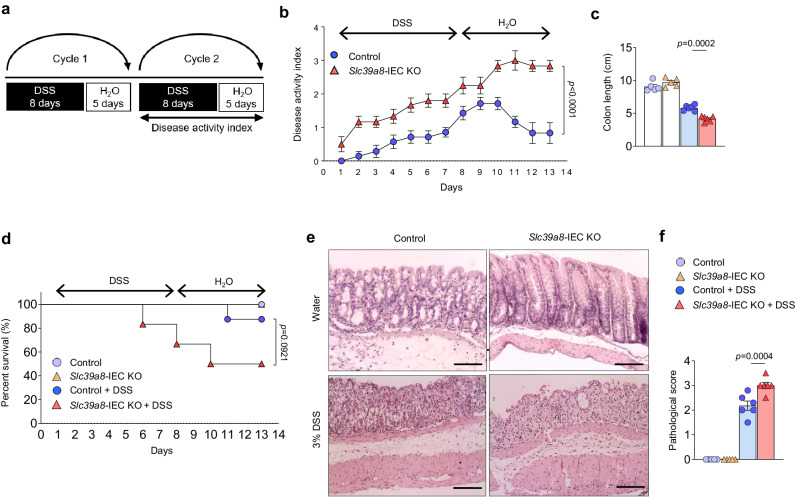
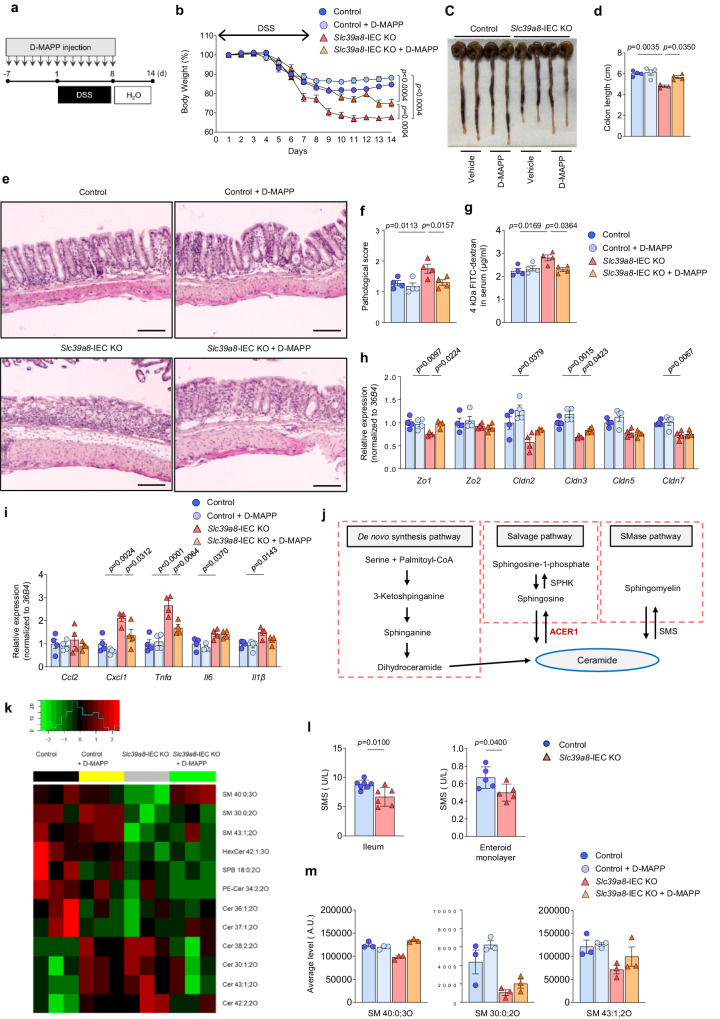
The metal ion transporter SLC39A8 is associated with physiological traits and diseases, including blood manganese (Mn) levels and inflammatory bowel diseases (IBD). The mechanisms by which SLC39A8 controls Mn homeostasis and epithelial integrity remain elusive. Here, we generate Slc39a8 intestinal epithelial cell-specific-knockout (Slc39a8-IEC KO) mice, which display markedly decreased Mn levels in blood and most organs. Radiotracer studies reveal impaired intestinal absorption of dietary Mn in Slc39a8-IEC KO mice. SLC39A8 is localized to the apical membrane and mediates 54Mn uptake in intestinal organoid monolayer cultures. Unbiased transcriptomic analysis identifies alkaline ceramidase 1 (ACER1), a key enzyme in sphingolipid metabolism, as a potential therapeutic target for SLC39A8-associated IBDs. Importantly, treatment with an ACER1 inhibitor attenuates colitis in Slc39a8-IEC KO mice by remedying barrier dysfunction. Our results highlight the essential roles of SLC39A8 in intestinal Mn absorption and epithelial integrity and offer a therapeutic target for IBD associated with impaired Mn homeostasis.


Conflict of interest statement

The authors declare no competing interests.

Figures

Fig. 1
Fig. 1. Intestinal epithelial Slc39a8 deletion leads to systemic Mn deficiency.
a qPCR analysis of Slc39a8 expression in 8-week-old C57BL/6J female (left) and male (right) mouse tissues (n = 6 per group). Small intestines were equally divided into 7 segments, and each segment is approximately 6 cm in length (Sm. int.1–7). “Small intestine 1” refers to duodenum; “Small intestine 4” refers to jejunum; “Small intestine 7” refers to ileum; and “Large intestine” refers to distal colon. b Fluorescence images of frozen duodenal, jejunal, ileal, and colon sections from 8-week-old C57BL/6J female (upper) and male (lower) mice. DAPI (blue); SLC39A8 (red). Original magnification, ×10 and ×60 (enlarged insets); Scale bars: 100 μm. Each image was acquired independently three times, with similar results. c qPCR analysis of Slc39a8 expression in 10-week-old male control and Slc39a8-IEC KO mice (n = 4 per group). “Duodenum” refers to the proximal 6 cm of small intestines; “Jejunum” refers to the medial 18–24 cm of small intestines; “Ileum” refers to the medial 36–42 cm of small intestines; and “Colon” refers to the distal 4–8 cm of large intestines. d ICP-MS analysis of Mn levels in duodenum, jejunum, ileum, colon, liver, bile, lung, kidney, heart, brain, whole blood from 20-week-old male (M) and female (F) control (Cont) and Slc39a8-IEC KO (KO) mice (n = 5 male per group; n = 6 female per group). Data are presented as individual values and represent the mean ± SEM. The p-values were determined by one-way ANOVA with Bonferroni’s multiple comparisons test for c, and unpaired two-tailed Student’s t test for d. ns not significant. Source data are provided as a Source Data file.
Fig. 2
Fig. 2. Loss of Slc39a8 in IECs results in impaired intestinal Mn absorption.
a Control and Slc39a8-IEC KO mice at 10 weeks of age were administered 0.1 µCi [54Mn]MnCl2 per gram body weight via oral-gastric gavage. Blood was collected at 15 min, and blood counts per min (cpm) were determined by γ-counting. Mice were killed 4 h later, and (b) duodenum, jejunum, ileum, and colon, and (c) tissue cpm were determined by γ-counting. d Control and Slc39a8-IEC KO mice at 10 weeks of age were administered 0.1 µCi [54Mn]MnCl2 per gram body weight via tail vein injection. Blood was collected at 15 min, and blood counts per minute (cpm) were determined by γ-counting. Mice were killed 4 h later, and (e) duodenum, jejunum, ileum, and colon, and (f) tissue cpm were determined by γ-counting. [control: n = 4, n = 2 male (M), n = 2 female (F); Slc39a8-IEC KO: n = 4 per group, n = 2 M, n = 2 F]. Data are presented as individual values and represent the mean ± SEM. The p-values were determined by unpaired two-tailed Student’s t test for af. ns not significant. Source data are provided as a Source Data file.
Fig. 3
Fig. 3. Slc39a8 mediates the uptake of 54Mn at the apical membrane of intestinal organoid monolayer culture.
a Schematic illustrating the generation of intestinal organoid monolayer cultures from murine intestinal crypts. b Representative confocal images showing immunostaining for SLC39A8 (red), ZO1 (green), and DAPI (blue) in enteroid or colonoid monolayers from control and Slc39a8-IEC KO mice. Polarized apical surfaces were stained with ZO1 (green), indicated by black arrowheads in the top panels. XY projection (bottom panels); XZ projection (top panels) and YZ projection (right panels) orthogonal views. Scale bar: 25 µm. Each image was acquired independently three times, with similar results. c Schematic representation of apical 54Mn accumulation by intestinal organoid monolayer culture. d 54Mn was added to the media in the apical compartments of enteroid or colonoid monolayers. Cell-associated radioactivity was determined with a gamma counter (n = 3 biologically independent samples). e Schematic representation of basolateral 54Mn accumulation by primary IECs. f 54Mn was added to the media in the basolateral compartments of enteroid or colonoid monolayers. Cell-associated radioactivity was determined with a gamma counter (n = 3 biologically independent samples). Data are presented as individual values and represent the mean ± SEM. The p-values were determined by unpaired two-tailed Student’s t test for d and f. ns not significant. Source data are provided as a Source Data file. Figures a, c, and e were created with BioRender.com released under a Creative Commons Attribution-NonCommercial-NoDerivs 4.0 International license.
Fig. 4
Fig. 4. Loss of Slc39a8 in IECs exacerbates DSS-induced acute model of colitis.
a Schematic of the DSS-induced acute colitis model. For colitis induction, mice were given drinking water containing 3% (w/v) DSS for 8 days (inflammatory phase). The mice were then provided with regular drinking water for 5 days (recovery phase). Representative data from two independent experiments are shown. b Changes in body weight (percentage of original body weight) over time (days) in 8-week-old male control and Slc39a8-IEC KO mice following DSS treatment (n = 13 per group). c Gross morphology of the colon. d Colon length and e spleen/body weight ratios on day 13 after the DSS treatment in control and Slc39a8-IEC KO mice (n = 6 per group). f Hematoxylin/eosin (H&E) staining of colons and g pathological scores on day 13 without or with DSS treatment in control and Slc39a8-IEC KO mice (n = 8 per group). Scale bars: 100 μm. h Measurement of 4 kDa FITC-dextran in serum on day 13 without or with the DSS treatment in control and Slc39a8-IEC KO mice (n = 6 per group). i qPCR quantification (control, n = 5; Slc39a8-IEC KO, n = 5; control + DSS, n = 6; Slc39a8-IEC KO + DSS, n = 6), j immunofluorescence staining and relative fluorescence, and k immunoblot analysis and densitometric quantification of tight junction proteins in the colons of control and Slc39a8-IEC KO mice on day 13 without or with DSS treatment (n = 3 per group). Scale bar: 100 μm. l qPCR quantification of proinflammatory cytokines and chemokines in the colons of control and Slc39a8-IEC KO mice on day 13 without or with DSS treatment (n = 5 per group). Data are presented as individual values and represent the mean ± SEM. The p-values were determined by two-way ANOVA with Bonferroni’s multiple comparisons test for b, unpaired two-tailed Student’s t test for d and e, and one-way ANOVA with Bonferroni’s multiple comparisons test for gl. Source data are provided as a Source Data file.
Fig. 5
Fig. 5. Loss of epithelial Slc39a8 aggravates the DSS-induced chronic model of colitis.
a Schematic of the DSS-induced chronic colitis model. For colitis induction, mice received two cycles of DSS treatment provided in drinking water. Each cycle consisted of 8 days of water containing 3% DSS (inflammatory phase) followed by 5 days of water alone (recovery phase). Representative data from two independent experiments are shown. b Time course of the disease activity index in control and Slc39a8-IEC KO mice during the second DSS cycle (n = 6 per group). c Colon length from control and Slc39a8-IEC KO mice on day 14 without or with DSS treatment (control, n = 5; Slc39a8-IEC KO, n = 5; control + DSS, n = 6; Slc39a8-IEC KO + DSS, n = 6 per group). d Survival percentage (%) over time. e H&E staining of colons and f pathological scores from control and Slc39a8-IEC KO mice on day 14 without or with DSS treatment (control, n = 5; Slc39a8-IEC KO, n = 5; control + DSS, n = 6; Slc39a8-IEC KO + DSS, n = 6 per group). Scale bars: 100 μm. Data are presented as individual values and represent the mean ± SEM. The p-values were determined by two-way ANOVA with Bonferroni’s multiple comparisons test for b, one-way ANOVA with Bonferroni’s multiple comparisons test for c and f, and log-rank test for d. Source data are provided as a Source Data file.
Fig. 6
Fig. 6. ACER1 is upregulated in the intestine of Slc39a8-IEC KO mice.
a RNA-seq analysis revealed 4 misregulated genes (Padj < 0.1, n = 3) in the intestines of 8-week-old male Slc39a8-IEC KO mice. Volcano plot profiles of the -log10 adjusted p-value and log2 fold change of gene expression between control and Slc39a8-IEC KO mice intestines. b Genome browser shot of the Acer1 locus. Validation of Acer1 expression by qPCR in c the ileal and colonic mucosa in control and Slc39a8-IEC KO mice (n = 3 per group), and d the enteroid and colonoid monolayers derived from control or Slc39a8-IEC KO mice (n = 4 biologically independent samples per group). Validation of Acer1 protein expression by immunoblot analysis in e the ileal and colonic mucosa in control and Slc39a8-IEC KO mice (n = 3 per group), and f the enteroid and colonoid monolayers derived from control and Slc39a8-IEC KO mice (n = 2 biologically independent samples). Immunoblots of actin were used as the loading control. Quantification of the relative protein expression after normalization with actin. Data are presented as individual values and represent the mean ± SEM. The p-values were determined by Wald test implemented in DESeq2 R package for a, and unpaired two-tailed Student’s t test for ce. Source data are provided as a Source Data file.
Fig. 7
Fig. 7. ACER1 inhibitor D-e-MAPP promotes upregulation of epithelial tight junction and epithelial barrier function in Slc39a8-deficient intestinal organoid monolayer cultures.
qPCR analysis of tight junction (a) Zo1, (b) Cldn3, (c) Cldn5, and (d) Cldn7 measured 24 h after D-e-MAPP treatment in Slc39a8-IEC KO mouse-derived enteroid or colonoid monolayers (Without D-e-MAPP treatment, n = 4; D-e-MAPP treatment, n = 3 biologically independent samples). e Immunoblot analysis and densitometric quantification of ZO1, Cldn3, Cldn5, and Cldn7 measured 24 h after D-e-MAPP treatment in Slc39a8-IEC KO mouse-derived enteroid monolayers. Quantification of the relative protein expression after normalization with actin (n = 2 biologically independent samples). f Paracellular flux of 4 kDa FITC-dextran and g Intestinal transepithelial electrical resistance (TEER) were measured 24 h after D-e-MAPP treatment in Slc39a8-IEC KO mouse-derived enteroid and colonoid monolayers (Without D-e-MAPP treatment, n = 4; D-e-MAPP treatment, n = 3 biologically independent samples). Data are presented as individual values and represent the mean ± SEM. The p-values were determined by one-way ANOVA with Bonferroni’s multiple comparisons test for ad, f, and g. Source data are provided as a Source Data file.
Fig. 8
Fig. 8. Pretreatment with the ACER1 inhibitor D-e-MAPP confers protection against colitis in Slc39a8-IEC KO mice.
a Schematic of pretreatment with the ACER1 inhibitor D-e-MAPP in the DSS-induced colitis model in mice. Mice were treated with or without the ACER1 inhibitor D-e-MAPP (10 nmol/g body weight) daily for one week, followed by DSS treatment to induce colitis. b Changes in body weight (percentage of original body weight) over time (days) in 8-week-old male mice following DSS treatment (n = 4 per group). c Gross morphology of the large intestine. d Colon length on day 14 after the DSS treatment (n = 4 per group). e Hematoxylin/eosin (H&E) staining of colons and f pathological scores on day 14 after DSS treatment (n = 4 per group). Scale bars: 100 μm. g Measurements of 4-kDa FITC-dextran in serum on day 14 after the DSS treatment in control and Slc39a8-IEC KO mice (n = 4 per group). qPCR quantification of (h) tight junction and (i) proinflammatory cytokines and chemokines in colon mucosa on day 13 after DSS treatment in control and Slc39a8-IEC KO mice (n = 4 per group). j Sphingolipid metabolism. k Heat map showing significantly altered specific lipids in the intestines of control and Slc39a8-IEC KO mice with and without treatment with the ACER1 inhibitor D-e-MAPP. Shades of red and green represent upregulated and downregulated lipids, respectively (see color key). Lipid classes include SM sphingomyelins, HexCer hexosylceramides, SPB sphinganine, PE-Cer phosphatidylethanolamine ceramides, and CE: ceramides. n = 3 per group. l SMS1 activity in control and Slc39a8-IEC KO intestines (n = 6 per group) and intestinal organoid monolayer cells derived from control and Slc39a8-IEC KO mice (n = 5 biologically independent samples). m Average levels of three sphingomyelin species (SM 40:0;3O, SM 30:0;2O, and SM 43:1;2O). Data are presented as individual values and represent the mean ± SEM. The p-values were determined by two-way ANOVA with Bonferroni’s multiple comparisons test for b, one-way ANOVA with Bonferroni’s multiple comparisons test for d, fi, and unpaired two-tailed Student’s t test for l. Source data are provided as a Source Data file.
Fig. 9
Fig. 9. Mn deficiency upregulates Acer1 expression and treatment with ACER1 inhibitor D-e-MAPP confers protection against colitis in Mn-deficient mice.
a Schematic of the dietary Mn restriction experiment and treatment with the ACER1 inhibitor D-e-MAPP in the DSS-induced mouse model of colitis. Mice were fed either Mn-deficient (Mn-D) or Mn-adequate (Mn-A) diets for 14 days. Mice were then treated with or without D-e-MAPP (10 nmol/g body weight) daily at 24 h intervals during the DSS treatment (inflammatory phase). The mice were then provided with regular drinking water (recovery phase). b ACER1 expression in the ileal and colonic mucosa in Mn-A and Mn-D mice (n = 6 per group). c Changes in body weight (percentage of original body weight) over time (days) in Mn-A and Mn-D mice following DSS treatment (n = 15 per group). d Survival percentage (%) over time. e Gross morphology of the large intestine. f Colon length on day 14 after DSS treatment (Mn-A, n = 8; Mn-A + D-MAPP, n = 8; Mn-D, n = 6; Mn-D + D-MAPP, n = 8 per group). g Hematoxylin/eosin (H&E) staining of colons and h pathological scores on day 14 after DSS treatment (Mn-A, n = 8; Mn-A + D-MAPP, n = 8; Mn-D, n = 4; Mn-D + D-MAPP, n = 8 per group). Scale bars: 100 μm. i A model of the proposed mechanism by which Slc39a8 deficiency contributes to the pathophysiology of IBD. The proposed scheme shows that Slc39a8 deficiency impairs intestinal Mn absorption and disrupts the epithelial barrier by the upregulation of Acer1, thereby leading to inflammation. Data are presented as individual values and represent the mean ± SEM. The p-values were determined by unpaired two-tailed Student’s t test for b, two-way ANOVA with Bonferroni’s multiple comparisons test for c, Log-rank test for d, and one-way ANOVA with Bonferroni’s multiple comparisons test for f and h. Source data are provided as a Source Data file. Figure 9i was created with BioRender.com released under a Creative Commons Attribution-NonCommercial-NoDerivs 4.0 International license.

References

    1. Zanello G, et al. Genetics and innate and adaptive immunity in IBD. Nestle Nutr. Inst. Workshop Ser. 2014;79:41–55. doi: 10.1159/000360676. - DOI - PubMed
    1. Gibson PR. Increased gut permeability in Crohn’s disease: is TNF the link? Gut. 2004;53:1724–1725. doi: 10.1136/gut.2004.047092. - DOI - PMC - PubMed
    1. Groschwitz KR, Hogan SP. Intestinal barrier function: molecular regulation and disease pathogenesis. J. Allergy Clin. Immunol. 2009;124:3–20. doi: 10.1016/j.jaci.2009.05.038. - DOI - PMC - PubMed
    1. Landy J, et al. Tight junctions in inflammatory bowel diseases and inflammatory bowel disease associated colorectal cancer. World J. Gastroenterol. 2016;22:3117–3126. doi: 10.3748/wjg.v22.i11.3117. - DOI - PMC - PubMed
    1. Vindigni SM, Zisman TL, Suskind DL, Damman CJ. The intestinal microbiome, barrier function, and immune system in inflammatory bowel disease: a tripartite pathophysiological circuit with implications for new therapeutic directions. Ther. Adv. Gastroenterol. 2016;9:606–625. doi: 10.1177/1756283X16644242. - DOI - PMC - PubMed

MeSH terms