. 2024 Jun 5;14(1):12952.
doi: 10.1038/s41598-024-63281-8.

Ecological restoration at pilot-scale employing site-specific rationales for small-patch degraded mangroves in Indian Sundarbans

Affiliations

Ecological restoration at pilot-scale employing site-specific rationales for small-patch degraded mangroves in Indian Sundarbans

Krishna Ray et al. Sci Rep. .

Abstract

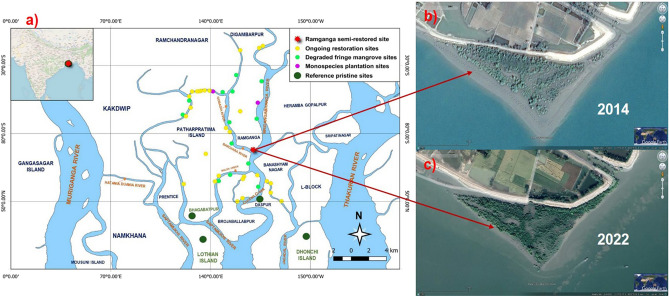
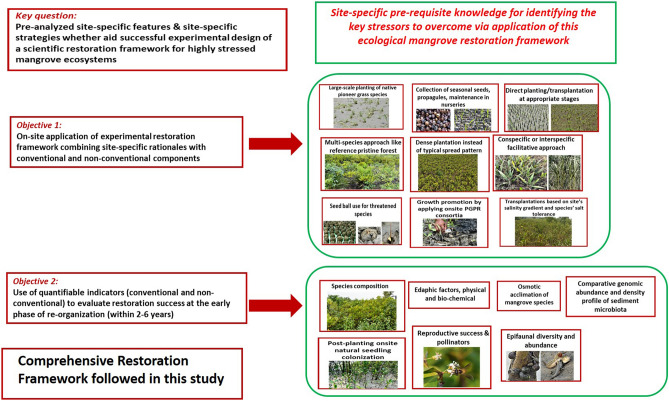
To date, degraded mangrove ecosystem restoration accomplished worldwide primarily aligns towards rehabilitation with monotypic plantations, while ecological restoration principles are rarely followed in these interventions. However, researchers admit that most of these initiatives' success rate is not appreciable often. An integrative framework of ecological restoration for degraded mangroves where site-specific observations could be scientifically rationalized, with co-located reference pristine mangroves as the target ecosystem to achieve is currently distinctively lacking. Through this experimental scale study, we studied the suitability of site-specific strategies to ecologically restore degraded mangrove patches vis-à-vis the conventional mono-species plantations in a highly vulnerable mangrove ecosystem in Indian Sundarbans. This comprehensive restoration framework was trialed in small discrete degraded mangrove patches spanning ~ 65 ha. Site-specific key restoration components applied are statistically validated through RDA analyses and Bayesian t-tests. 25 quantifiable metrics evaluate the restoration success of a ~ 3 ha degraded mangrove patch with Ridgeline distribution, Kolmogorov-Smirnov (K-S) tests, and Mahalanobis Distance (D2) measure to prove the site's near-equivalence to pristine reference in multiple ecosystem attributes. This restoration intervention irrevocably establishes the greater potential of this framework in the recovery of ecosystem functions and self-sustenance compared to that of predominant monoculture practices for vulnerable mangroves.

Keywords: Degraded mangroves; Ecological restoration; Indian Sundarbans; Indicators of restoration & self-sustenance; Mono- & multi-species assemblage; Site-specific strategies.


Conflict of interest statement

The authors declare no competing interests.

Figures

Figure 1
Figure 1
(a) Map representing the locations of Ramganga (the experimental semi-restored site), other ongoing restoration sites, degraded fringe mangrove sites, monospecies plantation sites, and reference pristine sites. Circles with red color denotes Ramganga semi-restored site, yellow color denotes other ongoing restoration sites, light green color denotes degraded fringe mangrove sites, violet color denotes monospecies plantation sites, and dark green color denotes reference pristine mangroves at their actual locations. (b) Google Earth image of Ramganga (the experimental semi-restored site) in the year 2014 when restoration was just initiated. (c) Google Earth image of Ramganga (the experimental semi-restored site) in the year 2022. Map-based illustrations for denoting geographical locations in (a) were executed through open access QGIS (version 3.28.3) (https://qgis.org/en/site/forusers/download.html) and Google Earth images, (b,c) were exported from open access Google Earth Pro (version 7.3.6.9750, 64-bit) (https://www.google.com/intl/en_in/earth/about/versions/#download-pro).
Figure 2
Figure 2
Bi-plots generated by canonical redundancy analysis (RDA) illustrating the application of different components of restoration framework and their success towards ecological restoration measured with different environmental and eco-physiological quantifiable variable outcomes. (a) RDA for grass-assisted stabilization, (b) RDA for multispecies assemblage, (c) RDA for facilitative interaction, (d) RDA for growth promotion by PGPR consortia addition, (e) RDA for seed ball use. TPD trapped propagules density, SDDTP seedling density developed from trapped propagule, SPTP survival% of trapped propagules, SSR seedlings species richness, Eden epifaunal density, ESR epifaunal species richness, OC organic carbon%, AN ammonia nitrogen, P phosphorus, MNGI monospecies with no grass at initial stage, MLGC multispecies with low grass coverage, MHGC multispecies with high grass coverage, MMGC multispecies with medium grass coverage, SDI Shannon diversity index, GCP grass cover%, Sa Sand%, S Silt%, C Clay%. SPS self-pollination success, CPS cross-pollination success, PL pollen load, PF pollinator frequency, PSR pollinator species richness, Eden epifaunal density, ESR epifaunal species richness, OC organic carbon%, NRSD naturally regenerated seedling density, SRSSR naturally regenerated seedling species richness, MSM monospecies mangroves, SRMM semi-restored multispecies mangroves, PMM pristine multispecies mangroves, SR species richness, EC electrical conductivity, NST number of seeds/seedlings transplanted, NSE number of seeds/seedlings established, NSG number of seeds germinated, SGP seeds germination%, SPES Survival% of established seedlings, NL number of leaves, PHt present height, VCPM very closely planted mangrove seedlings (≤ 5 cm), CPM Closely planted mangrove seedlings (≤ 40 > 5 cm), DPM distantly planted mangrove seedlings (≥ 100 cm), NC Number of clumps, NSAC no. of seeds/seedlings aggregated in a clump, GB glycine betaine, SSR soluble sugar-starch ratio, PGPR Plant growth promoting rhizobacteria, LW final leaf width, SH final shoot height, NN nitrate nitrogen, WC without consortium, BC1 BC1 consortium, BC2 BC2 consortium, BC3 BC3 consortium, SID Siderophore%, IAA indole acetic acid produced, PSB P-solubilization, ACCD ACC deaminase units, ARA acetylene reduction assay. (e) NSD number of seed ball dispersed, NST number of seedlings transplanted, SEm number of seedlings emerged from seed balls, SEt number of seedlings established from transplanted seedlings, CB cost–benefit, RET reduction in establishment time, Ht height of seedlings, NL number of leaves, DLSS decrease in use of less saline soil, IPS/EPS emergence% of seedlings from seed balls/ establishment% of transplanted seedlings, SB seed ball technology, Con conventional technology, VCPM very closely planted mangrove seedlings (≤ 5 cm.), NSB number of seeds in a ball.
Figure 3
Figure 3
Ridgeline plots depicting the distributional changes of 5 different physical criteria of mangrove sediments across different states of mangroves viz. Degraded, Ramganga 2014, Ramganga 2016, Ramganga 2021, Ramganga 2022 and Target pristine reference mangrove forest (Y-axis) (a) Sand%, (b) Silt%, (c) Clay%, (d) pH, (e) Conductivity (dS−m). Here Ramganga site is the semi-restored site under restoration efforts since 2014.
Figure 4
Figure 4
(a) Boxplot representing the sample distribution of Mahalanobis (D2) distance showing the semi-restored Ramganga site approaching ecologically towards Target pristine mangrove with the help of three key successful components of described restoration framework (b,c) Facilitative interaction demonstrated in Phoenix paludosa (Near threatened line), (d,e) Grass assisted stabilization encouraging propagule trapping (f,g) Multispecies assemblage approach successfully applied at semi-restored Ramganga site.
Figure 5
Figure 5
Heatmap displaying top 15 bacterial classes (Y-axis) defined from (a) sites at 4 distinct ecological status of mangroves and from (b) established mangrove grass rhizospheres from the semi-restored site (all in columns). The relative 16S gene abundance is shown in a 1–15% scale with three color variants. 16S gene read abundances with more than 5% are in the blue gradient and below 5% are in the red gradient. The heatmap was built on different biosamples’ reads from each ecological state which are included in the NCBI Bioprojects (X-axis).
Figure 6
Figure 6
Glimpses of natural pristine mangroves of Indian Sundarbans vis-à-vis our restored site at Ramganga, (a,b) Natural Avicennia alba dominated mono-species mangroves with naturally recruited new seedlings in each season at the sites, (c,d) Natural multispecies pristine mangroves with Bruguiera gymnorrhiza also rarely interspersed in the community in c (e,f) Natural multispecies pristine mangroves with rich new recruits of seedlings, (gi) Our multispecies semi-restored site at Ramganga (g), inviting naturally regenerated seedlings under its canopy each season showing its return to self-sustainability comparable to that of pristine reference mangroves (h,i).
Figure 7
Figure 7
Glimpses of the conventional restoration ventures with monospecies Bruguiera gymnorrhiza at Indian Sundarbans (ae), monospecies Bruguiera gymnorrhiza-planted sites under different stages of developments from Indian Sundarbans with almost barren understories (d,e), sometimes with sparse grasses Sporobolus sp., Paspalum sp., or Suaeda spp. (a,b), scanty seedlings of its own (c), (fi) Contrasting sights from our different multispecies restoration sites, planted with Bruguiera gymnorrhiza amid additional species assemblages.
Figure 8
Figure 8
Box-whisker-dot plot displaying the data of regenerated/naturally growing seedlings and the abundance of epi-fauna across different states of mangroves viz. Degraded, Ramganga 2014, Ramganga 2016, Ramganga 2021, Ramganga 2022 and Target pristine reference mangrove forest. Here Ramganga site is the semi-restored site under restoration efforts since 2014. (a) No. of species of regenerated seedlings, (b) No. of regenerated seedlings ha−1, (c) No. of epifaunal species, (d) No. of epifaunal individuals ha−1. Whiskers represent the range of data from highest to lowest with a median value and the dots are the number of data (n) used for analysis. Here n = 10. Values designated with different letters are significantly different at the 5% level.
Figure 9
Figure 9
A Comprehensive Restoration Framework followed for the ecological restoration of degraded mangroves is presented in this study with the key question, site-specific prerequisites, and the achieved objectives with their components.
Figure 10
Figure 10
Ramganga semi-restored mangrove site and Durbachoti, one ongoing mangrove restoration site, each at different time points (ac) Ramganga in 2014, before the initiation of restoration activities just in front of newly constructed dyke (df) Ramganga in 2022, ecologically semi-restored mangrove site shielding the old dyke (g) Durbachoti in 2020, before the initiation of restoration activities, (h,i) Durbachoti in 2021 & 2022 respectively, approaching ecological restoration.

Similar articles

References

    1. Nelson, C. R. et al. Standards of Practice to Guide Ecosystem Restoration: A Contribution to the United Nations Decade on Ecosystem Restoration 2021–2030 (FAO, SER & Gland, IUCN CEM, 2024). 10.4060/cc9106en
    1. Holling CS, Gunderson LH. Resilience and adaptive cycles. In: Gunderson LH, Holling CS, editors. Panarchy: Understanding transformations in human and natural systems. Island Press; 2002. pp. 25–62.
    1. Du Toit JT, Pettorelli N. The differences between rewilding and restoring an ecologically degraded landscape. J. Appl. Ecol. 2019;56(11):2467–2471. doi: 10.1111/1365-2664.13487. - DOI
    1. Gann GD, et al. International principles and standards for the practice of ecological restoration. Restor. Ecol. 2019;27(S1):S1–S46. doi: 10.1111/rec.13035. - DOI
    1. FAO, SER & IUCN CEM. Standards of Practice to Guide Ecosystem Restoration. A Contribution to the United Nations Decade on Ecosystem Restoration. Summary Report (Rome, 2023). 10.4060/cc5223en.