Meta-Analysis
. 2024 Jun;56(6):1090-1099.
doi: 10.1038/s41588-024-01763-1. Epub 2024 Jun 5.

Genome-wide meta-analyses of restless legs syndrome yield insights into genetic architecture, disease biology and risk prediction

Barbara Schormair #  1   2 Chen Zhao #  3   4 Steven Bell #  5   6   7 Maria Didriksen  8   9 Muhammad S Nawaz  10 Nathalie Schandra  3   4 Ambra Stefani  11 Birgit Högl  11 Yves Dauvilliers  12 Cornelius G Bachmann  13   14 David Kemlink  15 Karel Sonka  15 Walter Paulus  16 Claudia Trenkwalder  17   18 Wolfgang H Oertel  3   19 Magdolna Hornyak  20 Maris Teder-Laving  21 Andres Metspalu  21 Georgios M Hadjigeorgiou  22 Olli Polo  23 Ingo Fietze  24 Owen A Ross  25 Zbigniew K Wszolek  26 Abubaker Ibrahim  11 Melanie Bergmann  11 Volker Kittke  3   4 Philip Harrer  3   4 Joseph Dowsett  8 Sofiene Chenini  12 Sisse Rye Ostrowski  8   27 Erik Sørensen  8 Christian Erikstrup  28   29 Ole B Pedersen  27   30 Mie Topholm Bruun  31 Kaspar R Nielsen  32 Adam S Butterworth  33   34   35   36   37 Nicole Soranzo  35   38   39 Willem H Ouwehand  38   40   41 David J Roberts  35   42   43 John Danesh  33   34   35   36   37   39 Brendan Burchell  44 Nicholas A Furlotte  45 Priyanka Nandakumar  45 23andMe Research TeamD.E.S.I.R. study groupChristopher J Earley  46 William G Ondo  47 Lan Xiong  48   49 Alex Desautels  50   51 Markus Perola  52   53 Pavel Vodicka  54   55   56 Christian Dina  57 Monika Stoll  58 Andre Franke  59 Wolfgang Lieb  60 Alexandre F R Stewart  61 Svati H Shah  62   63 Christian Gieger  64   65 Annette Peters  64   66   67 David B Rye  68 Guy A Rouleau  48   49   69 Klaus Berger  70 Hreinn Stefansson  10 Henrik Ullum  71 Kari Stefansson  10 David A Hinds  45 Emanuele Di Angelantonio  33   34   35   36   37   72 Konrad Oexle  3   4   73 Juliane Winkelmann  3   4   74   75
Collaborators, Affiliations
Meta-Analysis

Genome-wide meta-analyses of restless legs syndrome yield insights into genetic architecture, disease biology and risk prediction

Barbara Schormair et al. Nat Genet. 2024 Jun.

Abstract

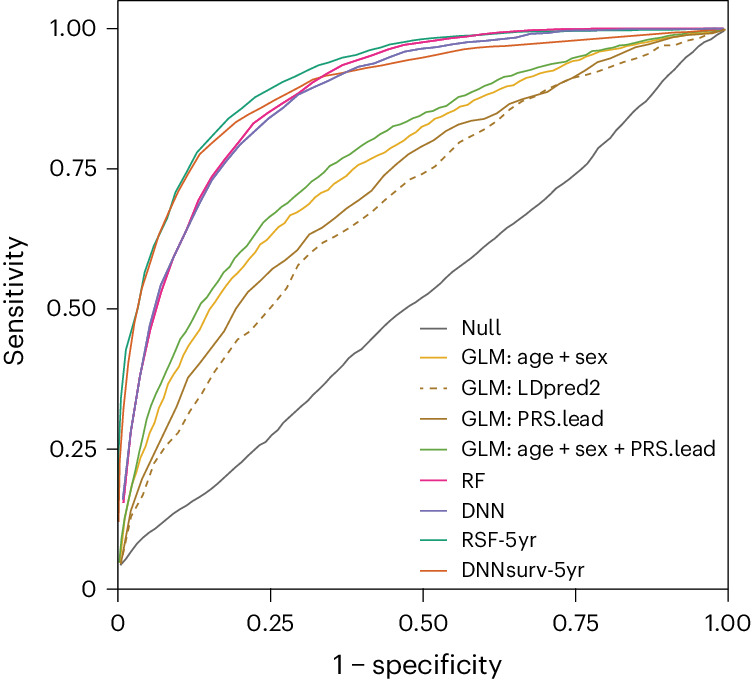
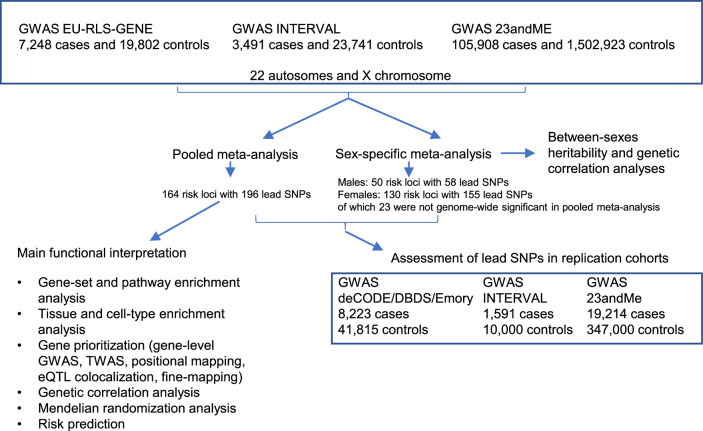
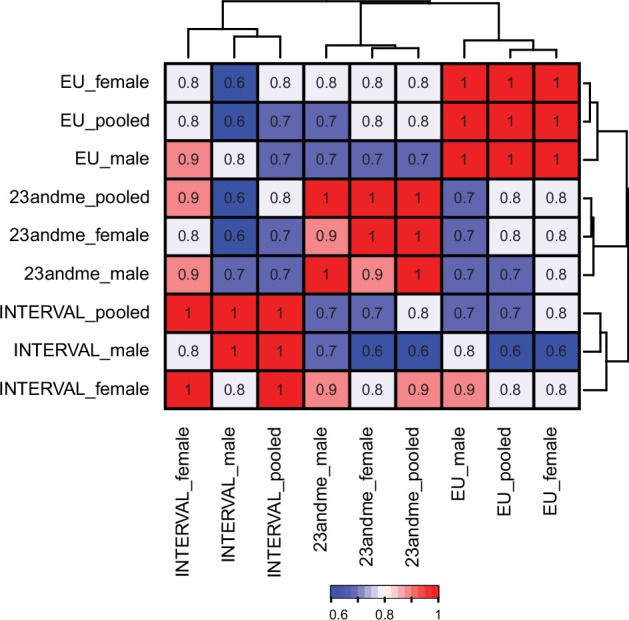
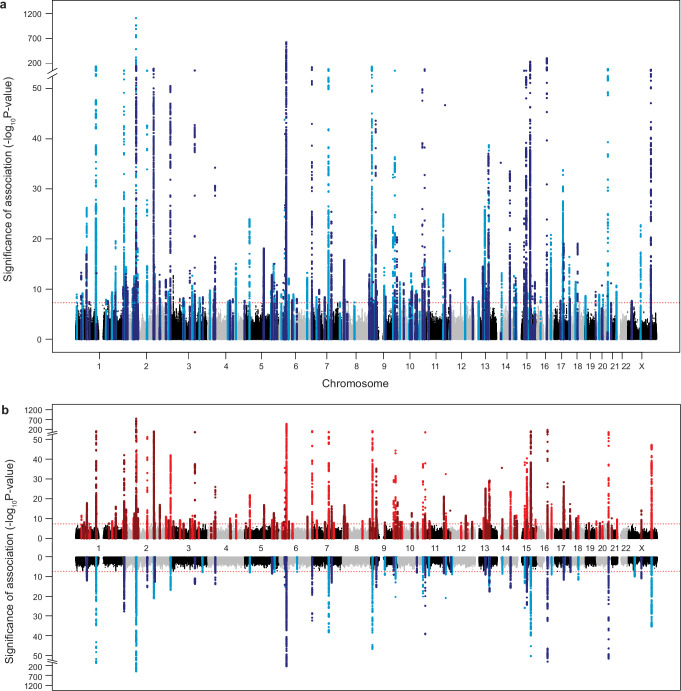
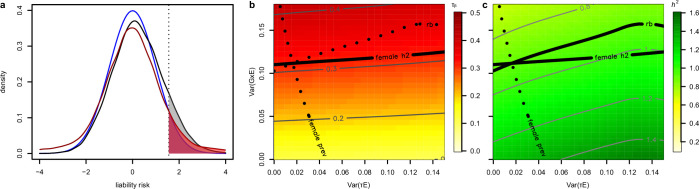
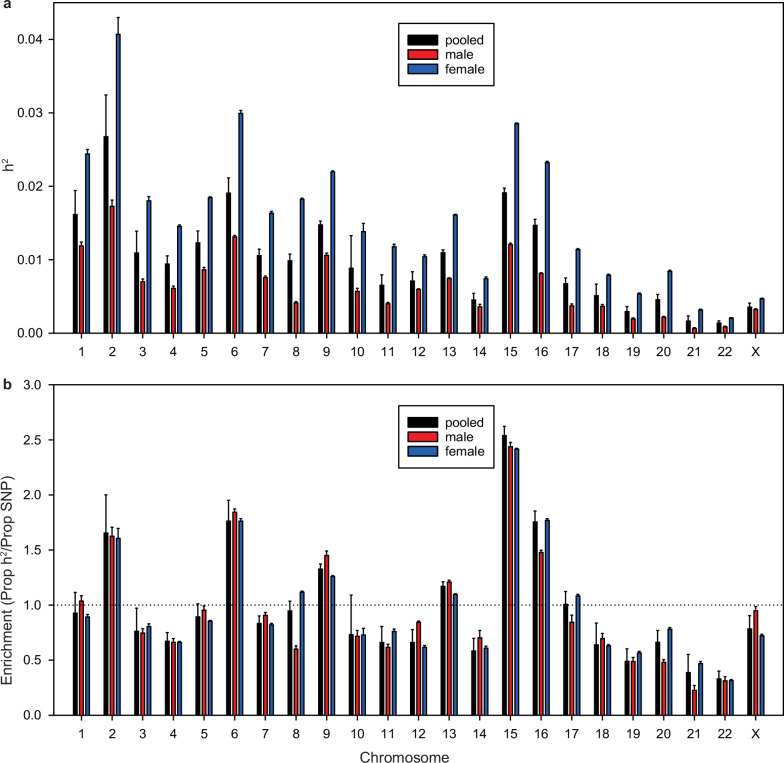
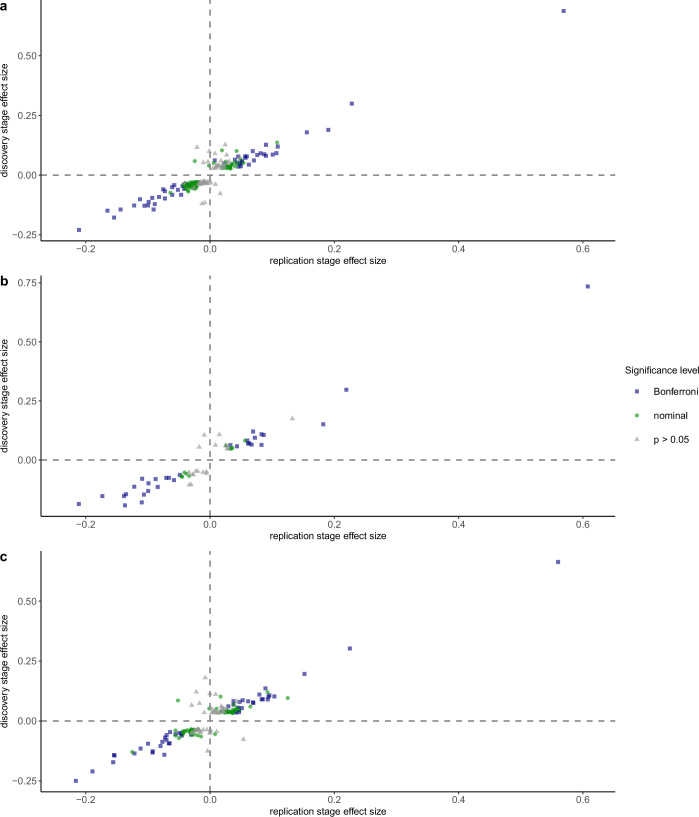
Restless legs syndrome (RLS) affects up to 10% of older adults. Their healthcare is impeded by delayed diagnosis and insufficient treatment. To advance disease prediction and find new entry points for therapy, we performed meta-analyses of genome-wide association studies in 116,647 individuals with RLS (cases) and 1,546,466 controls of European ancestry. The pooled analysis increased the number of risk loci eightfold to 164, including three on chromosome X. Sex-specific meta-analyses revealed largely overlapping genetic predispositions of the sexes (rg = 0.96). Locus annotation prioritized druggable genes such as glutamate receptors 1 and 4, and Mendelian randomization indicated RLS as a causal risk factor for diabetes. Machine learning approaches combining genetic and nongenetic information performed best in risk prediction (area under the curve (AUC) = 0.82-0.91). In summary, we identified targets for drug development and repurposing, prioritized potential causal relationships between RLS and relevant comorbidities and risk factors for follow-up and provided evidence that nonlinear interactions are likely relevant to RLS risk prediction.


Conflict of interest statement

The funders of the study had no role in conceptualization, design, data collection, analysis, the decision to publish or preparation of the manuscript. J.W., B.S., K.O. and C.Z. have filed a patent application (WO2021185936A1). Z.K.W. serves as PI or co-PI on Biohaven Pharmaceuticals (BHV4157-206), Neuraly (NLY01-PD-1) and Vigil Neuroscience (VGL101-01.002, VGL101-01.201, PET tracer development protocol, and CSF1R biomarker and repository project) grants. Z.K.W. serves as co-PI of the Mayo Clinic APDA Center for Advanced Research and as an external advisory board member for Vigil Neuroscience. W.P. has received honoraria as a speaker from Philips and MediPark Clinic and as a consultant from Abbott and Precisis. J. Danesh serves on scientific advisory boards for AstraZeneca, Novartis and the UK Biobank and has received multiple grants from academic, charitable and industry sources outside of the submitted work. A.S.B. reports institutional grants from AstraZeneca, Bayer, Biogen, BioMarin, Bioverativ, Novartis, Regeneron and Sanofi. D.A.H., N.A.F., P.N. and members of the 23andMe Research Team are employed by and hold stock or stock options in 23andMe. Authors affiliated with deCODE Genetics/Amgen declare competing financial interests as employees. The other authors declare no competing interests.

Figures

Fig. 1
Fig. 1. Pathway enrichment analysis.
a,b, Treemaps of significantly enriched (FDR < 0.05, one-sample one-sided Z-test (DEPICT) or one-sided t-test (MAGMA)) pathways. Respective GO terms were clustered based on their semantic similarity (method: Wang, GOSemSim as implemented in the rrvgo package version 1.2.0) using results from DEPICT (a) and results from MAGMA (b). Terms are presented in rectangles. Coloring indicates the membership of a term in a specific cluster. In addition, each cluster is visualized by thick border lines. The size of each rectangle corresponds to the significance of the enrichment. The most significantly enriched term in each cluster was selected as the representative term and is displayed in white font.
Fig. 2
Fig. 2. Tissue and cell type enrichment analysis.
Cell type enrichment analysis results of mouse and human developmental (dev) and adolescent and adult CNS single-cell datasets. Cell types are annotated based on the class and subclass definitions used by the mouse brain atlases. We further annotated the neurons with their respective neurotransmitter type. Significance values (−log10 (P value) and FDR, one-sample one-sided Z-test) are reported for MAGMA-based methods, using MAGMA_Celltyping for human adult data and CELLECT-MAGMA otherwise. Gray and black dots indicate cell types not significant on the FDR level by both tools in any of the datasets; color alternates to separate neighboring cell types in the plot more clearly. The color code relates to the brain region where cells originated. Mixed refers to three cell types from the developmental-stage data, for which spatial mapping failed, resulting in an assignment to a mixture of brain regions (forebrain, midbrain, hindbrain) in varying proportions.
Fig. 3
Fig. 3. Genetic correlation analysis.
a, Hierarchical clustering by a weighted correlation matrix analysis with the WGCNA package identified 11 modules. These were named with umbrella terms reflecting the type of traits contained in the respective module. b, Between-trait correlation matrix and genetic correlation with RLS for traits reflecting submodules identified in the 11 modules by consensus manual inspection of clusters. These traits were taken forward to MR analysis. The correlation matrix (rg matrix) indicates genetic correlation between the individual traits. Genetic correlation of each trait with RLS is indicated in the second column (rg to RLS); the significance of this correlation is reported in the third column (−log10 (P value), one-sample two-sided Z-test). COPD, chronic obstructive pulmonary disease; DTI PC1, diffusion tensor imaging principal component 1; ECG, electrocardiogram; dbd, diagnosed by doctor; ICD, ICD-10 coded hospital inpatient diagnosis; incl., including.
Fig. 4
Fig. 4. MR analysis.
LHC-MR results for bidirectional MR between RLS and selected traits. The causal effect size is color coded, with dark blue indicating strong negative effects and dark red indicating strong positive effects. Significance of LHC-MR is reported as the FDR (LRT). Black borders mark traits for which LHC-MR analysis provided evidence for causal-only effects contributing to the relationship between the traits (PLRT_causal_only < 0.05). Dashed black borders mark traits with evidence for confounding effects only in LHC-MR (PLRT_latent_only < 0.05). Bold text indicates traits that showed consistent results in the IVW-MR analysis (one-sample two-sided Z-test, PFDR_filter < 0.05 for significant effects and <0.05 for nonsignificant effects; Supplementary Table 22). ADHD, attention-deficit–hyperactivity disorder; GP, general practitioner; ILD, interstitial lung disease; SHBG, sex hormone binding globulin; sr, self-reported; PLRT, P value of the LRT from LHC-MR.
Fig. 5
Fig. 5. Risk prediction.
Receiver operator characteristic curve showing the performance of different models used to predict RLS risk in the synthetic population representing the EU-RLS-GENE cohort. Null refers to the model including only the intercept (y ≈ 1). GLM:age + sex refers to the model including age, sex and principal components (PCs). GLM:LDpred2 refers to the model including the genome-wide PRS calculated with LDpred2-auto. GLM:PRS.lead refers to the model including the PRS based on 216 lead SNPs. GLM:PRS.lead + age + sex refers to the model including age, sex and the PRS based on 216 lead SNPs. RF refers to the RF model. DNN refers to the DNN model. RSF-5yr refers to the RF survival analysis for a 5-year period. DNNsurv-5yr refers to the DNN survival analysis for a 5-year period.
Extended Data Fig. 1
Extended Data Fig. 1. General study workflow.
Overview of the main analytical steps conducted in the study. While sex-specific GWAS meta-analysis results were used to dissect similarities and differences between both sexes, the pooled meta-analysis results were used for further functional interpretation.
Extended Data Fig. 2
Extended Data Fig. 2. Genetic correlation between individual discovery stage GWAS of the N-GWAMA meta-analysis.
Genetic correlations between the discovery stage input GWAS were calculated using LDSC on the summary statistics.
Extended Data Fig. 3
Extended Data Fig. 3. Manhattan and Miami plots of discovery stage meta-analyses.
a, Results of the pooled discovery meta-analysis. b, Results of the sex-specific discovery meta-analyses. Female-only results are depicted in red in the upper section of the Miami plot, male-only results are depicted in blue in lower section of the Miami plot. The x-axis shows chromosome and base pair positions of the tested variants. The y-axis shows significance as −log10 of the two-sided nominal P-values of the N-GWAMA analyses. Red horizontal dashed lines indicate the Bonferroni-adjusted significant threshold of P < 5 × 10−8.
Extended Data Fig. 4
Extended Data Fig. 4. Simulation study assessing sex-specific heritability and genetic correlation divergence.
Simulation of environmental effect that reconciles sex-difference in heritability with the similarity of the SNP effect sizes. a, Frequency density distributions of the liabilities for different models. Blue line, base model, φ=Xβ+ε, as assumed to be present in males with h2 = 0.1395, X and β as determined by GWAS, ε~N(0,1), and a disease threshold in keeping with the male RLS prevalence of 0.06 (shaded area under the curve). Black line, model with non-interacting binary environmental effect, φ=Xβ+τE+ε, with X,β,ε and threshold as in the base model plus an additional binary effect E~Bernoulli(p=0.21), representing childlessness with a weight vector τ such that that prevalence is 0.13 as in females. Red line, analogous G×E model, φ=Xβ+XηE+ε, but where the environmental effect now interacts with the genetic effects and the corresponding weight vector η is chosen in accordance with the female prevalence. b, c, Optimization of the model φ=Xβ+XηE+τE+ε with X,β,E,ε and threshold as above, where the additional degree of freedom is covered by also considering the mean effect size ratio rb observed in the GWAS. Heatmap and contour plot for logistic regression-based liability scaled LDSC h2 (b) and effect size ratio rb (c) as functions of Var(τE) and Var(XηE). Optimal values for Var(τE) and Var(XηE), that is, for τ and η, respectively, comply with female prevalence, female heritability, and observed effect size ratio as well. The optimal τ turns out to be close to zero so that the environmental factor acts mostly via genetic interaction.
Extended Data Fig. 5
Extended Data Fig. 5. Per chromosome heritability estimation based on the EU-RLS-GENE dataset.
Heritability estimates for each chromosome. a, Overall heritability of SNPs on each chromosome. The height of the bar represents the point estimate of the heritability, and the error bars indicate the standard error of this point estimate. b, Enrichment of heritability, which is defined as the proportion of SNP-heritability divided by the proportion of SNPs in each chromosome. The height of the bar represents the point estimate of the enrichment of heritability, and the error bars indicate the standard error of this point estimate.
Extended Data Fig. 6
Extended Data Fig. 6. Replication of lead SNPs in independent validation samples.
Association results of replication stage. The effect size (beta) of the replication analysis is plotted against the effect size (beta) of the discovery stage for genome-wide significant lead SNPs. The color-coding and symbol shape indicate the strength of the association signal in the replication stage meta-analysis (nominal two-sided P value of random-effects meta-analysis). Blue square, Bonferroni-corrected significance; green circle, nominal significance; grey triangle, not significant. a, Pooled meta-analysis with Bonferroni threshold set at 0.000255, correcting for 196 lead SNPs. b, Male-specific meta-analysis with Bonferroni threshold set at 0.00082, correcting for 61 lead SNPs. c, Female-specific meta-analysis with Bonferroni threshold set at 0.000318, correcting for 157 lead SNPs.

References

    1. Allen RP, et al. Restless legs syndrome: diagnostic criteria, special considerations, and epidemiology. A report from the restless legs syndrome diagnosis and epidemiology workshop at the National Institutes of Health. Sleep Med. 2003;4:101–119. - PubMed
    1. Manconi M, et al. Restless legs syndrome. Nat. Rev. Dis. Primers. 2021;7:80. - PubMed
    1. Schormair B, et al. Identification of novel risk loci for restless legs syndrome in genome-wide association studies in individuals of European ancestry: a meta-analysis. Lancet Neurol. 2017;16:898–907. - PMC - PubMed
    1. Didriksen M, et al. Large genome-wide association study identifies three novel risk variants for restless legs syndrome. Commun. Biol. 2020;3:703. - PMC - PubMed
    1. Allen RP, et al. Restless legs syndrome/Willis–Ekbom disease diagnostic criteria: updated International Restless Legs Syndrome Study Group (IRLSSG) consensus criteria—history, rationale, description, and significance. Sleep Med. 2014;15:860–873. - PubMed

Publication types