. 2024 Jul;21(7):770-786.
doi: 10.1038/s41423-024-01183-5. Epub 2024 Jun 5.

HIF-1α and MIF enhance neutrophil-driven type 3 immunity and chondrogenesis in a murine spondyloarthritis model

Affiliations

HIF-1α and MIF enhance neutrophil-driven type 3 immunity and chondrogenesis in a murine spondyloarthritis model

Akihiro Nakamura et al. Cell Mol Immunol. 2024 Jul.

Abstract

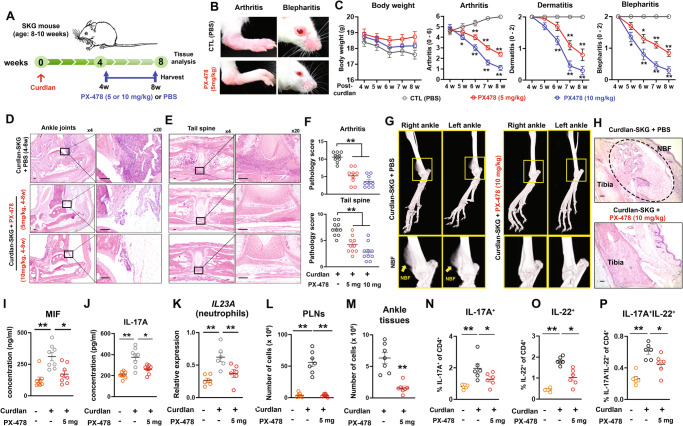
The hallmarks of spondyloarthritis (SpA) are type 3 immunity-driven inflammation and new bone formation (NBF). Macrophage migration inhibitory factor (MIF) was found to be a key driver of the pathogenesis of SpA by amplifying type 3 immunity, yet MIF-interacting molecules and networks remain elusive. Herein, we identified hypoxia-inducible factor-1 alpha (HIF1A) as an interacting partner molecule of MIF that drives SpA pathologies, including inflammation and NBF. HIF1A expression was increased in the joint tissues and synovial fluid of SpA patients and curdlan-injected SKG (curdlan-SKG) mice compared to the respective controls. Under hypoxic conditions in which HIF1A was stabilized, human and mouse neutrophils exhibited substantially increased expression of MIF and IL-23, an upstream type 3 immunity-related cytokine. Similar to MIF, systemic overexpression of IL-23 induced SpA pathology in SKG mice, while the injection of a HIF1A-selective inhibitor (PX-478) into curdlan-SKG mice prevented or attenuated SpA pathology, as indicated by a marked reduction in the expression of MIF and IL-23. Furthermore, genetic deletion of MIF or HIF1A inhibition with PX-478 in IL-23-overexpressing SKG mice did not induce evident arthritis or NBF, despite the presence of psoriasis-like dermatitis and blepharitis. We also found that MIF- and IL-23-expressing neutrophils infiltrated areas of the NBF in curdlan-SKG mice. These neutrophils potentially increased chondrogenesis and cell proliferation via the upregulation of STAT3 in periosteal cells and ligamental cells during endochondral ossification. Together, these results provide supporting evidence for an MIF/HIF1A regulatory network, and inhibition of HIF1A may be a novel therapeutic approach for SpA by suppressing type 3 immunity-mediated inflammation and NBF.

Keywords: Endochondral ossification; Hypoxia-inducible factor-1 alpha; Interleukin-23; Macrophage migration inhibitory factor; Neutrophil; Spondyloarthritis.


Conflict of interest statement

AN and NH have filed a US provisional patent (METHODS OF TREATING SPONDYLOARTHRITIS AND SYMPTOMS THEREOF; No. 63/106,859). AN has received speaker honorarium and/or consultant fees from AbbVie, JAMP, and Novartis. NH has received consulting fees from AbbVie, Amgen, Eli Lilly, Janssen, Merck, Novartis and UCB.

Figures

Fig. 1
Fig. 1
Identification of HIF1A as a shared protein that interacts with MIF to increase the secretion of MIF and IL-23. A Schematic image showing the number of protein‒protein interactions (PPIs) with MIF based on a variety of spondyloarthritis (SpA)-related conditions, cells, and tissues. HIF1A was identified as a shared protein that interacts with MIF in all conditions, cells, and tissues. B Numbers of PPIs with MIF and species-based conservation rates relative to humans are shown. Representative images of immunohistochemistry (IHC) showing the expression of HIF1A around areas of NBF in curdlan- or PBS (control)-treated SKG mice (C) or human spinal entheses from SpA or osteoarthritis (OA) patients (D). E Representative images of immunofluorescence staining showing the expression of HIF1A and MIF in synovial fluid (SF) cells (N, neutrophils; Ly, lymphocytes) isolated from patients with SpA or OA. F Representative images of immunocytochemistry (ICC) showing the expression of HIF1A in SF cells isolated from patients with SpA or OA. G Representative images of ICC showing the expression of HIF1A and MIF in bone marrow (BM) cells from curdlan-injected SKG (curdlan-SKG) or PBS-injected SKG (PBS-SKG) mice. Representative immunoblot images showing the expression of HIF1A (H) and densitometric analysis of HIF1A adjusted to β-actin expression (I) in wild-type (WT; Mif+/+) or MIF knockout (MIF KO; Mif−/−) neutrophils treated with or without curdlan (10 µg/ml for 60 min, n = 6 samples per group). J Concentrations of MIF secreted into the culture media from SKG neutrophils (2 million cells per well in a 96-well plate) cultured under normoxic (21% O2) or hypoxic (2% O2) conditions with or without curdlan (10 µg/ml for 18 h) (n = 8 samples per group). K Representative immunoblot images showing the expression of MIF in the lysates of neutrophils cultured under normoxic or hypoxic conditions with or without PX-478 and curdlan. L‒O Fold changes in the expression of inflammatory cytokines in WT and MIF KO neutrophils cultured under normoxic or hypoxic conditions for 3 or 18 h (n = 6 samples per group). P Representative images of ICC showing the expression of IL-23 p19 in BM cells from curdlan-SKG or PBS-SKG mice. Q Fold changes in the expression of inflammatory cytokines in neutrophils cultured under normoxic or hypoxic conditions and treated with curdlan for 18 h (n = 6 samples per group). R Concentrations of IL-23 p19 secreted into culture media from WT SKG neutrophils (2 million cells per well in a 96-well plate) cultured under normoxic or hypoxic conditions (n = 8 samples per group). Representative immunoblot images showing the expression of IL-23 p19 and HIF1A (S) and the densitometry values adjusted to that of β-actin (T) in WT or MIF-KO neutrophils cultured under normoxic or hypoxic conditions for 18 h (n = 6 samples per group). U Expression of the Il23a mRNA in WT SKG neutrophils treated with or without PX-478 under hypoxic conditions for 18 h. Scale bars, 100 µm (C, D, E, G, P) or 10 µm (F). The data shown in I, J, LO, Q, R, T are presented as the means ± SEMs. Relative data were log-transformed before statistical analyses. Statistical analyses were performed using two-way analysis of variance (ANOVA) tests followed by the two-stage linear step-up procedure of Benjamini, Krieger and Yekutieli post hoc tests (I, T); Friedman tests followed by the two-stage linear step-up procedure of Benjamini, Krieger, and Yekutieli post hoc tests (J); two-tailed paired t tests (LO, Q, U); or Mann‒Whitney U tests (R). *P (or q) < 0.05 and **P (or q) < 0.01
Fig. 2
Fig. 2
Prophylactic effects of a HIF1A inhibitor (PX-478) on SpA pathology. A Schematic image of the effects of PX-478 or PBS treatment on curdlan-injected SKG (curdlan-SKG) mice. B Clinical scores of curdlan-SKG mice treated with PBS or PX-478 (10 mg/kg, oral gavage, three times/week, from 1 to 4 weeks postcurdlan injection; n = 6 mice per group). CG Representative images of clinical features (C, D arthritis, dermatitis, and blepharitis 4 weeks postcurdlan treatment; F, G; arthritis, dermatitis, and blepharitis 8 weeks postcurdlan treatment; E spleen and popliteal lymph nodes 4 weeks postcurdlan or PBS treatment). Representative histological images (H&E staining; H, I) and scores (J; n = 6 mice per group) of the ankle joints and tail vertebrae of curdlan-SKG mice treated with PBS or PX-478 at 8 weeks after the curdlan injection. K Gene expression of inflammatory markers in ankle soft tissues isolated from SKG mice treated with PBS or PX-478 at 8 weeks after the curdlan injection (n = 5 mice per group). Representative histological images showing new bone formation [NBF, H&E (L) and safranin O/fast green (M) staining] in the ankle joints of curdlan-SKG mice treated with PBS or PX-478 at 8 weeks after the curdlan injection. N Gene expression of endochondral ossification (ECO) markers in ankle soft tissues isolated from curdlan-SKG mice treated with PBS or PX-478 at 8 weeks after the curdlan injection (n = 5 mice per group). Scale bars, 100 μm (H, I, L, M). The data shown in B, J, K, N are presented as the means ± SEMs. Relative data were log-transformed before statistical analyses. Statistical analyses were performed using Kruskal‒Wallis tests followed by the two-stage linear step-up procedure of Benjamini, Krieger and Yekutieli post hoc tests (B), Mann‒Whitney U-tests (J), or two-tailed paired t-tests (K, N). *P (or q) < 0.05 and **P (or q) < 0.01
Fig. 3
Fig. 3
Inhibition of HIF1A with PX-478 attenuates SpA pathology. A Schematic image of the effects of PX-478 (5 or 10 mg/kg, oral gavage, three times per week, from 4 to 8 weeks after the curdlan injection) or PBS (control; CTL) administration on curdlan-SKG mice. B Representative images of arthritis and blepharitis in curdlan-SKG mice treated with PBS or PX-478 (5 mg/kg) at 8 weeks postcurdlan injection. C Weekly clinical scores of the curdlan-SKG mice treated with PX-478 (5 or 10 mg/kg) or PBS for 8 weeks (n = 10 mice per group). D, E Histological images showing representative ankle joints and tail vertebrae (H&E staining) of curdlan-SKG mice treated with PX-478 (5 or 10 mg/kg) or PBS at 8 weeks after the curdlan injection. F Pathological scores for inflammation in the joints (arthritis) and tail vertebrae of curdlan-SKG mice treated with PX-478 (5 or 10 mg/kg) or PBS at 8 weeks after the curdlan injection (n = 9 or 10 mice per group). G, H Representative microCT and histological (H&E staining) images showing the ankle joints of curdlan-SKG mice treated with PX-478 (10 mg/kg, 4 to 8 weeks after administration) or PBS at 8 weeks after the curdlan injection. I, J Concentrations of MIF and IL-17A in serum isolated from SKG mice injected with or without PX-478 (5 mg/kg) after the curdlan injection (n = 8 mice per group). K Expression of the Il23a mRNA in neutrophils isolated from PBS- or curdlan-injected SKG mice treated with or without PX-478 at 8 weeks after the curdlan injection (n = 6 mice per group). L, M Total cell numbers in the popliteal lymph nodes (PLNs) or ankle soft tissues of curdlan-SKG mice treated with or without PX-478 (n = 7 mice per group). NP Frequencies of CD4+ T cells expressing IL-17A, IL-22, and GM-CSF in PLNs isolated from PBS-SKG or curdlan-SKG mice treated with or without PX-478 at 8 weeks after the curdlan injection (n = 6 mice per group). Scale bars, 100 μm (D, E, H). The data shown in C, F, IP are presented as the means ± SEMs. Relative data were log-transformed before statistical analyses. Statistical analyses were performed using the Kruskal‒Wallis test followed by the two-stage linear step-up procedure of Benjamini, Krieger and Yekutieli post hoc tests (C, F, I, J, L); Brown–Forsythe and Welch’s ANOVA tests followed by the two-stage linear step-up procedure of Benjamini, Krieger and Yekutieli post hoc tests (K, NP); and Mann‒Whitney U-tests (M). *P (or q) < 0.05 and **P (or q) < 0.01
Fig. 4
Fig. 4
IL-23-overexpressing SKG mice exhibit SpA pathology with enhanced type 3 immunity. A Schematic image of IL-23 plasmid (PLM) or CTL PLM administration to SKG mice. B Representative images of IHC staining showing the expression of IL-23 p19 in livers isolated from CTL PLM-injected mice or IL-23 PLM-injected SKG mice at 4 weeks after the PLM injection. CE Representative images showing clinical symptoms (blepharitis, psoriasis-like dermatitis, and arthritis) in CTL PLM-injected or IL-23 PLM-injected SKG mice at 2, 5, and 8 weeks after the PLM injection. F Clinical scores of SKG mice injected with the CTL PLM or IL-23 PLM (n = 10 mice per group). G, H Representative histological images [hematoxylin and eosin (H&E) staining; G)] and scores (H; n = 10 mice per group) for ankle joints and tail vertebrae of SKG mice injected with the CTL PLM or IL-23 PLM at 8 weeks after the PLM injection. I Serum concentrations of IL-23 and IL-17A in SKG mice injected with the CTL PLM or IL-23 PLM over 8 weeks after the PLM injection (n = 5 mice per group). J, K Representative microCT images showing ankle joints and tail vertebrae in SKG mice injected with the CTL PLM or IL-23 PLM at 8 weeks after the PLM injection (the yellow arrow indicates NBF). L, M Representative histological images showing new bone formation [NBF, safranin O/fast green (SO/FG; L) staining] and SOX9 expression (IHC; M) in the ankle joints of SKG mice injected with the CTL PLM or IL-23 PLM at 8 weeks after the PLM injection. NS Frequencies of CD4+ T cells expressing IL-17A, IL-22, IFN-γ, and GM-CSF in popliteal lymph nodes (PLNs) isolated from SKG mice at 8 weeks after the CTL PLM or IL-23 PLM injection (n = 5 mice per group). T Schematic image of IL-23 PLM or CTL PLM administration to Mif knockout (MIF KO; Mif/−) SKG mice. U Clinical scores of MIF KO SKG mice injected with the CTL PLM or IL-23 PLM (n = 10 mice per group). V Representative images of the clinical symptoms of IL-23 PLM-injected MIF KO SKG mice at 8 weeks after the PLM injection. W, X Representative histological images (H&E staining; W) and scores (X; n = 10 mice per group) for ankle joints and tail vertebrae in MIF-KO SKG mice injected with the CTL PLM or IL-23 PLM at 8 weeks after the PLM injection. Y Representative microCT images showing ankle joints and tail vertebrae in MIF KO SKG mice injected with the CTL PLM or IL-23 PLM at 8 weeks after the PLM injection. Z Frequencies of CD4+ T cells expressing IL-17A, IL-22, IFN-γ, and GM-CSF in PLNs isolated from MIF KO SKG mice at 8 weeks after the CTL PLM or IL-23 PLM injection (n = 5 mice per group). Scale bars, 100 μm (B, G, L, M, W). The data shown in F, H, I, O, Q, S, U, X, Z are presented as the means ± SEMs. Relative data were log-transformed before statistical analyses. Statistical analyses were performed using Kruskal‒Wallis tests followed by the two-stage linear step-up procedure of Benjamini, Krieger and Yekutieli post hoc tests (F, I, U), Mann‒Whitney U-tests (H, X), or two-tailed paired t tests (O, Q, S, Z). *P (or q) < 0.05 and **P (or q) < 0.01
Fig. 5
Fig. 5
Exogenous MIF stimulation enhances chondrogenesis in vitro and in vivo. A Representative image of new bone formation (NBF) detected with safranin O/fast green (SO/FG) staining in the distal tibia of curdlan-treated SKG (curdlan-SKG) mice. B Histological images of hematoxylin and eosin (H&E) staining showing infiltrated neutrophils in the area of NBF of curdlan-SKG mice. C Representative image of IF staining showing the expression of Ly6G and IL-23 around the area of NBF in curdlan-SKG mice. D Schematic image of the isolation and cell culture of tibial periosteal cells (PCs) from SKG mice. E Representative micrographs showing PCs originating from the tibia over 15 days (the lower layer shows negative controls where PCs were removed from the bone surface before cell culture). F, G Gene expression of endochondral ossification (ECO) markers in PCs treated with recombinant mouse MIF (rmMIF; 0, 10, 50 and 100 ng/ml) (n = 4 samples per group). Representative immunoblot images showing the expression of SOX9 and RUNX2 (H) and densitometric analysis adjusted to the β-actin level (I) in PCs treated with or without rmMIF for 24 h (n = 4 samples per group). J Representative images of IF staining showing COL2A1 expression in PCs cultured in chondrogenic differentiation (ChD) media with or without rmMIF (50 ng/ml) for 12 days. K, L Representative immunoblot images showing the expression of SOX9, FGF18, and RUNX2 in SKG tibia-talus tenocytes treated with or without rmMIF for 24 h (K), and densitometry values adjusted to that of β-actin (L; n = 4 samples per group). M Representative images of IHC staining showing the expression of SOX9 in the periosteum of SKG mice injected with the MIF plasmid (MIF PLM; 5 µg/mouse). The arrows show cells positive for SOX9. N Representative images of IHC staining showing the expression of SOX9 in the entheses of control PLM- or MIF PLM-injected SKG mice. The arrow shows cells positive for SOX9. O Representative images of SO/FG staining showing the expression of proteoglycans in the entheses of SKG mice injected with the control PLM or MIF PLM. Scale bars, 100 µm [A, B (left and middle panels), E, J, and M to O] or 10 µm [B (right panel) and C]. The data shown in F, G, I, L are presented as the means ± SEMs. Relative data were log-transformed before statistical analyses. Statistical analyses were performed using one-way analysis of variance (ANOVA) tests with Geisser–Greenhouse corrections followed by the two-stage linear step-up procedure of Benjamini, Krieger and Yekutieli post hoc tests (F, G) or two-tailed unpaired t-tests (I, L; n = 4 samples per group). *P (q) < 0.05 and **P (q) < 0.01. NS not significant
Fig. 6
Fig. 6
IL-23 promotes chondrogenesis in periosteal cells (PCs) in the presence of MIF. A Gene expression of endochondral ossification (ECO) markers in PCs treated with recombinant mouse (rm) IL-17A or IL-23 (0, 10, 50, 100 ng/ml) for 24 h (n = 4 samples per group). B, C Representative immunoblot image showing the expression of SOX9 in wild-type (WT; Mif+/+, B) PCs treated with rmIL-23 for 24 h (B), and densitometry value adjusted to that of GAPDH (C; n = 4 samples per group). D Representative immunoblot image showing the expression of SOX9 in MIF knockout (MIF KO; Mif−/−, D) PCs treated with rmIL-23 for 24 h. EJ Gene expression of ECO markers (Sox9, Col2a1, and Acan) and IL-23-binding receptors (Il23r and Il12rb1) in PCs cultured with rmMIF (50 ng/ml) and rmIL-23 (100 ng/ml) in chondrogenic differentiation (ChD) media under hypoxic conditions (2% O2) for 3 (E and H), 6 (F and I), and 12 (G, J) days (n = 3 samples per group). K Expression of the Sox9 mRNA in PCs treated with or without rmIL-23 in the presence or absence of anti-IL-23 p19 antibodies (n = 3 samples per group). L Representative immunoblot images showing SOX9 protein expression in PCs cultured with rmMIF (50 ng/ml) and rmIL-23 (100 ng/ml) in ChD media under hypoxic conditions (2% O2) for 3, 6, and 12 days. M Densitometry analysis of SOX9 protein expression in WT PCs cultured with or without rmMIF and rmIL-23 in ChD media under hypoxic conditions for 3 days (n = 3 samples per group). The data shown in A, C, E, K, M are presented as the means ± SEMs. Relative data were log-transformed before statistical analyses. Statistical analyses were performed using one-way analysis of variance (ANOVA) with Geisser–Greenhouse corrections followed by the two-stage linear step-up procedure of Benjamini, Krieger and Yekutieli post hoc tests (A, K, M) or two-way ANOVA tests with Geisser–Greenhouse corrections (EJ). *P (q) < 0.05 and **P (q) < 0.01
Fig. 7
Fig. 7
MIF and HIF1A increase chondrogenesis and cell proliferation through the activation of STAT3. A Representative image of safranin O/fast green (SO/FG) staining showing new bone formation (NBF) through endochondral ossification (ECO) in the distal tibia of curdlan-SKG mice. Boxes indicate the chondrocyte area (area 1) and nonchondrocyte area (area 2) of NBF. B, C Representative images of immunofluorescence staining showing the expression of MIF and HIF1A around the chondrocyte or nonchondrocyte areas of NBF. D Representative image of IHC staining showing the expression of SOX9 around the chondrocyte or nonchondrocyte areas of NBF. Representative immunoblot images showing the expression of SOX9 and HIF1A in WT PCs stimulated with IL-23 (100 ng/ml) with or without PX-478 (5 µM) treatment for 96 h (E), and densitometry values (F) adjusted to the expression of β-actin (n = 4 samples per group). G In silico analysis identifying transcription factors (TFs) that target HIF1A (red dots indicate TFs previously identified in SpA GWASs). H Representative immunoblot images showing the expression of phospho-STAT3 (p-STAT3) and STAT3 in spinal bone-derived cells isolated from patients with osteoarthritis (OA) or spondyloarthritis (SpA (n = 5 samples per group). I Expression of the STAT3 mRNA in spinal bone-derived cells isolated from patients with OA or SpA (n = 5 samples per group). J Representative images of IHC staining showing STAT3-positive spinal bone tissues from patients with OA or SpA. K Representative images of H&E staining and IHC staining for p-STAT3 in curdlan-SKG mice. Representative immunoblot images showing the expression of p-STAT3, STAT3, C-MYC and PARP p85 in WT PCs treated with or without rmMIF (50 ng/ml) under normoxic (21% O2) conditions for 24 h (L), and densitometric analysis (M) adjusted to the GAPDH levels (n = 4 samples per group). N Representative immunoblot images showing the expression of p-STAT3, STAT3, and SOX9 in wild-type WT PCs treated with or without rmMIF (50 ng/ml) in the presence of a control (CTL) siRNA or STAT3 siRNA under normoxic (21% O2) conditions for 48 h. O Representative immunoblot images showing the expression of p-STAT3 and STAT3 in wild-type WT PCs treated with or without rmMIF (50 ng/ml) under normoxic (21% O2) or hypoxic (2% O2) conditions for 96 h. P Representative immunoblot images showing the expression of SOX9 and HIF1A in WT PCs treated with or without rmMIF (50 ng/ml) in the presence of the CTL siRNA or STAT3 siRNA under hypoxic (2% O2) conditions for 96 h. Scale bars, 100 µm [A, B, C (except for the right panel; 10 µm)], D, J, K]. The data shown in F, I, M are presented as the means ± SEMs. Relative data were log-transformed before statistical analyses. Statistical analyses were performed using two-way ANOVA with Geisser–Greenhouse corrections followed by the two-stage linear step-up procedure of Benjamini, Krieger and Yekutieli post hoc tests (F) or two-tailed paired t tests (I, M). *P (q) < 0.05 and **P (q) < 0.01
Fig. 8
Fig. 8
Potential mechanisms of HIF1A-driven inflammation and new bone formation (NBF) in individuals with SpA. In low-oxygen areas of inflamed tissues, neutrophils increase the production of HIF1A, MIF, and IL-23. The MIF and IL-23 proteins trigger a type 3 immune response that boosts inflammation and causes psoriasis. In joint tissues, MIF and IL-23 increase the expression of HIF1A. Furthermore, MIF and IL-23 secreted from neutrophils also prompt the transformation of certain cell types, including mesenchymal stromal progeny, such as periosteal and tenocyte/ligamental cells, into chondrocytes. This process is mediated by STAT3 and involves increased expression of HIF1A. Therefore, inhibiting HIF1A with a pharmacological compound, such as PX-478, has the potential to reduce both inflammation and NBF in patients with SpA

References

    1. Ranganathan V, Gracey E, Brown MA, Inman RD, Haroon N. Pathogenesis of ankylosing spondylitis - recent advances and future directions. Nat Rev Rheumatol. 2017;13:359–67. - PubMed
    1. Gravallese EM, Schett G. Effects of the IL-23-IL-17 pathway on bone in spondyloarthritis. Nat Rev Rheumatol. 2018;14:631–40. - PubMed
    1. Nakamura A, Haroon N. Recent updates in the immunopathology of type 3 immunity-mediated enthesitis. Curr Rheumatol Rep. 2021;23:31. - PubMed
    1. Braun J, Baraliakos X, Deodhar A, Poddubnyy D, Emery P, Delicha EM, et al. Secukinumab shows sustained efficacy and low structural progression in ankylosing spondylitis: 4-year results from the MEASURE 1 study. Rheumatology. 2019;58:859–68. - PMC - PubMed
    1. Deodhar A, Helliwell PS, Boehncke W-H, Kollmeier AP, Hsia EC, Subramanian RA, et al. Guselkumab in patients with active psoriatic arthritis who were biologic-naive or had previously received TNFα inhibitor treatment (DISCOVER-1): a double-blind, randomised, placebo-controlled phase 3 trial. Lancet. 2020;395:1115–25. - PubMed

MeSH terms

LinkOut - more resources