. 2024 Aug;21(8):807-825.
doi: 10.1038/s41423-024-01180-8. Epub 2024 Jun 5.

TL1A and IL-18 synergy promotes GM-CSF-dependent thymic granulopoiesis in mice

Affiliations

TL1A and IL-18 synergy promotes GM-CSF-dependent thymic granulopoiesis in mice

Mario Ruiz Pérez et al. Cell Mol Immunol. 2024 Aug.

Abstract

Acute systemic inflammation critically alters the function of the immune system, often promoting myelopoiesis at the expense of lymphopoiesis. In the thymus, systemic inflammation results in acute thymic atrophy and, consequently, impaired T-lymphopoiesis. The mechanism by which systemic inflammation impacts the thymus beyond suppressing T-cell development is still unclear. Here, we describe how the synergism between TL1A and IL-18 suppresses T-lymphopoiesis to promote thymic myelopoiesis. The protein levels of these two cytokines were elevated in the thymus during viral-induced thymus atrophy infection with murine cytomegalovirus (MCMV) or pneumonia virus of mice (PVM). In vivo administration of TL1A and IL-18 induced acute thymic atrophy, while thymic neutrophils expanded. Fate mapping with Ms4a3-Cre mice demonstrated that thymic neutrophils emerge from thymic granulocyte-monocyte progenitors (GMPs), while Rag1-Cre fate mapping revealed a common developmental path with lymphocytes. These effects could be modeled ex vivo using neonatal thymic organ cultures (NTOCs), where TL1A and IL-18 synergistically enhanced neutrophil production and egress. NOTCH blockade by the LY411575 inhibitor increased the number of neutrophils in the culture, indicating that NOTCH restricted steady-state thymic granulopoiesis. To promote myelopoiesis, TL1A, and IL-18 synergistically increased GM-CSF levels in the NTOC, which was mainly produced by thymic ILC1s. In support, TL1A- and IL-18-induced granulopoiesis was completely prevented in NTOCs derived from Csf2rb-/- mice and by GM-CSFR antibody blockade, revealing that GM-CSF is the essential factor driving thymic granulopoiesis. Taken together, our findings reveal that TL1A and IL-18 synergism induce acute thymus atrophy while promoting extramedullary thymic granulopoiesis in a NOTCH and GM-CSF-controlled manner.

Keywords: Cytokine synergy; Emergency granulopoiesis; Thymic GMP; Thymic Neutrophils; Thymus atrophy.


Conflict of interest statement

The authors declare no competing interests.

Figures

Fig. 1
Fig. 1
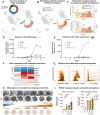
TL1A and IL-18 synergistically induce neonatal acute thymic atrophy and ex vivo neutrophil expansion. A Schematic of the cytokine injection model. P3 neonatal pups were IP injected with: (1) PBS (vehicle), (2) IL-18 [100 ng/ml], (3) TL1A [250 ng/ml], or (4) TL1A + IL-18 for two consecutive days in a volume of 20 µl. B Effect of TL1A and IL-18 on neonates (P3). Top-left panel: sizes of the neonates (P5) after two injections of the different cytokine treatments. Bottom-left panel: corresponding sizes of the neonatal thymuses. Right panel: quantification of thymic T-cell counts. (n = 3). The data are representative of one of at least five independent experiments. The error bars represent the SDs. C Schematic of neonatal thymic organ culture (NTOC). Thymuses from neonatal wild-type mice (P0.5) were isolated and cultured in the presence of (1) PBS (vehicle), (2) IL-18 [40 ng/ml], (3) TL1A [100 ng/ml], or (4) TL1A + IL-18. The cells remaining in the thymus lobes or egressing into the supernatant were analyzed by flow cytometry. D Flow cytometric analysis of neonatal thymuses and egressing cells after 6 days of culture. The cellular compositions of the thymic lobes (left panel) and supernatant (right panel) are shown. Lin- was defined as CD4-CD8β-CD3ε-TCRβ-TCRδγ-CD19-Ter-119-CD11b-Ly-6G-CD11c-F4/80-MHC-II-. (n = 4). The data are representative of one of at least ten independent experiments. Error bars represent the SEM. E Transmission electron microscopy (TEM) analysis of cells sorted from the supernatants of NCOCs on Day 6. (1) Proliferating T cells (chromatin condensation is highlighted by arrows). (2) Mature neutrophil as characterized by its nuclear morphology. (3) Band cell phagocytosing two corpses (indicated by arrows). (4) Myeloid cell as defined by its size (8 µm) and its extensive cytoplasm and dendrite-like projections. Image (1) was collected from samples of the NTOC supernatant on Day 6 of treatment with PBS (vehicle), and images (2–4) were collected from samples of the NTOC supernatant on Day 6 treated with TL1A + IL-18. F Cellular indexing of transcriptomes and epitopes (CITE-Seq) of sorted cells from the NTOC supernatant on Day 6. UMAP representation of the cellular landscape of thymic-egressing cells in the NTOC supernatant on Day 6 subjected to the different treatments. Unsupervised clustering was performed by Seurat (“Findclusters” function, 1.8 resolution) and subsequently manually curated. T cells were divided into seven clusters and are shown in different shades of green. Monocytes/macrophages were subdivided into seven clusters and are depicted in different shades of blue. Neutrophils were divided into three clusters and are represented in shades of orange. Dendritic cells (DCs), plasmacytoid dendritic cells (pDCs), and B cells are depicted in shades of yellow. G Heatmap of the manually curated genes that define the cellular identity of the 20 clusters shown in (F). H Deconvoluted UMAPs of the four different conditions that compose the aggregate shown in (G). The 20 defined clusters were grouped into four metaclusters: T cells (green), monocytes/macrophages (blue), neutrophils (orange/red), and others (DCs and B cells, in yellow). From left to right, we show egressing cells in supernatants treated with vehicle, TL1A, IL-18 or TL1A + IL-18. The black arrows highlight significant changes in the metacluster proportions between treatments. Statistics: (B) One-way ANOVA, *p < 0.05, **p < 0.01, ***p < 0.001, ****p < 0.0001. scRNA-seq single-cell RNA sequencing, UMAP uniform manifold approximation and projection plot, DP T cells double-positive T cells (CD4 + CD8 + ), Tregs regulatory T cells, Prolif. T cells proliferative T cells, Imm. Mo immature monocytes, Mo Ccr2+ Ccr2+ Monocytes, Mϕ Macrophages, Proinf. Mϕ proinflammatory macrophages, Chem. Prod. Mϕ chemokine-producing macrophages, preNeutrophils preneutrophils, imm. Neu immature neutrophils, mat. Neu mature neutrophils, DCs dendritic cells, pDCs plasmacytoid dendritic cells, DE differentially expressed
Fig. 2
Fig. 2
In vivo administration of TL1A + IL-18 results in acute thymic atrophy and increased thymic neutrophil numbers in neonatal and adult mice. A Schematic of the experimental model of TL1A + IL-18 injection in neonatal mice. Wild-type (WT) neonatal mice (P3) were IP injected with either PBS (vehicle) or TL1A [250 ng/day] + IL-18 [100 ng/day] for 4 consecutive days in a final volume of 20 µl. B Schematic of the experimental model of TL1A + IL-18 injection in adult mice (8 weeks old). WT mice were IP injected with either vehicle (PBS) or TL1A [1 µg/day] + IL-18 [750 ng/day] for 4 consecutive days in a final volume of 200 µl. C Body weights of neonates (P7) injected with either PBS (vehicle) or TL1A + IL-18 (n = 10). Data representative of one of at least five independent experiments are shown. D Pictures of thymuses from neonates (P7) injected with either PBS (vehicle) or TL1A + IL-18. E Thymic cellularity of neonates (P7) injected with either PBS (vehicle) or TL1A + IL-18. (n = 10). Data representative of one of at least five independent experiments are shown. F Quantification of neutrophil numbers in neonatal mice (P7) injected with PBS (gray) or TL1A + IL-18 (blue). Neutrophils were defined as Lin-CD11b+Ly-6G+ cells. The number of neutrophils in the complete thymus was quantified (n = 10). Data are representative of one of at least five independent experiments. G Body weights of adult model mice on Day 5 (D5) that were injected with either PBS (vehicle) or TL1A + IL-18 (n = 10). Data representative of one of at least five independent experiments are shown. H Pictures of thymuses from adults (D5) injected with either PBS (vehicle) or TL1A + IL-18. I Thymic cellularity of adult thymuses (D5) injected with either PBS (vehicle) or TL1A + IL-18 (n = 10). Data representative of one of at least five independent experiments are shown. J Quantification of the neutrophil numbers in adult mice (D5) injected with PBS (gray) or TL1A + IL-18 (blue). Neutrophils were defined as Lin-CD11b+Ly-6G+ cells. Neutrophil numbers were quantified from complete thymuses (n = 8). Data representative of one of at least five independent experiments are shown. Statistics: (C, E, G, I) Unpaired t test with Welch’s correction. EJ The error bars represent the SDs. FJ The Mann–Whitney U test was performed, as the standard deviations were different between treatment groups. * p < 0.05, ** p < 0.01, *** p < 0.001, **** p < 0.0001
Fig. 3
Fig. 3
Thymic neutrophils develop and mature in situ in the neonatal thymic organ culture, and NOTCH restricts their development. A UMAP representation of scRNAseq cell cycle analysis of the three neutrophil clusters. Phase G2/M cells are shown in green. Phase G1 cells are shown in red. Phase S cells are shown in blue. The black arrow highlights neutrophils in phase G2/M (undergoing mitosis), defined as “pre-Neutrophils” (preNeu) in Fig. 1F. B Slingshot trajectory analysis of thymic neutrophils in organ culture. A trajectory from preNeu → imm. Neu → mat. Neu was identified. C Pseudotime analysis (“Slingshot” package) of genes and transcription factors involved in thymic neutrophil development. Kinetics of neutrophil numbers in the NTOC lobes (D) and supernatant (E) during the 6 days of culture with different cytokine treatments. (n = 3). Data representative of one of at least three independent experiments are shown. Error bars represent the SEM. F Heatmap of genes associated with neutrophil maturation. G Flow cytometry characterization of the expression of CD62L, CXCR4, and CD101 in newly generated neutrophils in the NTOC lobes from Day 3 to Day 6 after treatment with TL1A + IL-18. Histograms were set in modal mode. (n = 3). Data representative of one of at least three independent experiments are shown. H EM images from magnetically isolated neonatal bone marrow neutrophils and sorted Ly-6G+ cell NTOC supernatant treated with TL1A + IL-18 on Day 6. The different nuclear morphologies reveal distinct maturation stages of neutrophil development. I NOTCH negatively regulates neutrophil development in the thymus. NTOCs were treated with (1) control (PBS), (2) 1 µM, (3) 5 µM, or (4) 10 µM of the γ-secretase inhibitor LY411575, which prevents NOTCH signaling activation. (n = 3). Data representative of one out of three independent experiments are shown. The error bars represent the SDs. Statistics: (I) One-way ANOVA, * p < 0.05, ** p < 0.01, *** p < 0.001, **** p < 0.0001. TEM transmission electron microscopy
Fig. 4
Fig. 4
Rag1-Cre and Ms4a3-Cre fate mapping reveals that thymic neutrophils emerge from Rag1+ thymic GMPs. A Characterization of the history of Rag1 expression in adult (8-week-old) neutrophils (defined as Ly-6G+ CD11b+) in the bone marrow, blood, spleen, lung, and thymus using the Rag1-Cre genetic model (Supplementary Fig. 7a). The YFP- fraction is shown in gray, and the YFP+ fraction is shown in yellow. The quantification of the percentage of Rag1-Cre YFP+ neutrophils across organs is shown on the right (n, indicated in the figure. n = 19 for thymus, n = 12 for bone marrow, spleen and lungs, n = 11 for blood). The data were pooled from five independent experiments. B Flow cytometric characterization of the different progenitor populations found in the adult thymus. Thymuses from 8-week-old Rag1-Cre+/tg Rosa26YFP+/tg mice were isolated and subjected to negative bead depletion to enrich Lin- cells. The gating of double-negative thymocytes (DNs) is shown on the left. DN1 (Lin-CD44+CD25-), DN2 (Lin-CD44+CD25+), DN3 (Lin-CD44-CD25+), and DN4 (Lin-CD44-CD25-). Thereafter, DN1s were further dissected, and by using Ly-6A/E (Sca-1) and c-Kit (CD117), we defined the progenitors deeper into the LSK gate (Lin- Sca-1+ and c-Kit+, in brown) and the Lin-c-kit+Sca-1- progenitors. LSK cells were divided into common lymphoid progenitors (CLPs), defined as Lin-CD44+Sca-1+c-Kit+IL-7Rα+CD34- (in green), and lympho-myeloid primed progenitors (LMPPs), defined as Lin-CD44+Sca-1+c-Kit+IL-7Rαlow/-CD34+ (in orange). Granulocyte–monocyte progenitors (GMPs) were defined as Lin-Sca-1-c-Kit+CD16/32+CD34+ (in red), as described previously [55]. Progenitors in the bone marrow were defined with the same gating strategy, as indicated in Supplementary Fig. 7c. Lin- is defined as CD19-Ter-119-CD11c-CD11b-MHC-II-F4/80-Ly-6G-CD4-CD8b-TCRβ-TCRγδ-CD25-. C Frequencies of LMPPs, CLPs, and GMPs within the Lin-c-Kit+ fraction in the thymus and bone marrow of adults. (n = 3). Data representative of one of three independent experiments are shown. D Characterization of the history of Rag1 expression in adult thymic LMPPs (left plot) and GMPs (right plot). Lin- was defined as CD19-Ter-119-CD11c-CD11b-MHC-II-F4/80-Ly-6G-CD4-CD8b-TCRβ-TCRγδ-CD25-. (n = 3). Data representative of one of three independent experiments are shown. E Fate-mapping characterization of the expression of Ms4a3-Cre in adult thymic and bone marrow neutrophils. Neutrophils (shown in red) were gated as Ly-6G+CD11b+ cells. (n = 8). Data representative of one of two independent experiments are shown. F Schematic of the proposed developmental model for thymic neutrophils. Statistics: (A, C, D, E) Error bars represent SEM. A One-way ANOVA; D unpaired t test with Welch correction. * p < 0.05, ** p < 0.01, *** p < 0.001, **** p < 0.0001. BM bone marrow, CLPs common lymphoid progenitors, LMPPs lymphoid-primed progenitors, GMPs granulocyte-monocyte progenitors
Fig. 5
Fig. 5
Thymic neutrophils can phagocytose, produce ROS, migrate, and form NETs similar to benchmark peritoneal neutrophils. A Schematic of the experimental design used to assess the ROS production capacity, phagocytosis, migration, and NET formation of thymic neutrophils compared to those of peritoneal neutrophils. Thymic neutrophils were isolated from NTOC supernatants treated for 6 days with TL1A + IL-18. Adult peritoneal neutrophils were isolated 4 h after IP injection of 1 ml of 3% Brewer thioglycolate. Neutrophils were purified using an EasySep™ Mouse Neutrophil Enrichment Kit. Isolated peritoneal and thymic neutrophils were treated with PBS, eBioscience™ Cell Stimulation Cocktail (1:500), DHR 123 [5 µM], pHrodo particles from S. aureus [1 mg/mL], cytochalastin D [2 µM], DMSO, LPS [4 µg/ml] from Klebsiella pneumoniae, and ionomycin [2.5 µg/ml]. B ROS production assay. Both TL1A- and IL-18-induced NTOC-derived and peritoneal neutrophils were treated with DHR 123 [5 µM] at 37 °C and 5% CO2 for 30 min. The fluorescence intensities were measured in channel B530 and are displayed as histograms. The Y-axes are normalized to the mode. Data representative of one of two experiments are shown. C Heatmap of manually curated neutrophil ROS-related genes. D Phagocytosis assay. TL1A + IL-18-induced, NTOC-derived, and peritoneal neutrophils were incubated with PE-conjugated pHrodo particles from S. aureus for 60 min and treated with cytochalastin D [2 µM] to inhibit phagocytosis. The number of engulfment events was normalized to the cell count. Data representative of one of two experiments are shown. E Heatmap of manually curated neutrophil phagocytosis genes. F Migration assay. TL1A + IL-18-induced, NTOC-derived, and peritoneal neutrophils were seeded at 150,000 cells/well on top of a 12-well Transwell plate with 5.0 µm pores and incubated with the neutrophil chemoattractants CXCL1 [50 ng/mL] and fMLP [10 µM] at 37 °C and 5% CO2 for 90 min. The migrated cells were counted in a BD FACSVerse™ Cell Analyzer. Data representative of one of two experiments are shown. G Heatmap of manually curated neutrophil migration-related genes. H Confocal images of thymic neutrophils isolated from the supernatants of TL1A + IL-18-stimulated NCTs (Day 6) and treated with DMSO (vehicle) or ionomycin for 4 h. The cells were stained with DAPI, SYTOX Green, and antibodies for detecting neutrophil elastase and citrullinated histone 3 (citH3). The scale bar represents 10 µM. (n = 3). Data representative of one of three independent experiments are shown. I Heatmap representation of the genes associated with primary/azurophilic, secondary/specific, tertiary/gelatinase or secretory granule release by NTOC-derived neutrophils. Statistics: (F) One-way ANOVA, * p < 0.05, ** p < 0.01, *** p < 0.001, **** p < 0.0001. C, E, G The Y-axes were subjected to hierarchical clustering. NET Neutrophil extracellular trap
Fig. 6
Fig. 6
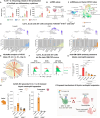
Thymic neutrophil expansion is dependent on GM-CSF. A Multiplex cytokine levels in NTOC supernatants of thymic lobes on Day 6 after treatment with (1) vehicle (green), (2) TL1A (blue), (3) IL-18 (yellow), or (4) TL1A + IL-18 (red). From left to right, we measured GM-CSF, IL-17A and IFN-γ in NTOC supernatants (n = 6). The results shown are combined from three independent experiments. Error bars represent the SEM. B Schematic of the experimental design used for scRNA-seq analysis of the neonatal thymic lobes during the early phase of culture (Days 0–3). We collected (1) neonatal thymuses from wild-type mice on the day of birth (P0.5), (2) thymic lobes cultured in the NTOC for 1.5 days treated with PBS (vehicle), (3) thymic lobes cultured in the NTOC for 1.5 days treated with TL1A + IL-18, (4) thymic lobes cultured in the NTOC for 3 days treated with PBS (vehicle), and (6) thymic lobes cultured in the NTOC for 3 days treated with TL1A + IL-18 (see Supplementary Fig. 9b). The samples were further processed as described in the Supplementary methods. C Convoluted UMAP of the aggregates of all the samples: (1) neonatal thymus (P0.5), (2) NTOC vehicle - Day 1.5, (3) NTOC TL1A + IL-18 - Day 1.5, (4) NTOC vehicle - Day 3, and (5) NTOC TL1A + IL-18 - Day 3. Unsupervised clustering was performed by Seurat (“Findclusters” function, 1.8 resolution) and subsequently manually curated and grouped into 19 clusters. D Feature plots of the gene expression levels of Tnfrsf25 (encoding DR3), Il18r1 (encoding IL-18Rα), and Csf2 (encoding GM-CSF) and corresponding stacked-bar plots with the quantified percentages of Tnfrsf25-, Il18r1-, and Csf2-expressing cells across clusters. E NicheNet analysis of the predicted ligand‒receptor pair interactions between γδ T cells and both ILCs (sender cells) and neutrophils (receivers). The predicted interaction between Csf2 (from ILCs) and Csf2rb (neutrophils), one of the top hits, is highlighted in red. F Intracellular flow cytometry was performed to identify GM-CSF-producing subsets in the NTOC. Thymic lobes were cultured for 3 days and treated with either (1) vehicle or (2) TL1A + IL-18. We show the GM-CSF production capacity of ILC1s [defined as Lin-CD122+CD49α+], ILC2s [defined as Lin-ST2+], γδT cells [defined as CD3ε+γδTCR+] (all populations DR3+IL-18Rα+, as previously shown) and monocytes/macrophages [defined as CD11b+ F4/80+] via histograms. (n = 4). Data representative of one of seven independent experiments are shown. G GM-CSFR antibody blockade in the NTOC supernatant on Day 6 of culture. NTOCs were treated with (1) vehicle (PBS), (2) TL1A + IL-18 (as previously described), (3) TL1A + IL-18+α-GM-CSFR [200 ng/ml], (4) TL1A + IL-18+α-GM-CSFR [500 ng/ml], (5) TL1A + IL-18+α-GM-CSFR [1 µg/ml], or (6) TL1A + IL-18+α-GM-CSFR [2 µg/ml] (n = 3). The results shown represent one out of three independent experiments. H NTOC culture of thymic lobes from Csf2rb-/- mice. The number of expanded neutrophils in response to TL1A + IL-18 treatment versus vehicle (control) treatment was quantified in Csf2rb-/- versus Csf2rb-/+ littermates. (Csf2rb+/- mice treated with vehicle, n = 3). Csf2rb+/- mice treated with TL1A + IL-18, n = 8. Csf2rb-/- mice treated with vehicle, n = 10. Csf2rb+/- mice treated with TL1A + IL-18, n = 12. The results shown are a combination of two independent experiments. The error bars represent the SDs. I Proposed cellular mechanism of thymic neutrophil expansion in response to the synergistic effect of TL1A and IL-18. Statistics: (A, G, H) One-way ANOVA, * p < 0.05, ** p < 0.01, *** p < 0.001, **** p < 0.0001. Mo/Macs Monocytes/Macrophages
Fig. 7
Fig. 7
PVM and MCMV infection leads to acute thymus atrophy, TL1A and IL-18 upregulation, and an increased proportion of thymic neutrophils. A Schematic of the PVM infection model in adult-, wild-type-, female mice. WT mice were administered with either vehicle (PBS) or 17.5 PFU of PVM intratracheally (IT) in a final volume of 200 µl. Thymus size, cellularity, the expression levels of TL1A and IL-18, and the number of neutrophils were evaluated on Days 5, 10, and 14 after infection. B Schematic of the MCMV infection model in adult, wild-type, female mice. WT mice were intraperitoneally (IP) injected with either vehicle (PBS) or 1:30 PFU of MCMV in a final volume of 200 µl. Thymus size, cellularity, the levels of TL1A and IL-18, and the number of neutrophils were evaluated on Days 2, 5, and 8 after infection. C Percentages of body weight loss in mock (gray)- and PVM (purple)-infected mice during the course of the experiment. D Percentages of body weight loss in mock (gray)- and MCMV (blue)-infected mice during the course of the experiment. E Pictures of thymuses from mock-infected (gray) or PVM-infected (purple) mice on Days 5, 10, and 14 after infection. F Pictures of thymuses from mock-infected (gray) or MCMV-infected (blue) mice on Days 2, 5, and 8 of infection. G Cellularity of thymuses from mock-infected (gray) or PVM-infected (purple) mice on Days 5, 10, and 14 after infection. H Cellularity of thymuses from mock-infected (gray) or MCMV-infected (blue) mice on Days 2, 5, and 8 after infection. I Quantification of the levels of TL1A normalized to the mg of protein in the thymuses of mock-infected (gray) or PVM-infected (purple) mice at Days 5, 10, and 14 of infection. J Quantification of the levels of IL-18 normalized to the mg of protein in the thymuses of mock-infected (gray) or PVM-infected (purple) mice at Days 5, 10, and 14 of infection. K Quantification of the levels of TL1A normalized to the mg of protein in the thymuses of mock-infected (gray) or MCMV-infected (blue) mice on Days 2, 5, and 8 of infection. (L) Quantification of the levels of IL-18 normalized to the mg of protein in the thymuses of mock-infected (gray) or MCMV-infected (blue) mice on Days 2, 5, and 8 of infection. Statistics: (C, D) Unpaired t test with Welch’s correction. GL Two-way ANOVA. * p < 0.05, ** p < 0.01, *** p < 0.001, **** p < 0.0001. Data representative of one of two experiments are shown. Error bars represent the SEM

Similar articles

Cited by

References

    1. Zúñiga-Pflücker JC. T-cell development made simple. Nat Rev Immunol. 2004;4:67–72. 10.1038/nri1257. - PMC - PubMed
    1. Liang KL, Roels J, Lavaert M, Putteman T, Boehme L, Tilleman L, et al. Intrathymic dendritic cell-biased precursors promote human T cell lineage specification through IRF8-driven transmembrane TNF. Nat Immunol. 2023;24:474–86. 10.1038/s41590-022-01417-6. - PubMed
    1. Wang H, Zúñiga-Pflücker JC. Thymic microenvironment: interactions between innate immune cells and developing thymocytes. Front Immunol. 2022;13:1–9. 10.3389/fimmu.2022.885280. - PMC - PubMed
    1. Park JE, Botting RA, Domínguez Conde C, Popescu DM, Lavaert M, Kunz DJ, et al. A cell atlas of human thymic development defines T cell repertoire formation. Science. 2020;367. 10.1126/science.aay3224. - PMC - PubMed
    1. Rothenberg EV, Moore JE, Yui MA. Launching the T-cell-lineage developmental programme. Nat Rev Immunol. 2008;8:9–21. 10.1038/nri2232. - PMC - PubMed

Substances