

An integrated bioinformatic analysis of microarray datasets to identify biomarkers and miRNA-based regulatory networks in leishmaniasis
- PMID: 38839916
- PMCID: PMC11153516
- DOI: 10.1038/s41598-024-63462-5
An integrated bioinformatic analysis of microarray datasets to identify biomarkers and miRNA-based regulatory networks in leishmaniasis
Abstract
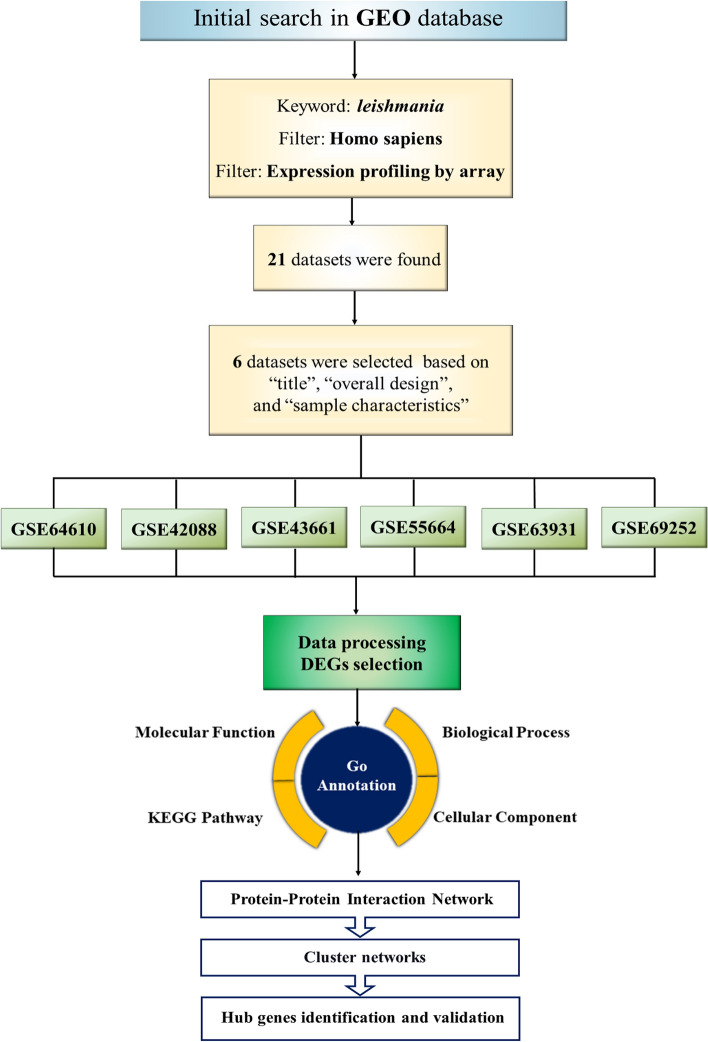
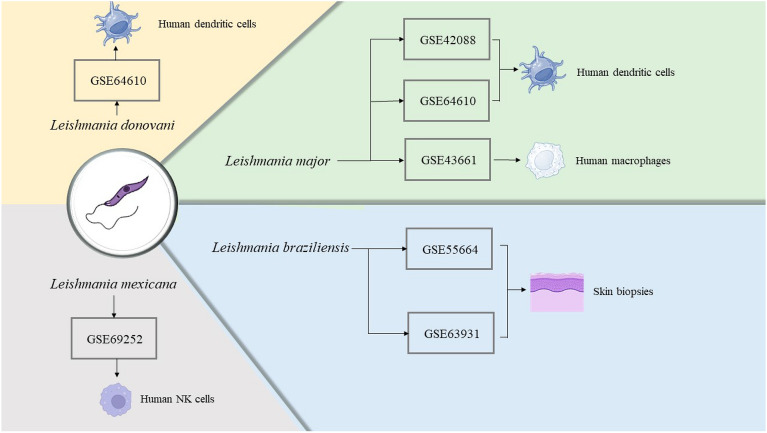
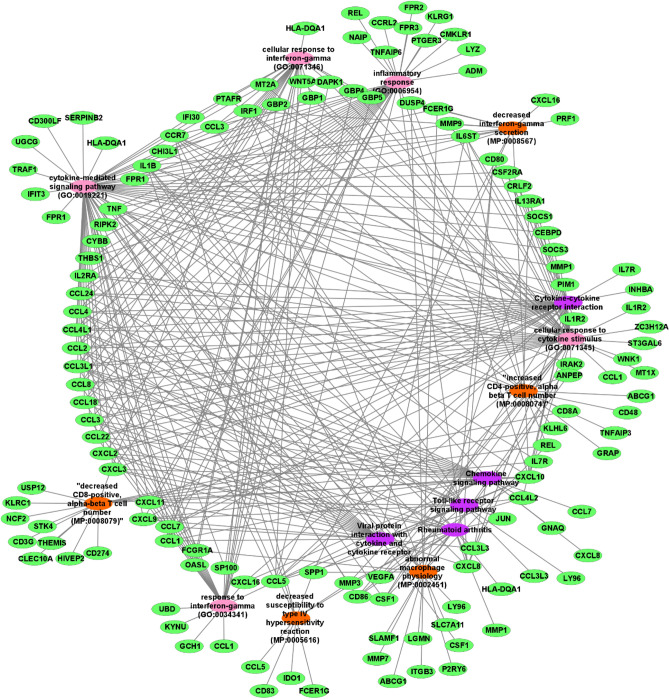
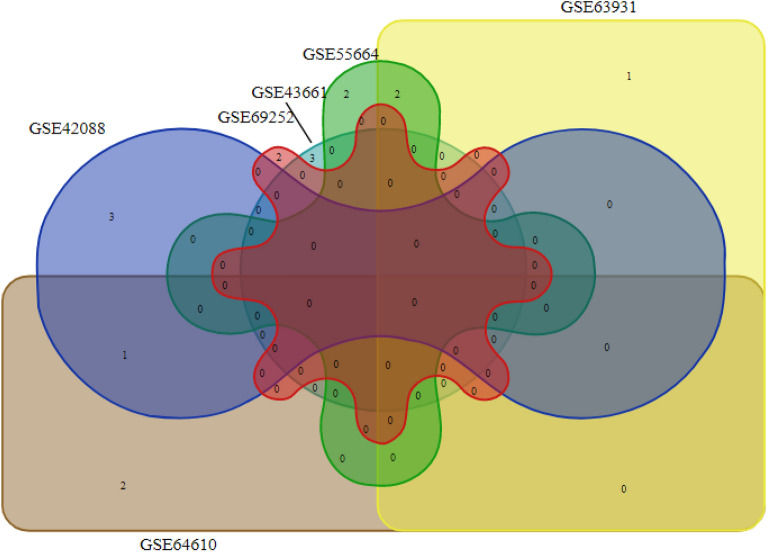
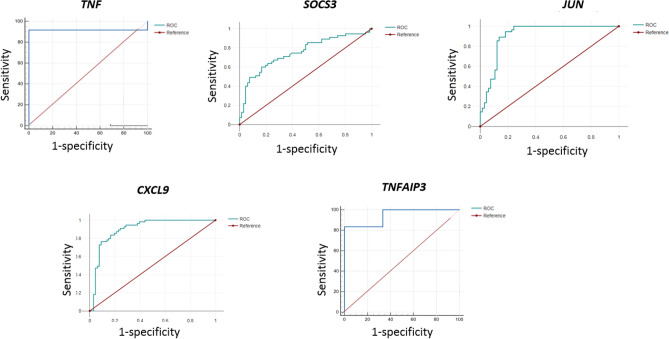
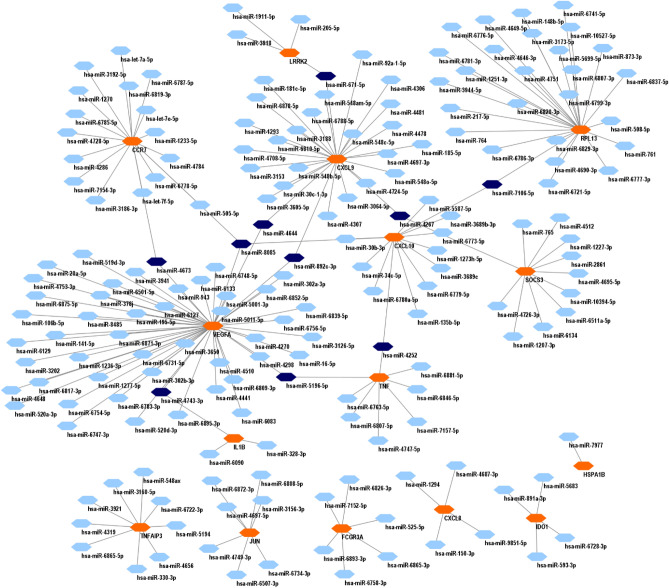
Micro RNAs (miRNAs, miRs) and relevant networks might exert crucial functions during differential host cell infection by the different Leishmania species. Thus, a bioinformatic analysis of microarray datasets was developed to identify pivotal shared biomarkers and miRNA-based regulatory networks for Leishmaniasis. A transcriptomic analysis by employing a comprehensive set of gene expression profiling microarrays was conducted to identify the key genes and miRNAs relevant for Leishmania spp. infections. Accordingly, the gene expression profiles of healthy human controls were compared with those of individuals infected with Leishmania mexicana, L. major, L. donovani, and L. braziliensis. The enrichment analysis for datasets was conducted by utilizing EnrichR database, and Protein-Protein Interaction (PPI) network to identify the hub genes. The prognostic value of hub genes was assessed by using receiver operating characteristic (ROC) curves. Finally, the miRNAs that interact with the hub genes were identified using miRTarBase, miRWalk, TargetScan, and miRNet. Differentially expressed genes were identified between the groups compared in this study. These genes were significantly enriched in inflammatory responses, cytokine-mediated signaling pathways and granulocyte and neutrophil chemotaxis responses. The identification of hub genes of recruited datasets suggested that TNF, SOCS3, JUN, TNFAIP3, and CXCL9 may serve as potential infection biomarkers and could deserve value as prognostic biomarkers for leishmaniasis. Additionally, inferred data from miRWalk revealed a significant degree of interaction of a number of miRNAs (hsa-miR-8085, hsa-miR-4673, hsa-miR-4743-3p, hsa-miR-892c-3p, hsa-miR-4644, hsa-miR-671-5p, hsa-miR-7106-5p, hsa-miR-4267, hsa-miR-5196-5p, and hsa-miR-4252) with the majority of the hub genes, suggesting such miRNAs play a crucial role afterwards parasite infection. The hub genes and hub miRNAs identified in this study could be potentially suggested as therapeutic targets or biomarkers for the management of leishmaniasis.
Keywords: Biomarkers; Gene expression profiling; Leishmaniasis; Microarray; Regulatory network; miRNA.
© 2024. The Author(s).
Conflict of interest statement
The authors declare no competing interests.
Figures
Similar articles
-
Determination of key hub genes in Leishmaniasis as potential factors in diagnosis and treatment based on a bioinformatics study.Sci Rep. 2024 Sep 28;14(1):22537. doi: 10.1038/s41598-024-73779-w. Sci Rep. 2024. PMID: 39342024 Free PMC article.
-
Identification of plasma miR-4505, miR-4743-5p and miR-4750-3p as novel diagnostic biomarkers for coronary artery disease in patients with type 2 diabetes mellitus: a case-control study.Cardiovasc Diabetol. 2024 Jul 29;23(1):278. doi: 10.1186/s12933-024-02374-0. Cardiovasc Diabetol. 2024. PMID: 39080630 Free PMC article.
-
Microarray data analysis on gene and miRNA expression to identify biomarkers in non-small cell lung cancer.BMC Cancer. 2020 Apr 16;20(1):329. doi: 10.1186/s12885-020-06829-x. BMC Cancer. 2020. PMID: 32299382 Free PMC article.
-
Identification of Candidate Biomarkers for Transplant Rejection from Transcriptome Data: A Systematic Review.Mol Diagn Ther. 2019 Aug;23(4):439-458. doi: 10.1007/s40291-019-00397-y. Mol Diagn Ther. 2019. PMID: 31054051
-
Progress in Precision Medicine for Head and Neck Cancer.Cancers (Basel). 2024 Nov 4;16(21):3716. doi: 10.3390/cancers16213716. Cancers (Basel). 2024. PMID: 39518152 Free PMC article. Review.
Cited by
-
Meta-analysis of microarray data to identify potential signature genes and MiRNAs associated with the pathogenesis of asthma.J Transl Med. 2025 Jul 15;23(1):796. doi: 10.1186/s12967-025-06646-5. J Transl Med. 2025. PMID: 40665411 Free PMC article.
References
MeSH terms
Substances
LinkOut - more resources
Full Text Sources
Medical
Research Materials
Miscellaneous
