. 2024 Jun 5;14(1):12978.
doi: 10.1038/s41598-024-64006-7.

MARK4 aggravates cardiac dysfunction in mice with STZ-induced diabetic cardiomyopathy by regulating ACSL4-mediated myocardial lipid metabolism

Affiliations

MARK4 aggravates cardiac dysfunction in mice with STZ-induced diabetic cardiomyopathy by regulating ACSL4-mediated myocardial lipid metabolism

Yi Wu et al. Sci Rep. .

Abstract

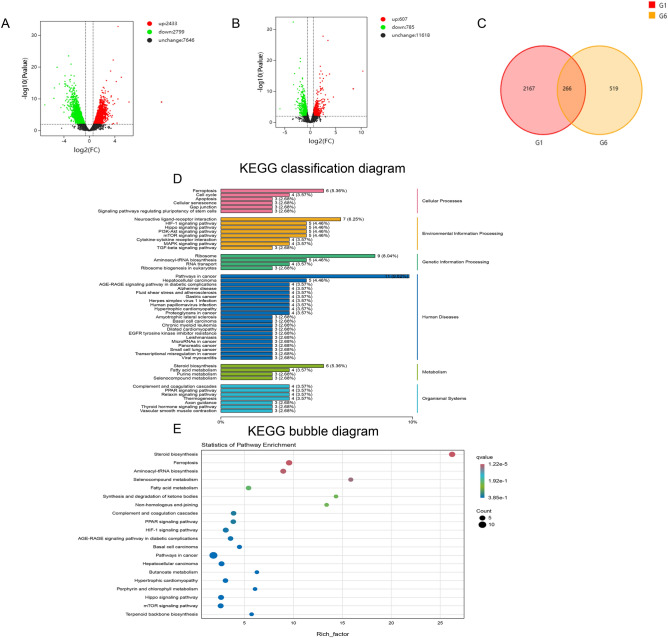
Diabetic cardiomyopathy is a specific type of cardiomyopathy. In DCM, glucose uptake and utilization are impaired due to insulin deficiency or resistance, and the heart relies more heavily on fatty acid oxidation for energy, resulting in myocardial lipid toxicity-related injury. MARK4 is a member of the AMPK-related kinase family, and improves ischaemic heart failure through microtubule detyrosination. However, the role of MARK4 in cardiac regulation of metabolism is unclear. In this study, after successful establishment of a diabetic cardiomyopathy model induced by streptozotocin and a high-fat diet, MARK4 expression was found to be significantly increased in STZ-induced DCM mice. After AAV9-shMARK4 was administered through the tail vein, decreased expression of MARK4 alleviated diabetic myocardial damage, reduced oxidative stress and apoptosis, and facilitated cardiomyocyte mitochondrial fusion, and promoted myocardial lipid oxidation metabolism. In addition, through the RNA-seq analysis of differentially expressed genes, we found that MARK4 deficiency promoted lipid decomposition and oxidative metabolism by downregulating the expression of ACSL4, thus reducing myocardial lipid accumulation in the STZ-induced DCM model.


Conflict of interest statement

The authors declare no competing interests.

Figures

Figure 1
Figure 1
MARK4 was upregulated in vitro and in vivo. (A, B) The expression of the MARK4 protein in STZ-induced diabetic cardiomyopathy mice (n = 6 samples per group). (C) The effects of different durations of high-glucose and high-lipid treatment on cardiomyocyte viability (n = 4 samples per group). (D, E) The expression of the MARK4 protein in cardiomyocytes treated with high-glucose and high-lipid (n = 6 samples per group). The data are presented as the means ± SDs. Significant differences are indicated by *P < 0.05, **P < 0.01, and ***P < 0.001.
Figure 2
Figure 2
Effects of MARK4 deficiency on body weight, blood glucose levels and oxidative stress in STZ-induced DCM mice. (A) Body weight (n = 6 samples per group). (B) Intraperitoneal glucose tolerance test of blood glucose levels (n = 6 samples per group). (C) Intraperitoneal insulin tolerance test of blood glucose levels (n = 6 samples per group). (D) Levels of MDA in each group (n = 6 samples per group). (EI) Western blot and quantitative analysis of the levels of oxidative stress-related proteins (NOX2, NAPDH, and SOD2) (n = 6 samples per group). The data are presented as the means ± SDs. Significant differences are indicated by **P < 0.01 and ***P < 0.001.
Figure 3
Figure 3
Effects of MARK4 deficiency on myocardial injury, myocardial fibrosis and mitochondrial structure in STZ-induced DCM mice. (A) Left ventricle stained with HE (original magnification × 200). (B) Left ventricle stained with Masson’s trichrome (original magnification × 200). (C) Transmission electron microscopy image of left ventricular myocardial (original magnification × 2000). (D) Quantitative analysis of collagen fibres using Masson’s trichrome staining (n = 3 samples per group). (E) Quantitative analysis of myofibrils in the myocardium using TEM (n = 3 samples per group). (F) Analysis of the mitochondrial size in the myocardium using TEM (n = 3 samples per group). (G) BNP levels in each group (n = 8 samples per group). The data are presented as the means ± SDs. Significant differences are indicated by *P < 0.05, **P < 0.01, and ***P < 0.001.
Figure 4
Figure 4
Effects of MARK4 deficiency on mitochondrial dynamics and myocardial cell apoptosis in STZ-induced DCM mice. (AG) Western blot and quantitative analysis of the levels of mitochondrial dynamics- and apoptosis-related proteins (MFN2, OPA1, DRP1, BCL2, and BAX) (n = 6 samples per group). (HI) Detection of the percentage of apoptotic cardiomyocytes in each group (n = 3 samples per group). (JN) Western blot and quantitative analysis of apoptosis-related proteins (caspase-3, cleaved caspase-3, cytochrome c, and Bax) in cardiomyocytes (n = 6 samples per group). The data are presented as the means ± SDs. Significant differences are indicated by *P < 0.05, **P < 0.01, and ***P < 0.001.
Figure 5
Figure 5
Effects of MARK4 deficiency on fatty acid oxidation and blood lipid levels in STZ-induced DCM mice. (AE) Western blot and quantitative analysis of the levels of fatty acid oxidation-related proteins (CPT1A, CPT2, and PPAR-α) (n = 6 samples per group). (F) Blood triglyceride levels in each group (n = 6 samples per group). The data are presented as the means ± SDs. Significant differences are indicated by *P < 0.05, **P < 0.01, and ***P < 0.001.
Figure 6
Figure 6
Transcriptomic analysis and sequencing validation of the effects of MARK4 deficiency. (A) Volcano plot of the control group and Hp + PA group (n = 3 samples per group). (B) Volcano plot of the Hp + PA group and Hp + PA + shMARK4 group (n = 3 samples per group). (C) The upregulated genes in the control group and Hp + PA group and downregulated genes in the Hp + PA group and Hp + PA + shMARK4 group are shown as a cross-Venn diagram (n = 3 samples per group). (D) KEGG classification diagram of the differentially expressed genes (n = 3 samples per group). (E) KEGG bubble diagram of the differentially expressed genes (n = 3 samples per group). (F) Heatmap of differentially expressed genes (n = 3 samples per group) (The heatmap analysis software: DESeq2(1.30.1) and edgeR(3.32.1) https://cran.r-project.org/web/packages/pheatmap). (GJ) Consistency of the qRT‒PCR and RNA-seq results (n = 3 samples per group). (KN) Consistency of the Western blot and RNA-seq results (n = 6 samples per group). (O, P) Quantitative analysis of the ACSL4 protein levels in STZ-induced DCM mice with reduced MARK4 expression (n = 4 samples per group). The data are presented as the means ± SDs. Significant differences are indicated by *P < 0.05, **P < 0.01, and ***P < 0.001.
Figure 6
Figure 6
Transcriptomic analysis and sequencing validation of the effects of MARK4 deficiency. (A) Volcano plot of the control group and Hp + PA group (n = 3 samples per group). (B) Volcano plot of the Hp + PA group and Hp + PA + shMARK4 group (n = 3 samples per group). (C) The upregulated genes in the control group and Hp + PA group and downregulated genes in the Hp + PA group and Hp + PA + shMARK4 group are shown as a cross-Venn diagram (n = 3 samples per group). (D) KEGG classification diagram of the differentially expressed genes (n = 3 samples per group). (E) KEGG bubble diagram of the differentially expressed genes (n = 3 samples per group). (F) Heatmap of differentially expressed genes (n = 3 samples per group) (The heatmap analysis software: DESeq2(1.30.1) and edgeR(3.32.1) https://cran.r-project.org/web/packages/pheatmap). (GJ) Consistency of the qRT‒PCR and RNA-seq results (n = 3 samples per group). (KN) Consistency of the Western blot and RNA-seq results (n = 6 samples per group). (O, P) Quantitative analysis of the ACSL4 protein levels in STZ-induced DCM mice with reduced MARK4 expression (n = 4 samples per group). The data are presented as the means ± SDs. Significant differences are indicated by *P < 0.05, **P < 0.01, and ***P < 0.001.
Figure 7
Figure 7
Expression of ACSL4 in vivo and in vitro in STZ-induced DCM models and the effect of ACSL4 deficiency on lipid metabolism in STZ-induced DCM models. (A, B) The expression of the ACSL4 protein in STZ-induced diabetic cardiomyopathy mice (n = 6 samples per group). (C, D) The expression of the ACSL4 protein in cardiomyocytes treated with high-glucose and high-lipid (n = 6 samples per group). (EI) Western blot and quantitative analysis of the levels of fatty acid oxidation-related proteins (CPT1A, CPT2, and PPAR-α) following ACSL4 knockdown in STZ-induced DCM mice (n = 4 samples per group). (J, K) Changes in the expression of the ACSL4 protein in each group (n = 6 samples per group). (LO) Western blot and quantitative analysis of the levels of fatty acid oxidation-related proteins following ACSL4 knockdown in DCM cardiomyocytes (n = 6 samples per group). The data are presented as the means ± SDs. Significant differences are indicated by *P < 0.05, **P < 0.01, and ***P < 0.001.
Figure 8
Figure 8
Relationships between MARK4 and ACSL4 and lipid metabolism. (AF) Western blot and quantitative analysis of the levels of MARK4, ACSL4, CPT1A, CPT2, and PPAR-α (n = 6 samples per group). (G) Changes in the mitochondrial membrane potential in each group (n = 3 samples per group). (H, I) Changes in reactive oxygen species levels in each group (n = 3 samples per group). The data are presented as the means ± SDs. Significant differences are indicated by *P < 0.05, **P < 0.01, and ***P < 0.001.
Figure 9
Figure 9
Schematic diagram of the mechanism of MARK4 deficiency improving myocardial injury in diabetes cardiomyopathy.

Similar articles

Cited by

References

    1. Li W, Yao M, Wang R, et al. Profile of cardiac lipid metabolism in STZ-induced diabetic mice. Lipids Health Dis. 2018;17(1):231. doi: 10.1186/s12944-018-0872-8. - DOI - PMC - PubMed
    1. Mansor LS, Gonzalez ER, Cole MA, et al. Cardiac metabolism in a new rat model of type 2 diabetes using high-fat diet with low dose streptozotocin. Cardiovasc. Diabetol. 2013;12:136. doi: 10.1186/1475-2840-12-136. - DOI - PMC - PubMed
    1. Alberti KG, Zimmet P, Shaw J. International diabetes federation: A consensus on Type 2 diabetes prevention. Diabet. Med. 2007;24(5):451–463. doi: 10.1111/j.1464-5491.2007.02157.x. - DOI - PubMed
    1. Gargiulo P, Marsico F, Renga F, et al. The metabolic syndrome in heart failure: Insights to specific mechanisms. Heart Fail. Rev. 2020;25(1):1–7. doi: 10.1007/s10741-019-09838-6. - DOI - PubMed
    1. Carpentier AC. Abnormal myocardial dietary fatty acid metabolism and diabetic cardiomyopathy. Can. J. Cardiol. 2018;34(5):605–614. doi: 10.1016/j.cjca.2017.12.029. - DOI - PubMed

MeSH terms