. 2024 Jul;16(7):1657-1674.
doi: 10.1038/s44321-024-00083-5. Epub 2024 Jun 5.

Aggregation-resistant alpha-synuclein tetramers are reduced in the blood of Parkinson's patients

Affiliations

Aggregation-resistant alpha-synuclein tetramers are reduced in the blood of Parkinson's patients

Laura de Boni et al. EMBO Mol Med. 2024 Jul.

Abstract

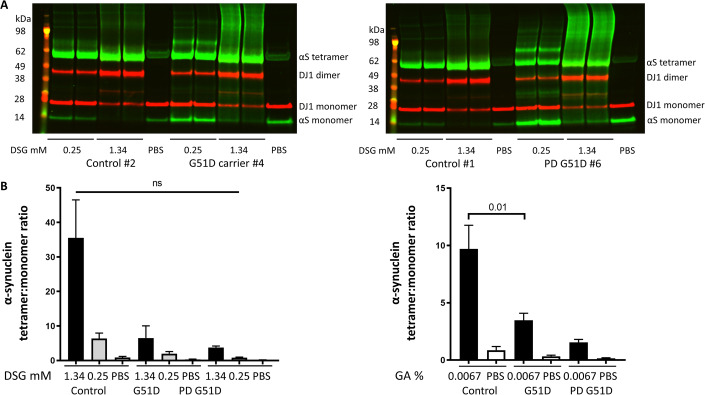
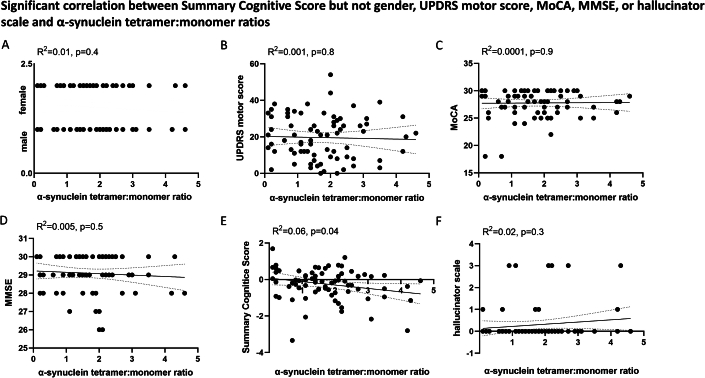
Synucleinopathies such as Parkinson's disease (PD) are defined by the accumulation and aggregation of the α-synuclein protein in neurons, glia and other tissues. We have previously shown that destabilization of α-synuclein tetramers is associated with familial PD due to SNCA mutations and demonstrated brain-region specific alterations of α-synuclein multimers in sporadic PD patients following the classical Braak spreading theory. In this study, we assessed relative levels of disordered and higher-ordered multimeric forms of cytosolic α-synuclein in blood from familial PD with G51D mutations and sporadic PD patients. We used an adapted in vitro-cross-linking protocol for human EDTA-whole blood. The relative levels of higher-ordered α-synuclein tetramers were diminished in blood from familial PD and sporadic PD patients compared to controls. Interestingly, the relative amount of α-synuclein tetramers was already decreased in asymptomatic G51D carriers, supporting the hypothesis that α-synuclein multimer destabilization precedes the development of clinical PD. Our data, therefore suggest that measuring α-synuclein tetramers in blood may have potential as a facile biomarker assay for early detection and quantitative tracking of PD progression.

Keywords: Alpha-synuclein; Blood; Human; Parkinson’s disease; Tetramer.


Figures

Figure 1
Figure 1. Cross-linking protocol for EDTA-blood.
Protocol and workflow. The procedure is described in the Methods section. Created with BioRender.com. Agreement number: JT25I9XJNL.
Figure 2
Figure 2. Western blot analysis of blood lysate from G51D carriers and one PD G51D patient compared to controls.
(A) Representative pictures of Western blot analyses from controls, G51D carriers and PD patients with G51D mutations using the cross-linker DSG. All samples have been analyzed in technical duplicates. Information on clinical characteristics is provided in Table 1. (B) Quantitation of Western blot signal shows lower α-synuclein tetramer:monomer ratios in G51D carriers (n = 2) and the G51D PD patient (n = 1) compared to controls (n = 3) using 2 different concentrations of the cross-linker DSG (left panel, 0.25 mM and 1.43 mM). Using a second cross-linker, GA, α-synuclein tetramer:monomer ratios were significantly reduced in G51D carriers (right panel, p = 0.01) compared to controls. The α-synuclein tetramer:monomer ratio was further diminished in one G51D patient who already clinically developed PD compared to non-symptomatic G51D carriers and controls. All groups were compared using Mann–Whitney-U test and are displayed as mean ± s.e.m. GA = Glutaraldehyde, DSG = Disuccinimidyl glutarate. Samples for Fig. 2 (depleting hemoglobin, cross-linking, gels, blots) were processed in parallel on different blots due to the samples size. No loading controls were run on the western blot as the full volume of each processed sample containing 20 µg of total protein was loaded into each gel pocket. Source data are available online for this figure.
Figure 3
Figure 3. α-Synuclein tetramer:monomer ratios are diminished in sPD patients compared to controls.
(A) Samples from cohort 1. α-Synuclein tetramer:monomer ratios are significantly reduced (p = 0.02) in sPD patients (n = 65) compared to controls (n = 17) upon cross-linking with DSG at a final concentration of 1.43 mM. Both groups were compared using Mann–Whitney-U test and are displayed as mean ± s.e.m. sPD = sporadic Parkinson’s disease. All samples (depleting hemoglobin, cross-linking, gels, blots) were processed on different blots due to the samples size at least in technical duplicates. No loading controls were run on the western blot as the full volume of each processed sample containing 20 µg of total protein was loaded into each gel pocket. (B) Samples from cohort 2. α-Synuclein tetramer:monomer ratios are significantly reduced in sPD patients (n = 64) compared to controls (n = 83) upon cross-linking with GA at a final concentration of 0.0067% (p = 0.0002). Both groups were compared using Mann–Whitney-U test and are displayed as mean ± s.e.m. sPD = sporadic Parkinson’s disease. All samples (depleting hemoglobin, cross-linking, gels, blots) were processed on different blots due to the samples size at least in technical duplicates. No loading controls were run on the western blot as the full volume of each processed sample containing 20 µg of total protein was loaded into each gel pocket. Source data are available online for this figure.
Figure 4
Figure 4. α-Synuclein tetramer:monomer ratios are inversely correlated with disease duration but show no relationship with age.
(A, B) Pearson correlation shows a negative correlation of α-synuclein tetramer:monomer ratios and disease duration for cohort 1 (sPD n = 64) (A) but not cohort 2 (sPD n = 63) (B) in sPD. (C, D) Pearson correlation shows no significant correlation of α-synuclein tetramer:monomer ratios and age for either cohort 1 (sPD n = 65, controls n = 17) (C) or cohort 2 (sPD n = 64, controls n = 83) (D) in sPD and controls. Yrs = years. Lines show 95% confidence bands of the best fit linear regression line. Source data are available online for this figure.
Figure EV1
Figure EV1. Representative Western blot and Mass spectrometry analysis.
(A) Western blot analysis of G51D carriers and one PD G51D patient blood lysate compared to controls. Representative pictures of Western blot analyses from controls, G51D carriers and one PD patient with a G51D mutation using the cross-linker GA and DSG. All samples have been analyzed in technical duplicates. Information on clinical characteristics is provided in Table 1. Samples for Fig. EV1 (depleting hemoglobin, cross-linking, gels, blots) were processed in parallel on different blots due to the samples size. No loading controls were run on the western blot as the full volume of each processed sample containing 20 µg of total protein was loaded into each gel pocket. (B) Mass spectrometry traces of immunoprecipitated blood-derived α-synuclein. The graph displays the expected mass for isolated tetrameric α-synuclein: 58,286 kDa. In comparison, the expected mass for the DSG cross-linker (unconjugated) would be 326 kDa. Source data are available online for this figure.
Figure EV2
Figure EV2. Validation of the cross-linking protocol.
The procedure is described in the Methods section. (A) Quantification of the Western blot of cross-linked (DSG) human whole blood after Hemoglobin depletion (ratio Blood:HemogloBind 1:1, n = 1, control sample). Blood samples were left at room temperature for different time points (0–6 h) or placed at 4 °C for 8–11 days after the samples have been kept at 6 h RT. Samples were analyzed in two technical replicates. Due to degradation processes, the signal/ratio drops after 6 h at RT and subsequent cooling at 4 °C. Data is displayed as mean ± s.d. (B) Quantification of the Western blot of cross-linked (DSG) human whole blood after Hemoglobin depletion (ratio Blood:HemogloBind 1:4, n = 1, control sample). Blood samples were left at room temperature for different time points (0–6 h) or placed at 4 °C for 8–11 days after the samples have been kept at 6 h RT. Samples were analyzed in two technical replicates. Due to degradation processes, the signal/ratio drops after 6 h at RT and subsequent cooling at 4 °C. Data is displayed as mean ± s.d. (C) Signal intensities of the Western blot analysis remain stable after multiple freeze/thaw cycles (Blood:HemogloBind 1:1, n = 1, control sample). Samples were analyzed in two technical replicates. Data is displayed as mean ± s.d. (D) Hemoglobin intensities after removal of Hemoglobin were correlated (Pearson correlation) with α-synuclein tetramer:monomer ratios (Blood:HemogloBind 1:1, r = 0.2, p = 0.2, n = 60). RT room temperature, DSG Disuccinimidyl glutarate.
Figure EV3
Figure EV3. Validation of the cross-linking protocol.
(A) Validation of the cross-linking protocol. The procedure is described in the Methods section. Quantification of the Western blot of cross-linked (DSG) human whole blood after Hemoglobin depletion (ratio Blood:HemogloBind 1:1, n = 4, 2 control samples, 2 PD samples). The signal is increased after reducing the sample at 70 °C using 4 × NuPage LDS sample buffer (Novex)/1:10 β-mercaptoethanol (Sigma). Samples were analyzed in two technical replicates. Data is displayed as mean ± s.d. BME = β-mercaptoethanol, PD = Parkinson’s disease, DSG=Disuccinimidyl glutarate. (B) DJ1 dimer:monomer ratios are similar between controls, G51D carriers and PD G51D patients. The DJ1 protein serves as an internal control for the cross-linking procedure. All groups were compared using Mann–Whitney-U test. G51D carriers n = 2, G51D PD patient (n = 1), controls n = 3. Samples were analyzed in two technical replicates. Data is displayed as mean ± s.d. F.c. = final concentration, PD = Parkinson’s disease, DSG = Disuccinimidyl glutarate, GA = glutaraldehyde. (C) Analysis of total α-synuclein blood levels. Left, total, blood-derived cytosolic α-synuclein levels do not differ between sPD patients (n = 20) and controls (n = 15, p = 0.3). Cytosolic, soluble α-synuclein was derived after mechanical cell lysis. Right, total, blood-derived membrane-associated α-synuclein levels do not differ between sPD patients (n = 20) and controls (n = 15, p = 0.2). Membrane-associated α-synuclein was derived after mechanical cell lysis from the 1% Triton-soluble fraction. All Samples were analyzed in two technical replicates. All groups were compared using Mann–Whitney-U test. Mean for each sample is displayed.
Figure EV4
Figure EV4. Correlation analysis of α-synuclein tetramer:monomer ratios and clinical parameters.
Pearson correlation of cohort 1 shows Pearson’s correlation analysis of α-synuclein tetramer:monomer ratios and (A) gender, (B) UPDRS motor score, (C) MoCA, (D) MMSE, (E) Summary Cognitive Score, (F) hallucinator scale.
Figure EV5
Figure EV5. Correlation analysis of α-synuclein tetramer:monomer ratios and clinical parameters.
Pearson correlation of cohort 2 shows no significant correlation of α-synuclein tetramer:monomer ratios and (A) gender, (B) UPDRS motor score, (C) MoCA, (D) MMSE.

Similar articles

Cited by

References

    1. Abdullah R, Patil KS, Rosen B, Pal R, Prabhudesai S, Lee S, Basak I, Hoedt E, Yang P, Panick K, et al. Subcellular Parkinson’s disease-specific alpha-synuclein species show altered behavior in neurodegeneration. Mol Neurobiol. 2017;54:7639–7655. doi: 10.1007/s12035-016-0266-8. - DOI - PubMed
    1. Alam P, Bousset L, Melki R, Otzen DE. α-synuclein oligomers and fibrils: a spectrum of species, a spectrum of toxicities. J Neurochem. 2019;150:522–534. doi: 10.1111/jnc.14808. - DOI - PubMed
    1. Araki K, Yagi N, Nakatani R, Sekiguchi H, So M, Yagi H, Ohta N, Nagai Y, Goto Y, Mochizuki H. A small-angle X-ray scattering study of alpha-synuclein from human red blood cells. Sci Rep. 2016;6:30473. doi: 10.1038/srep30473. - DOI - PMC - PubMed
    1. Barba L, Paolini Paoletti F, Bellomo G, Gaetani L, Halbgebauer S, Oeckl P, Otto M, Parnetti L. Alpha and beta synucleins: from pathophysiology to clinical application as biomarkers. Mov Disord. 2022;37:669–683. doi: 10.1002/mds.28941. - DOI - PMC - PubMed
    1. Barbour R, Kling K, Anderson JP, Banducci K, Cole T, Diep L, Fox M, Goldstein JM, Soriano F, Seubert P, et al. Red blood cells are the major source of alpha-synuclein in blood. Neurodegener Dis. 2008;5:55–59. doi: 10.1159/000112832. - DOI - PubMed