

Normative modelling of molecular-based functional circuits captures clinical heterogeneity transdiagnostically in psychiatric patients
- PMID: 38839931
- PMCID: PMC11153627
- DOI: 10.1038/s42003-024-06391-3
Normative modelling of molecular-based functional circuits captures clinical heterogeneity transdiagnostically in psychiatric patients
Abstract
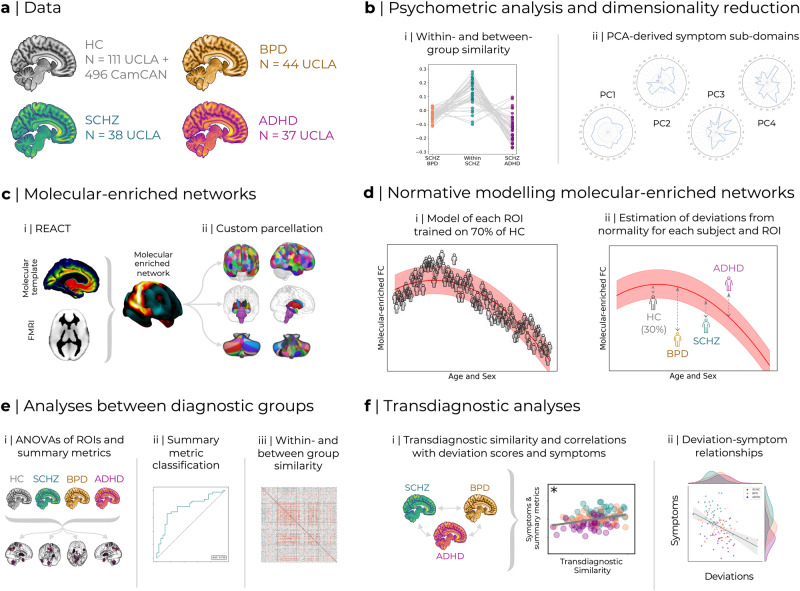
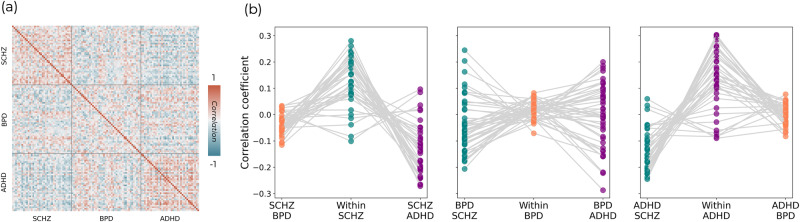
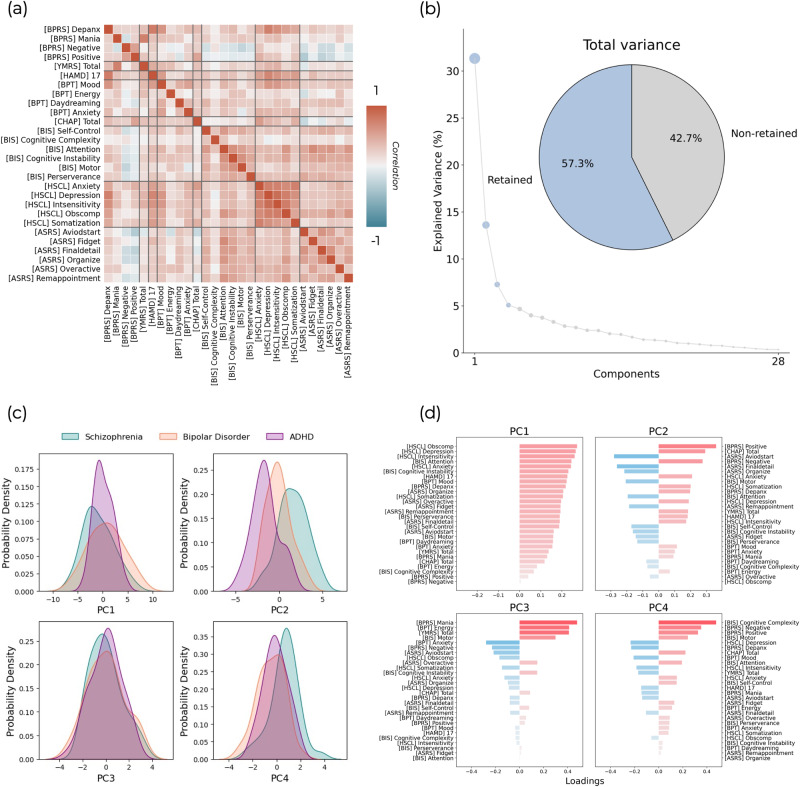
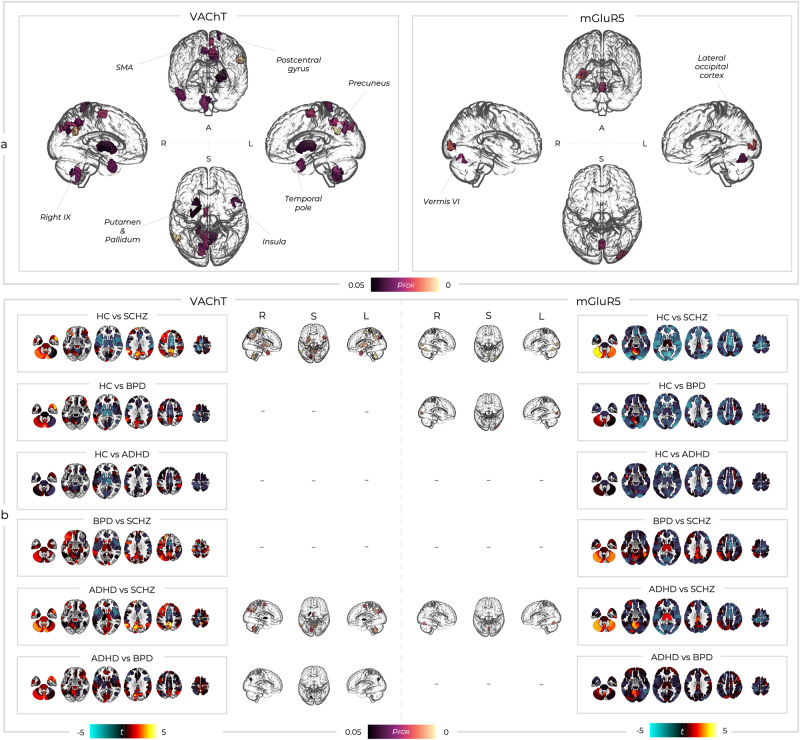
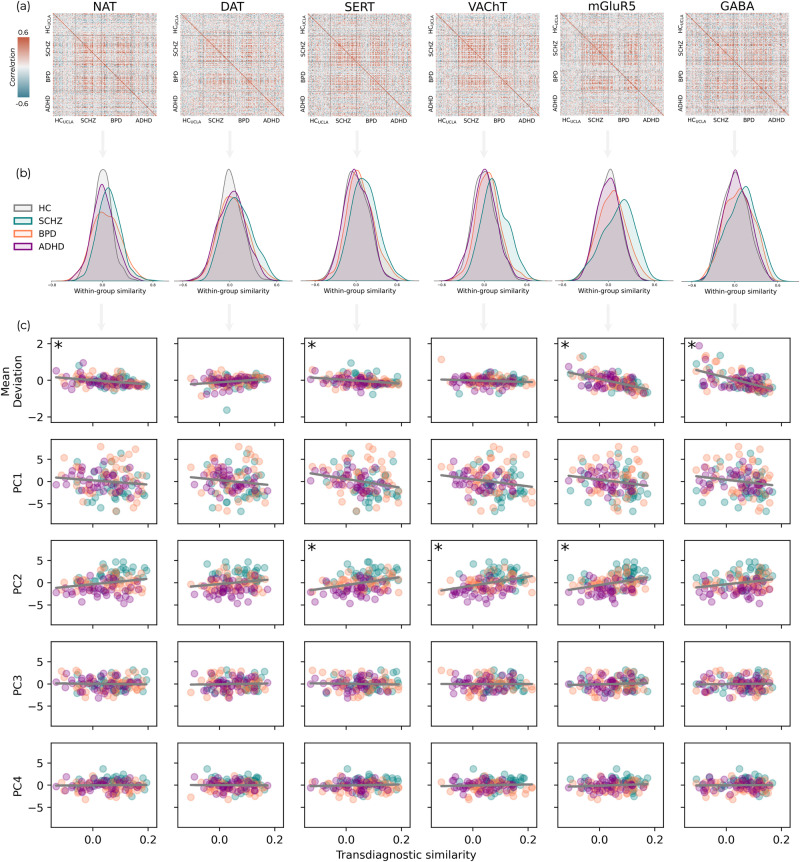
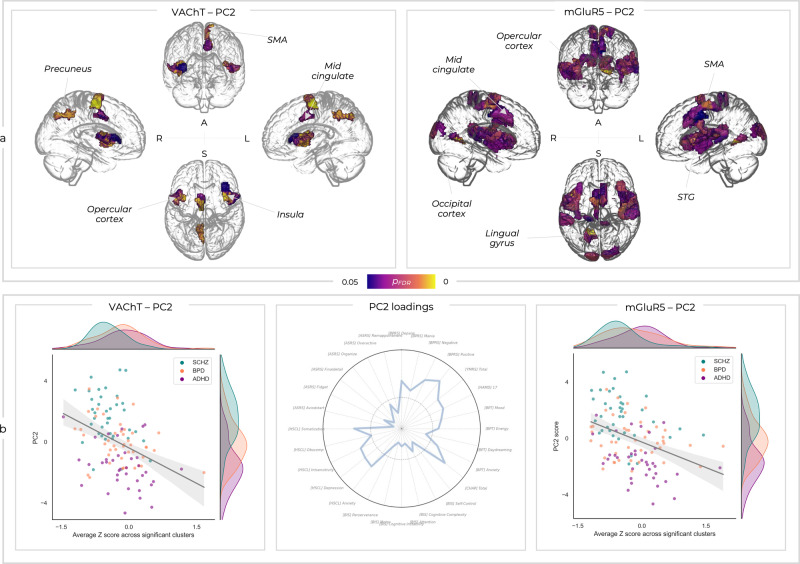
Advanced methods such as REACT have allowed the integration of fMRI with the brain's receptor landscape, providing novel insights transcending the multiscale organisation of the brain. Similarly, normative modelling has allowed translational neuroscience to move beyond group-average differences and characterise deviations from health at an individual level. Here, we bring these methods together for the first time. We used REACT to create functional networks enriched with the main modulatory, inhibitory, and excitatory neurotransmitter systems and generated normative models of these networks to capture functional connectivity deviations in patients with schizophrenia, bipolar disorder (BPD), and ADHD. Substantial overlap was seen in symptomatology and deviations from normality across groups, but these could be mapped into a common space linking constellations of symptoms through to underlying neurobiology transdiagnostically. This work provides impetus for developing novel biomarkers that characterise molecular- and systems-level dysfunction at the individual level, facilitating the transition towards mechanistically targeted treatments.
© 2024. The Author(s).
Conflict of interest statement
The authors declare no competing interests.
Figures
Similar articles
-
Dynamicity of brain network organization & their community architecture as characterizing features for classification of common mental disorders from whole-brain connectome.Transl Psychiatry. 2024 Jun 29;14(1):268. doi: 10.1038/s41398-024-02929-5. Transl Psychiatry. 2024. PMID: 38951513 Free PMC article.
-
Altered coupling relationships across resting-state functional connectivity measures in schizophrenia, bipolar disorder, and attention deficit/hyperactivity disorder.Psychiatry Res Neuroimaging. 2025 Mar;347:111943. doi: 10.1016/j.pscychresns.2024.111943. Epub 2024 Dec 18. Psychiatry Res Neuroimaging. 2025. PMID: 39709676
-
Transdiagnostic, Connectome-Based Prediction of Memory Constructs Across Psychiatric Disorders.Cereb Cortex. 2021 Mar 31;31(5):2523-2533. doi: 10.1093/cercor/bhaa371. Cereb Cortex. 2021. PMID: 33345271 Free PMC article.
-
Imaging functional and structural brain connectomics in attention-deficit/hyperactivity disorder.Mol Neurobiol. 2014 Dec;50(3):1111-23. doi: 10.1007/s12035-014-8685-x. Epub 2014 Apr 5. Mol Neurobiol. 2014. PMID: 24705817 Review.
-
Neural networks of aggression: ALE meta-analyses on trait and elicited aggression.Brain Struct Funct. 2019 Jan;224(1):133-148. doi: 10.1007/s00429-018-1765-3. Epub 2018 Oct 5. Brain Struct Funct. 2019. PMID: 30291479 Free PMC article.
Cited by
-
Investigating dopaminergic abnormalities in schizophrenia and first-episode psychosis with normative modelling and multisite molecular neuroimaging.Mol Psychiatry. 2025 Aug;30(8):3533-3550. doi: 10.1038/s41380-025-02938-w. Epub 2025 Feb 28. Mol Psychiatry. 2025. PMID: 40021831 Free PMC article.
-
Relations of temporoparietal connectivity with neighborhood social fragmentation in youth at clinical high-risk for psychosis.Schizophr Res. 2025 Mar;277:151-158. doi: 10.1016/j.schres.2025.02.012. Epub 2025 Mar 10. Schizophr Res. 2025. PMID: 40068446
References
Publication types
MeSH terms
Grants and funding
LinkOut - more resources
Full Text Sources
Medical
