. 2024 Jul;25(7):2861-2877.
doi: 10.1038/s44319-024-00166-x. Epub 2024 Jun 5.

Deficiency of CAMSAP2 impairs olfaction and the morphogenesis of mitral cells

Affiliations

Deficiency of CAMSAP2 impairs olfaction and the morphogenesis of mitral cells

Zhengrong Zhou et al. EMBO Rep. 2024 Jul.

Abstract

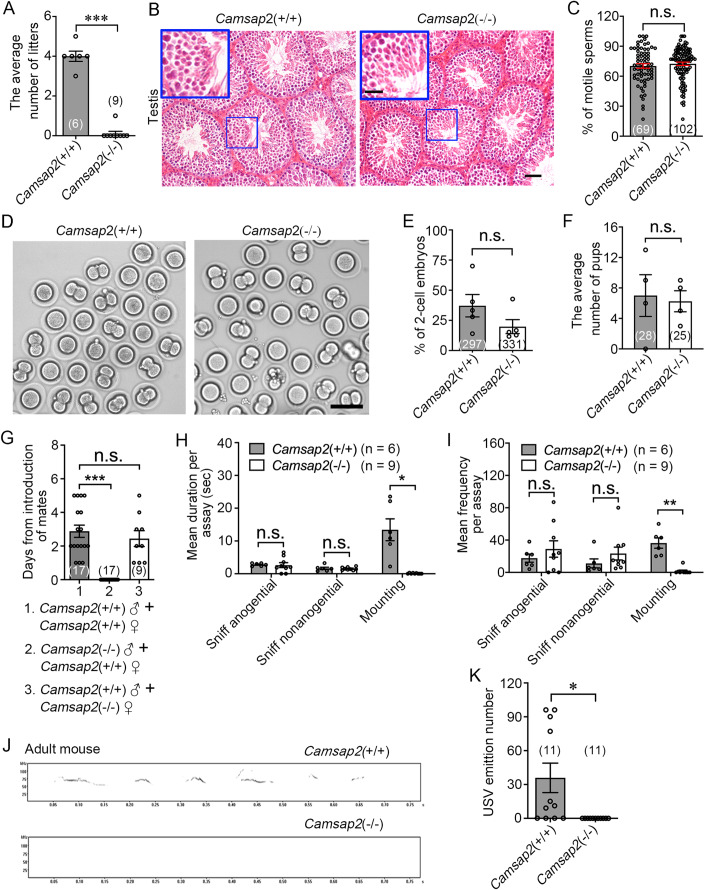
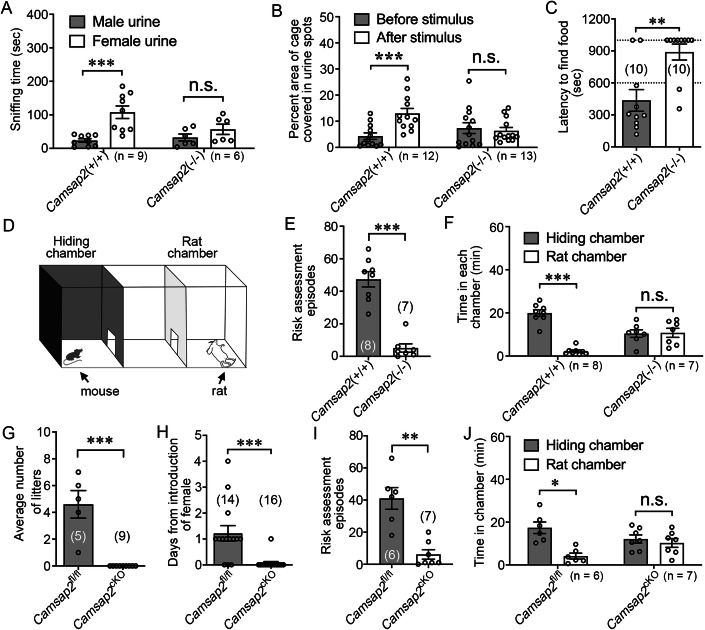
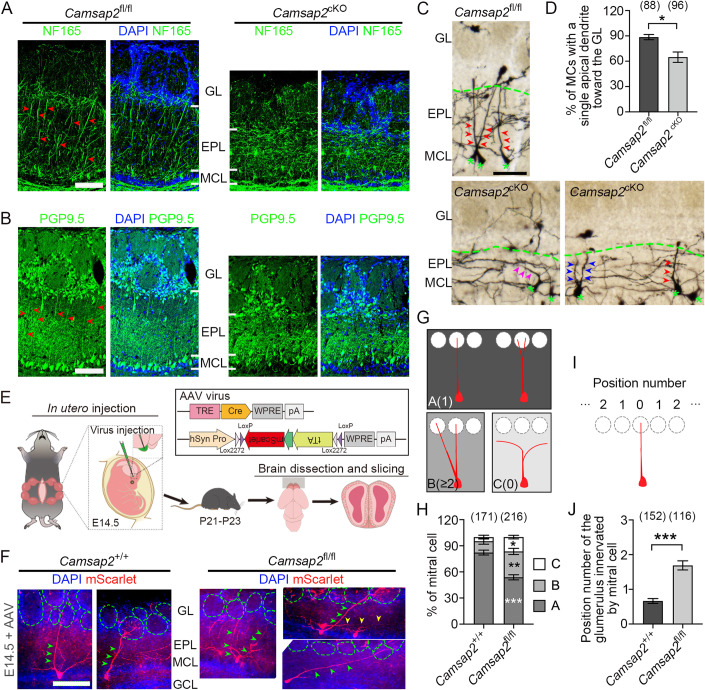
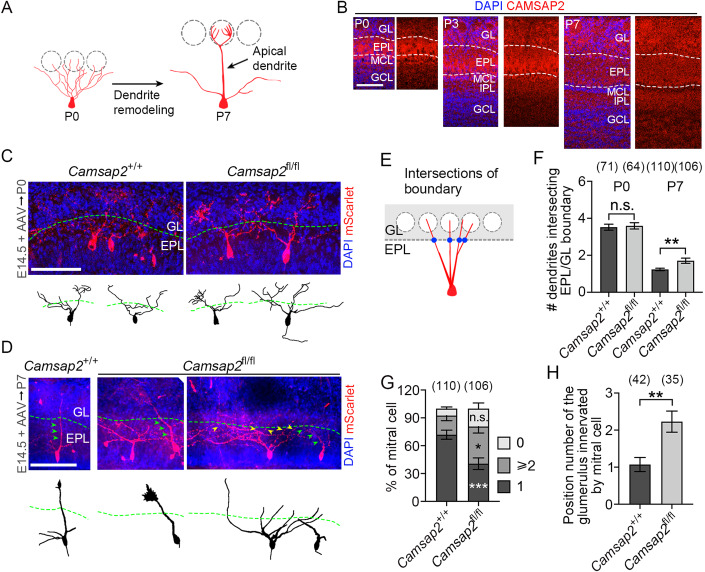
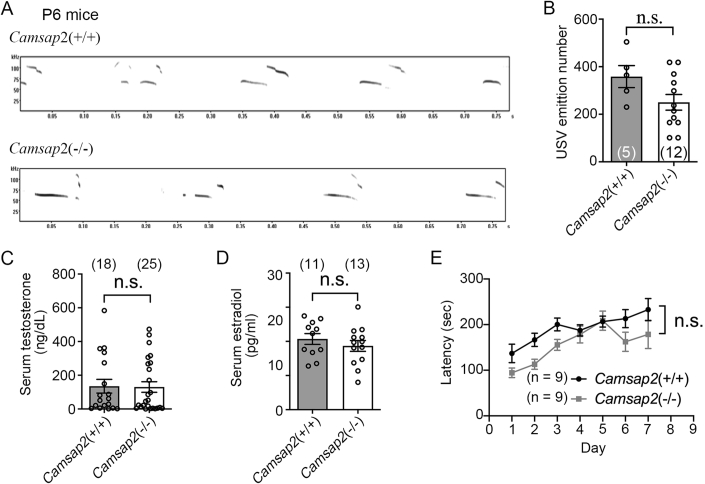
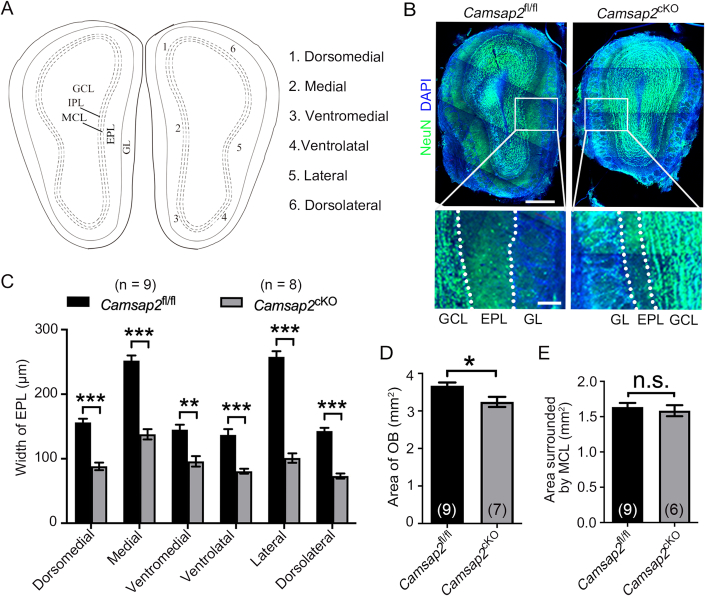
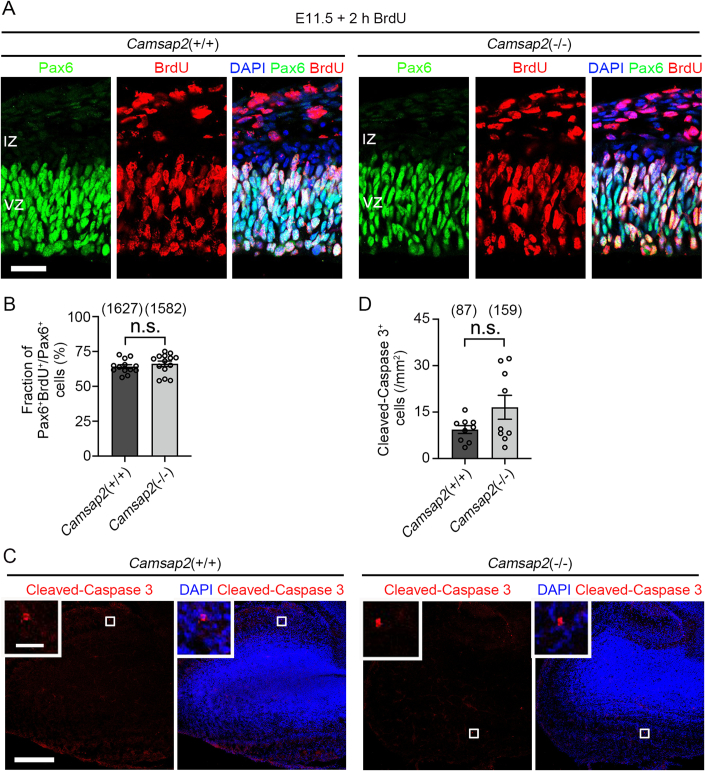
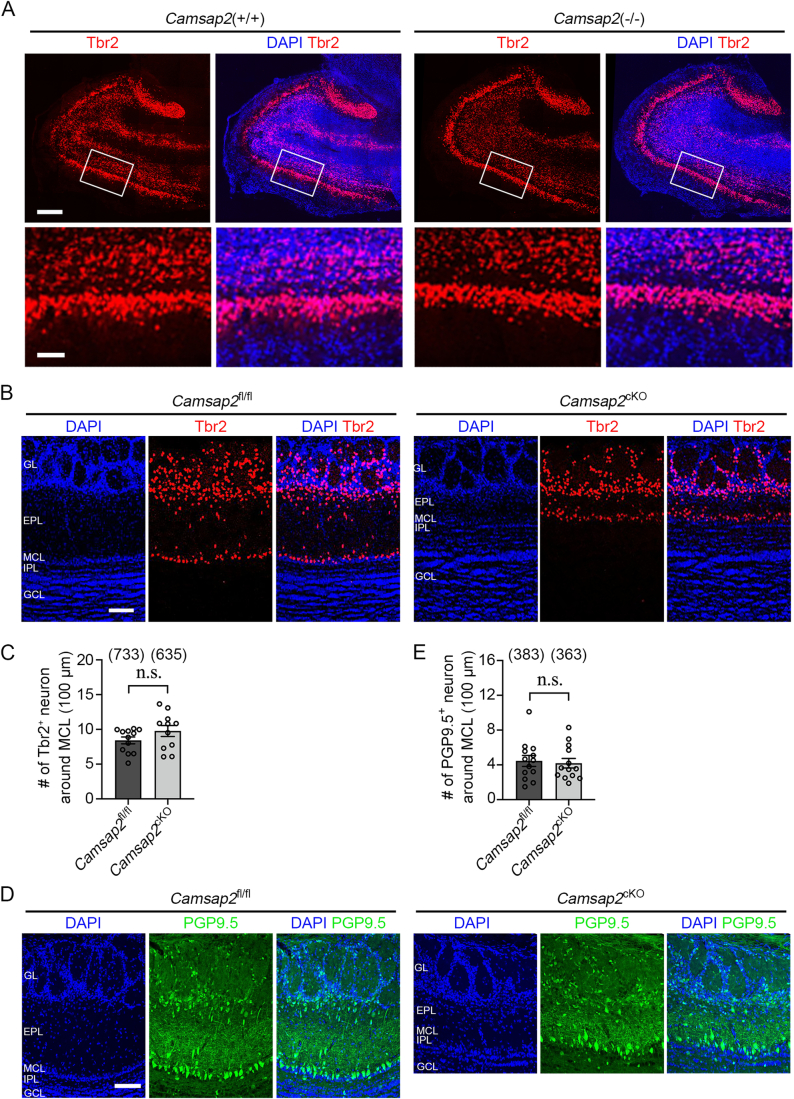
In developing olfactory bulb (OB), mitral cells (MCs) remodel their dendrites to establish the precise olfactory circuit, and these circuits are critical for individuals to sense odors and elicit behaviors for survival. However, how microtubules (MTs) participate in the process of dendritic remodeling remains elusive. Here, we reveal that calmodulin-regulated spectrin-associated proteins (CAMSAPs), a family of proteins that bind to the minus-end of the noncentrosomal MTs, play a crucial part in the development of MC dendrites. We observed that Camsap2 knockout (KO) males are infertile while the reproductive tract is normal. Further study showed that the infertility was due to the severe defects of mating behavior in male mice. Besides, mice with loss-of-function displayed defects in the sense of smell. Furthermore, we found that the deficiency of CAMSAP2 impairs the classical morphology of MCs, and the CAMSAP2-dependent dendritic remodeling process is responsible for this defect. Thus, our findings demonstrate that CAMSAP2 plays a vital role in regulating the development of MCs.

Keywords: CAMSAP2; Mitral Cell; Morphogenesis; Odor-dependent Behaviors.


Conflict of interest statement

The authors declare no competing interests.

Figures

Figure 1
Figure 1. Copulatory behavior but not spermatogenesis is responsible for the infertility of Camsap2 KO males.
(A) Quantification of the average number of litters produced by male mice (unpaired Student’s t test, n = 6 or 9 biological replicates, ***P = 2.84 × 10-6). (B) Representative images of testicular histology sections stained with H&E staining. (C) The percentage of motile sperms produced by Camsap2(+/+) and Camsap2(−/−) mice (unpaired Student’s t test, n = 4 biological replicates). (D) Representative images of 2-cell embryos produced by IVF. (E) The percentage of 2-cell embryos produced by IVF (unpaired Student’s t test, n = 5 biological replicates). (F) The average number of pups produced by IVF (unpaired Student’s t test, n = 4 biological replicates). (G) Mice mating assay. Average number of days after pairing until the copulatory plug appears, 0. indicates that no plugs appeared after a maximum time span of 5 days of monitoring (one-way ANOVA with Dunnett’s multiple comparisons test, n = 9–17 biological replicates, ***P < 0.0001). (H, I) The duration (H) and frequency (I) of mating subroutines in WT and KO mice (unpaired Student’s t test, n = 6 or 9 biological replicates, *P = 0.0102, **P = 0.00233). (J) Representative spectrograms of USVs emitted by adult male mice. (K) Quantification of the number of USVs emitted by adult male mice (unpaired Student’s t test, n = 11 biological replicates, *P = 0.0208). Data information: Data are represented as mean ± SEM. n.s. not significant, P > 0.05. Scale bars: (B) 100 μm and 50 μm in full-size images and zoomed areas; (D) 50 μm. Source data are available online for this figure.
Figure 2
Figure 2. Deficiency of CAMSAP2 dysregulated olfactory behaviors.
(A) Total amount of time that male mice spend sniffing male or female urine (ratio paired Student’s t test, n = 9 or 6 biological replicates, ***P = 0.0001). (B) Territorial marking assay. Percent area of cage covered by male urine in response to a spot of female urine (ratio paired Student’s t test, n = 12 or 13 biological replicates, ***P = 0.0006). (C) Buried food test. The latency for mice to locate the food pellet. The dotted line at 600 indicates the end time of the experiment, and the dotted line at 1000 indicates the mice do not find the hidden food within the allotted time (unpaired Student’s t test, n = 10 biological replicates, **P = 0.00233). (D) Schematic diagram of the defensive behavior test arena. The mouse and rat in each chamber are indicated by arrows. (E) Quantification of risk assessment behavior (unpaired Student’s t test, n = 8 or 7 biological replicates, ***P = 8.95 × 10−6). (F) Quantification of the time spent by mice in the hiding chamber and rat chamber (ratio paired Student’s t test, n = 8 or 7 biological replicates, ***P = 0.0001). (G) Quantification of the average number of litters produced by Camsap2fl/fl and Camsap2cKO male mice, 0 indicate that no plugs appeared after a maximum time span of 6 days of monitoring (unpaired Student’s t test, n = 5 or 9 biological replicates, ***P = 0.0005). (H) Mice mating assay of Camsap2fl/fl and Camsap2cKO mice. The average number of days after pairing until the copulatory plug appears with a maximum time span of 6 days (unpaired Student’s t test, n = 14 or 16 biological replicates, ***P < 0.0001). (I) Quantification of risk assessment behavior of Camsap2fl/fl and Camsap2cKO mice (unpaired Student’s t test, n = 6 or 7 biological replicates, **P = 0.00226). (J) Quantification of the time spent by Camsap2fl/fl and Camsap2cKO male mice in the hiding chamber and rat chamber (ratio paired Student’s t test, n = 6 or 7 biological replicates, *P = 0.026). Data information: Data are represented as mean ± SEM. n.s. not significant, P > 0.05. Source data are available online for this figure.
Figure 3
Figure 3. CAMSAP2 deficiency disturbs the apical dendritic projection of MCs.
(A, B) Representative images of immunofluorescence staining for NF165 (A) and PGP9.5 (B) in OB coronal sections. Red arrowheads indicate the perpendicular apical dendrites of MCs. (C) Neurons in the OB were stained by Golgi-cox staining. Green asterisks indicate the MCs, red arrowheads indicate the single apical dendrites extending from the MC straight toward the GL, blue arrowheads indicate two apical dendrites extending from the single MC, pink arrowheads indicate single apical dendrites extending towards the lateral side of EPL. Green dashed lines indicate the boundary of GL/EPL. (D) Quantification of the percentage of MCs with a perpendicular single apical dendrite (unpaired Student’s t test, n = 5 biological replicates, *P = 0.0137). (E) Schema showing AAV-based sparse labeling. An AAV mixture was injected into the olfactory ventricle at E14.5, the neuronal morphology was analyzed at P21-P23. (F) Representative images of MCs labeled by mScarlet. Apical dendrites extending toward GL are indicated by green arrowheads, and an apical dendrite extending toward the lateral side is indicated by yellow arrowheads. Glomeruli are depicted by green dashed circles. (G) Apical dendrite morphologies of MCs were divided into 3 types: Type A, apical dendrite projecting into a single glomerulus; Type B, apical dendrite projecting into multiple glomeruli; Type C, apical dendrite does not project into any glomerulus. (H) Quantification of the percentage of MCs with different types of apical dendrite (two-way ANOVA with Šídák’s multiple comparisons test, n = 6 or 5 biological replicates, *P = 0.0228, **P = 0.001, ***P < 0.0001, detailed information is reported in Source data). (I) Schema showing the position number of glomeruli innervated by an MC. (J) Quantification of the position number of glomeruli innervated by MCs (unpaired Student’s t test, n = 6 or 5 biological replicates, ***P = 7.75 × 10−11). Data information: Data are represented as mean ± SEM. Scale bars, 100 μm. Source data are available online for this figure.
Figure 4
Figure 4. CAMSAP2 deficiency disrupts dendritic remodeling.
(A) Development of MC from P0 to P7. At P0, the MC develops widespread apical dendrites into multiple glomeruli, at P7, the MC forms typical mature morphology with a single apical dendrite and several lateral dendrites via dendritic remodeling. (B) Distribution of CAMSAP2 in coronal sections of the OB at P0, P3, and P7. (C, D) Representative images of MCs labeled by mScarlet. Green arrowheads indicate single apical dendrites extending from the MC toward the GL, and yellow arrowheads indicate multiple apical dendrites from single MC extending toward the GL. Green dashed lines indicate the boundary of GL/EPL. Representative MCs are reconstructed and shown below. (E) Intersections between dendrites and the GL/EPL boundary are shown as a cartoon. (F) Quantification of the number of crossing sites at the GL/EPL border in P0 and P7 mice (two-way ANOVA with Šídák’s multiple comparisons test, P0, n = 4 or 6 biological replicates; P7, n = 7 or 6 biological replicates, **P = 0.0098, detailed information is reported in Source data). (G) Quantification of the percentage of MC with different number of intersections in P7 mice (two-way ANOVA with Šídák’s multiple comparisons test, n = 7 or 6 biological replicates, *P = 0.0444, ***P = 0.0007, detailed information is reported in Source data). (H) Quantification of the position number of glomeruli innervated by MC apical dendrites (unpaired Student’s t test, n = 7 or 6 biological replicates, **P = 0.00127). Data information: Data are represented as mean ± SEM. n.s. not significant, P > 0.05. Scale bars, 100 μm. Source data are available online for this figure.
Figure EV1
Figure EV1. Hormone levels and motor function are not responsible for the infertility of Camsap2(−/−) male mice.
(A) Representative spectrograms of USVs emitted by P6 mice. (B) Quantification of the number of USVs emitted by P6 mice (unpaired Student’s t test, n = 5 or 12 biological replicates). (C) The concentration of serum testosterone (unpaired Student’s t test, n = 18 or 25 biological replicates). (D) The concentration of serum estradiol (unpaired Student’s t test, n = 11 or 13 biological replicates). (E) Motor performance on an accelerating rotarod, no significant difference exists at any time point (two-way R-M ANOVA, n = 9 biological replicates). Data information: Data are represented as mean ± SEM. n.s. not significant, P > 0.05.
Figure EV2
Figure EV2. Knockout of Camsap2 diminishes the thickness of EPL in the OB.
(A) Schematic diagram of the OB. (B) Representative images of the OB from Camsap2fl/fl and Camsap2cKO mice, mature neurons were immunostained with antibody anti-NeuN. (C) Quantification of the thickness of EPL from Camsap2fl/fl and Camsap2cKO mice (two-way R-M ANOVA with Šídák’s multiple comparisons test, n = 3 biological replicates, ***P = 0.0009 or < 0.0001, **P = 0.0033). (D) Quantification of the area of the OB from Camsap2fl/fl and Camsap2cKO mice (unpaired Student’s t test, n = 3 biological replicates, *P = 0.0221). (E) Quantification of the area surrounded by MCL from Camsap2fl/fl and Camsap2cKO mice (unpaired. Student’s t test, n = 3 biological replicates). Data information: Data are represented as mean ± SEM. n.s. not significant, P > 0.05. Scale bars: 400 μm and 100 μm in full-size images and zoomed areas.
Figure EV3
Figure EV3. CAMSAP2 is dispensable for the neurogenesis and apoptosis of MCs.
(A) Representative images of coronal OB sections from E11.5 mice. The progenitor cells and proliferating. cells are immunostained with antibodies against Pax6 and BrdU after BrdU labeling for 2 h. (B) The percentage of proliferating progenitor cells (unpaired Student’s t test, n = 4 biological replicates). (C) Representative images of sagittal OB sections from P0 mice. The cells undergoing apoptosis are immunostained with antibody against Cleaved-Caspase 3 (Activated-Caspase 3). (D) The density of Cleaved-Caspase 3+ cells in OB (unpaired Student’s t test, n = 3 biological replicates). Data information: Data are represented as mean ± SEM. n.s. not significant, P > 0.05. Scale bars: (A), 30 μm; (C) 300 μm and 30 μm in full-size images and zoomed areas.
Figure EV4
Figure EV4. CAMSAP2 is dispensable for the migration of MCs.
(A) Representative images of the sagittal sections of the OB from P0 mice. The MCs are immunostained with antibody against Tbr2. (B) Representative images of coronal sections of the OB of adult mice. The MCs are immunostained with. antibody against Tbr2. (C) Quantification of the number of Tbr2+ neurons around the MCL (unpaired Student’s t test, n = 3 biological replicates). (D) Representative images of coronal sections of the OB of adult mice. The MCs are immunostained with. antibody against PGP9.5. (E) Quantification of the number of PGP9.5 positive neurons around the MCL (unpaired Student’s t test, n = 3 biological replicates). Data information: Data are represented as mean ± SEM. n.s. not significant, P > 0.05. Scale bars: (A) 200 μm and 50 μm in full-size images and zoomed areas; (B, D) 400 μm.

Similar articles

References

    1. Aihara S, Fujimoto S, Sakaguchi R, Imai T. BMPR-2 gates activity-dependent stabilization of primary dendrites during mitral cell remodeling. Cell Rep. 2021;35:109276. doi: 10.1016/j.celrep.2021.109276. - DOI - PubMed
    1. Akhmanova A, Hoogenraad CC. Microtubule minus-end-targeting proteins. Curr Biol. 2015;25:R162–171. doi: 10.1016/j.cub.2014.12.027. - DOI - PubMed
    1. Asaba A, Hattori T, Mogi K, Kikusui T. Sexual attractiveness of male chemicals and vocalizations in mice. Front Neurosci. 2014;8:231. doi: 10.3389/fnins.2014.00231. - DOI - PMC - PubMed
    1. Baum MJ, Cherry JA. Processing by the main olfactory system of chemosignals that facilitate mammalian reproduction. Horm Behav. 2015;68:53–64. doi: 10.1016/j.yhbeh.2014.06.003. - DOI - PubMed
    1. Blanchart A, De Carlos JA, Lopez-Mascaraque L. Time frame of mitral cell development in the mice olfactory bulb. J Comp Neurol. 2006;496:529–543. doi: 10.1002/cne.20941. - DOI - PubMed

Substances

LinkOut - more resources