. 2024 Jun;630(8016):412-420.
doi: 10.1038/s41586-024-07478-x. Epub 2024 Jun 5.

MYCT1 controls environmental sensing in human haematopoietic stem cells

Affiliations

MYCT1 controls environmental sensing in human haematopoietic stem cells

Júlia Aguadé-Gorgorió et al. Nature. 2024 Jun.

Abstract

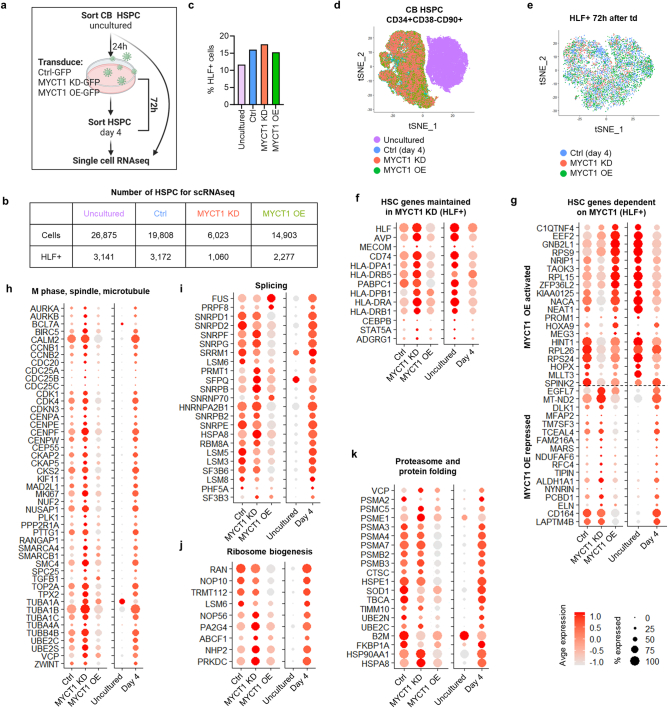
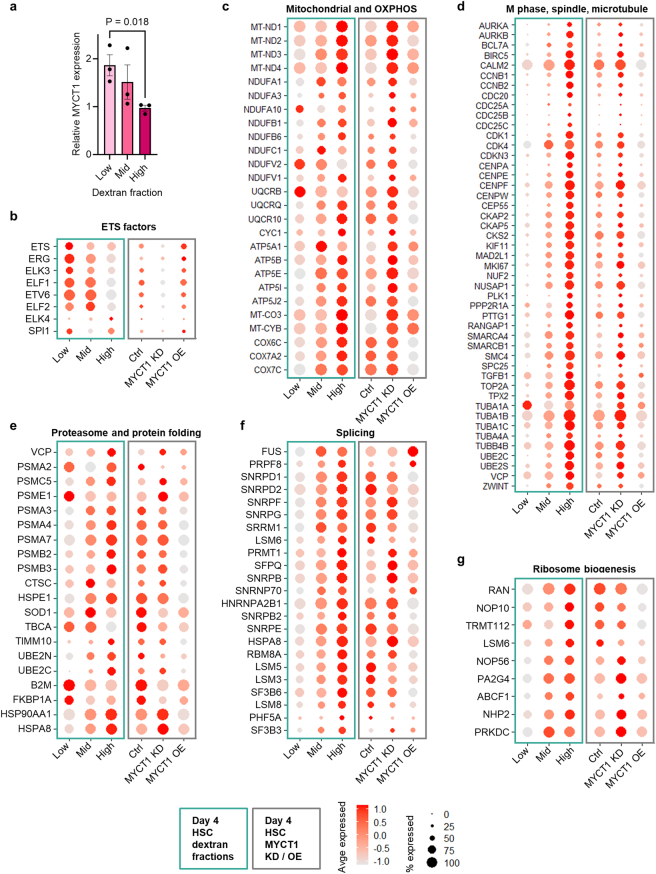
The processes that govern human haematopoietic stem cell (HSC) self-renewal and engraftment are poorly understood and challenging to recapitulate in culture to reliably expand functional HSCs1-3. Here we identify MYC target 1 (MYCT1; also known as MTLC) as a crucial human HSC regulator that moderates endocytosis and environmental sensing in HSCs. MYCT1 is selectively expressed in undifferentiated human haematopoietic stem and progenitor cells (HSPCs) and endothelial cells but becomes markedly downregulated during HSC culture. Lentivirus-mediated knockdown of MYCT1 prevented human fetal liver and cord blood (CB) HSPC expansion and engraftment. By contrast, restoring MYCT1 expression improved the expansion and engraftment of cultured CB HSPCs. Single-cell RNA sequencing of human CB HSPCs in which MYCT1 was knocked down or overexpressed revealed that MYCT1 governs important regulatory programmes and cellular properties essential for HSC stemness, such as ETS factor expression and low mitochondrial activity. MYCT1 is localized in the endosomal membrane in HSPCs and interacts with vesicle trafficking regulators and signalling machinery. MYCT1 loss in HSPCs led to excessive endocytosis and hyperactive signalling responses, whereas restoring MYCT1 expression balanced culture-induced endocytosis and dysregulated signalling. Moreover, sorting cultured CB HSPCs on the basis of lowest endocytosis rate identified HSPCs with preserved MYCT1 expression and MYCT1-regulated HSC stemness programmes. Our work identifies MYCT1-moderated endocytosis and environmental sensing as essential regulatory mechanisms required to preserve human HSC stemness. Our data also pinpoint silencing of MYCT1 as a cell-culture-induced vulnerability that compromises human HSC expansion.


Conflict of interest statement

The authors declare the following competing interests: H.K.A.M is a scientific advisory board member for Notch therapeutics and a consultant for MaroBio. H.K.A.M. and J.A.-G. have submitted a provisional patent application based on the work presented here (“Methods and compositions for haematopoietic stem cell enhancement”; PCT patent application submitted; institution: UCLA; inventors: H.K.A.M. and J.A.-G.), covering increasing expression and/or activity of MYCT1 and controlling endocytosis in cultured HSCs to improve transplantability and/or provide better in vitro models for pluripotent stem cell-derived haematopoiesis. All other authors declare no competing interests.

Figures

Fig. 1
Fig. 1. MYCT1 is crucial for human HSPC ex vivo expansion and engraftment.
a, MYCT1 expression from RNA-seq on sorted populations from human 5–6-week AGM, placenta, yolk sac (YS), second trimester FL, CB and adult bone marrow (ABM). n = 6 (AGM), n = 4 (placenta) or n = 3 (YS, FL, CB, ABM) donors per tissue, mean ± s.e.m. FPKM, fragments per kilobase of mappable length and million counts. CMP, common myeloid progenitor; MEP, megakaryocyte erythroid progenitor; GMP, granulocyte macrophage progenitor; CDP, common dendritic cell progenitor; CLP, common lymphoid progenitor. b, MYCT1 expression in human FL GPI80+ and GPI80 HSPC (CD34+CD38CD90+) subsets, and UM171-expanded CB ITGA3+ and ITGA3 HSPC (CD90+EPCR+CD133+CD34+CD45RA) subsets. n = 3 and 4 replicates, mean ± s.e.m., two-tailed paired and unpaired t-test, respectively. c, Relative MYCT1 expression by qPCR with reverse transcription (RT–qPCR) in CB HSPCs (CD34+CD38CD90+) sorted before and after culture. n = 3 experiments, mean ± s.e.m., two-tailed paired t-test. d, Fold ex vivo expansion of all cells, total HSPCs (CD34+CD38CD90+CD45RA) and immunophenotypic long-term HSCs (LT-HSCs; CD34+CD38CD90+CD45RAEPCR+ITGA3+) from control or MYCT1 KD CB. n = 8 (control), n = 12 (KD1), n = 5 (KD2) replicates from 4 independent experiments, mean ± s.e.m., two-tailed Mann–Whitney test. Left to right: all cells KD1: P = 0.041, P = 0.000016, P = 0.000059, P = 0.000037; KD2: P = 0.0016, P = 0.0016, P = 0.0007, P = 0.0007; total HSPC KD1: P = 0.0055, P = 0.0022, P = 0.0044, P = 0.0004; KD2: P = 0.0062, P = 0.0031, P = 0.0027, P = 0.0027; LT-HSC KD1: P = 0.0252, P = 0.0002, P = 0.000022, P = 0.0008; LT-HSC KD2: P = 0.0186, P = 0.0016, P = 0.0007, P = 0.0083. e, Quantification of human haematopoietic engraftment (human CD45+) in NSG mice transplanted with equal numbers (5,000) of sorted control or MYCT1 KD CB HSPCs. n = 6 (control) and n = 5 (MYCT1 KD) mice per group, mean ± s.e.m., two-tailed Mann–Whitney test. Left to right: P = 0.0303, P = 0.0043, P = 0.0087, P = 0.0173, P = 0.0303. Source Data
Fig. 2
Fig. 2. MYCT1 governs regulatory programmes associated with human HSC functional competence.
a, scRNA-seq dot plot documenting the expression of selected human HSC-enriched genes from multiple datasets,–, as well as the HSC activation marker CDK6, that are significantly differentially expressed in uncultured CB HSPCs (CD34+CD38CD90+) selected on the basis of HLF and the presence or absence of MYCT1 expression. b, scRNA-seq dot plot depicting the scores for the differentially regulated functional categories comparing HLF+ HSCs from cultured control, MYCT1 KD and MYCT1 OE HSPCs. Uncultured and cultured HLF+ HSCs are also compared. c, Dot plot depicting gene expression of ETS factors. d, Dot plot depicting gene expression of selected mitochondrial and OXPHOS genes. e,f, Quantification (left) and representative FACS plots (right) of mitochondrial membrane potential (TMRE) (e) and mitochondrial reactive oxygen species (MitoSOX) (f) in control, MYCT1 KD and MYCT1 OE HSPCs 72 h after transduction. Delta median fluorescence intensity (ΔMFI) is between the GFP+ cells and the GFP cells within the same sample. n = 5 replicates from 3 independent experiments, mean ± s.e.m., two-tailed unpaired t-test. Source Data
Fig. 3
Fig. 3. Restoring MYCT1 expression in cultured human HSPCs improves ex vivo expansion and engraftment ability.
Experimental outline (a) for evaluating the effects of MYCT1 OE on CB HSPC expansion (b) and engraftment ability before (ce) and after (fh) extended culture. b, Fold expansion of control or MYCT1 OE total cells, CD34+CD38 cells, total HSPCs (CD34+CD38CD90+CD45RA) and immunophenotypic LT-HSCs (CD34+CD38CD90+CD45RAEPCR+ITGA3+). n = 6 replicates from 3 independent experiments, mean ± s.e.m., ratio-paired two-tailed t-test. ce, A total of 500 or 2,500 control or MYCT1 OE HSPCs were sorted (CD34+CD38CD90+GFP+) and transplanted 96 h after transduction into NBSGW mice. c, Percentage of mice with human haematopoietic (≥0.1% human CD45+), multilineage (myeloid, B lymphoid, and T lymphoid or other) or human erythroid (CD71+GlyA+) engraftment. Two-tailed paired t-test. d, Percentage of total human CD45 cells in BM. Median and all individual values are shown, two-tailed Mann–Whitney test. e, Estimation of repopulating unit (RU) frequency within transplanted cells after 96 h. fh, The progeny of control or MYCT1 OE HSPCs sorted GFP+ 72 h after transduction transplanted after 10 additional days in culture (15 days total). f, Percentage of mice with human haematopoietic, multilineage or erythroid engraftment. Two-tailed paired t-test. g, Percentage of human CD45 cells in the BM for the different doses. Median and individual values are shown. h, Estimated RU frequency within transplanted cells at day 15. In e and h, the frequency of reconstituting units and P values were calculated using ELDA. In ce, n = 25 mice for 500 HSPCs and n = 17 mice for 2,500 HSPCs for each group transduced with control and MYCT1 OE vectors. See Extended Data Fig. 7a and Supplementary Table 4 for mouse numbers and sex of the mice. For fh, a total of n = 34 mice for each group transduced with control and MYCT1 OE vectors. See Extended Data Fig. 8a and Supplementary Table 5 for distribution of mice and sex of the mice. For ch, engraftment was assessed in BM 12 weeks after transplantation. Schematic in a was created with BioRender (https://www.biorender.com). Source Data
Fig. 4
Fig. 4. MYCT1 is located in endosomes and interacts with vesicle trafficking and receptor signalling machinery.
a, The transmembrane topology of MYCT1 was predicted from its amino acid sequence using Phobius and is depicted as a schematic and histogram of probability. b,c, High-resolution Airyscan immunofluorescence images (b) and quantification (c) of the localization of overexpressed MYCT1–V5 in human CB HSPCs after 5 days of culture. MYCT1–V5 was visualized by staining for V5, and colocalization with endosomal markers (clathrin, RAB5, RAB7 and RAB11), Golgi marker (GM130) and mitochondrial marker HSP60 was evaluated. DAPI indicates nuclei. Colocalization channel (Coloc) shows areas positive for V5 and each marker. Scale bars, 3 µm (RAB5) or 2 µm (other columns). Analysis was performed using Imaris (v.9.7.2) software on n = 8 (clathrin), n = 5 (RAB5), n = 13 (RAB7), n = 6 (RAB11), n = 4 (HSP60) and n = 6 (GM130) images per condition from 2 independent experiments. Box plots depict median and 10–90th percentile, and data above and below are shown. d, Prediction of the MYCT1 3D structure reproduced from AlphaFold (https://alphafold.com/entry/Q8N699),. e, Model of the proposed MYCT1 structure, localization and topology. f, Heatmap of selected MYCT1 interactors detected by IP of the V5 tag in control KG1 cells and in MYCT1–V5 OE KG1 cells followed by high-sensitivity MS. Number of detected peptides for each protein are shown. n = 3 independent experiments, technical duplicates for each experiment are shown. Schematic in e was created with BioRender (https://www.biorender.com). Source Data
Fig. 5
Fig. 5. MYCT1 controls endocytosis and environmental sensing in human HSPCs.
ad, Evaluating the effects of MYCT1 KD and OE on endocytosis. a,b, Quantification (left) and representative FACS histogram (right) of low-molecular-weight (10 kDa) fluorescent dextran (a) or ECgreen (b) internalized over 30 min in control, MYCT1 KD or OE CB HSPCs 72 h after transduction. n = 5 replicates from 3 independent experiments, mean ± s.e.m., two-tailed t-test. c, Quantification of internalized fluorescent dextran in CB HSPC and HPC subsets over time in culture. n = 4 (d0), n = 6 (d5), n = 12 (d10 and d15) replicates from 4 independent experiments and n = 3 from 3 independent experiments (16 h), mean ± s.e.m., two-tailed Mann–Whitney test. d, Quantification (left) and representative histogram (right) of internalized fluorescent dextran in control or MYCT1 OE CB HSPCs (CD34+CD90+) cultured for 10–12 days. n = 9 from 4 experiments, mean ± s.e.m., two-tailed t-test. eg, Evaluating CB HSPCs with different endocytosis levels. e, Experimental outline for scRNA-seq of CB HSPCs (CD34+CD38CD90+EPCR+) with low, medium or high levels of endocytosis after 4 days in culture. f,g, Dot plots depicting MYCT1 expression (f) or the scores for MYCT1-associated functional categories (Fig. 2) (g) in HLF+ HSCs. h, KIT internalization in response to SCF stimulation by FACS in control or MYCT1 KD CB HSPCs (CD34+CD38EPCR+). n = 3 experiments, mean ± s.e.m., two-way analysis of variance. i, Western blot (left) and quantification (right) of phospho-AKT (pAKT) in control, MYCT1 KD or OE CB HSPCs 72 h after transduction. n = 3 experiments, mean ± s.e.m., two-tailed paired t-test. GAPDH is a sample processing control. For gel source data, see Supplementary Fig. 1. j, Dot plots for signalling scores (scRNA-seq) in control, MYCT1 KD or OE cells 72 h after transduction, uncultured and day 4 cultured CB HLF+ HSCs, and HSCs with low, medium or high dextran internalization. AKT+ and AKT indicate positive regulators and negative regulators, respectively, of AKT signalling. For a, b and d, ΔMFI is between the GFP+ and GFP cells within the same sample. Source Data
Extended Data Fig. 1
Extended Data Fig. 1. Silencing of MYCT1 expression in cultured human HSPCs.
a MYCT1 expression in human sorted hematopoietic populations from the DMAP dataset,. b Myct1 expression in mouse hematopoietic populations from Bloodspot. c-g Relative expression of MYCT1 and other HSC regulatory genes in sorted FL or CB HSPCs that were isolated freshly and after culture in different conditions. c Microarray analysis of CD34+CD38CD90+FL HSPCs co-cultured with OP9 stroma supplemented with cytokines as indicated. Mean±s.e.m. of all available microarray probes for MYCT1 (2), MECOM (5), and RUNX1 (10) from n = 3 (uncultured and week 2) or n = 2 (week 5) independent experiments. d RNAseq analysis of CD34+CD38CD90+CD45RA-CD49f+ CB LT-HSPC cultured without stroma as indicated. e RT-qPCR of CD34+CD38CD90+ CB HSPCs co-cultured with E4EC as indicated. n = 2 experiments, mean and individual data points. f,g Gene expression (RNAseq) and UCSC genome browser tracks of MYCT1 and MECOM genomic regions showing RNA seq and Chip-seq of histone marks in CD34+CD38CD90+ FL HSPCs isolated freshly or co-cultured with OP9 stroma as indicated. Gene expression is from n = 3 (uncultured) or n = 2 (week 4) experiments, mean with individual data points. Source Data
Extended Data Fig. 2
Extended Data Fig. 2. Validation of MYCT1 knockdown and its effects in cord blood HSPCs.
a,b Validating MYCT1 knockdown. a Relative MYCT1 expression by RT-qPCR in control or MYCT1 knockdown (KD) sorted CB HSPCs (CD34+CD38CD90+) 72 h post-transduction. Mean±s.e.m, two-tailed paired t-test, n = 3 (KD1) or mean, n = 2 (KD2) independent experiments. b Western blot in MYCT1-V5 overexpressing (OE) MKPL1 cells after transduction with control or MYCT1 KD lentiviral vectors. n = 1 experiment. GAPDH is a sample processing control. For gel source data see Supplementary Fig. 2. c Experimental outline to evaluate the effects of MYCT1 KD on CB HSPC ex vivo expansion and engraftment. d Representative FACS plots, gating strategy, and quantification of immunophenotypic HSPC/HPC fractions from control or MYCT1 KD CB HSPCs after 15 days in culture. Percentage of cells in each population within the total cells is indicated. Corresponds to quantifications in Fig. 1d. n = 8 (Ctrl), n = 12 (KD1), n = 5 (KD2) replicates from 4 independent experiments, mean±s.e.m., two-tailed Mann–Whitney test. e,f Quantifying proliferation in HSPCs after MYCT1 KD. e Percentage of HSPCs (CD34+CD38CD90+) that have undergone at least 1 to 4 divisions, or no divisions, for every 24 h elapsed since plating. n = 4 independent experiments, mean±s.e.m, two-tailed t-test. P values at 96 h timepoint are depicted. f Representative FACS histograms and quantification of proliferation by dye dilution (CellTrace) in control or MYCT1 KD CB HSPCs (CD34+CD38CD90+) at time of labelling (72-96 h post-transduction, indicated as 0 h) and after 48 additional hours. n = 4 (KD1) and n = 3 (KD2) independent experiments, mean±s.e.m, two-tailed Mann-Whitney t-test. For KD1 *P = 0.0317, for KD2 *P = 0.0159. g FACS plots showing control or MYCT1 KD CB HSPCs sorted for transplantation (CD34+CD38CD90+) 72 h post-transduction. h Representative FACS plots of human hematopoietic engraftment (hCD45+) and differentiated populations in mice transplanted with equal number (5,000) of sorted control or MYCT1 KD CB HSPCs. In FACS plots, percentage within total hCD45+ cells indicated. Schematic in c was created with BioRender (https://www.biorender.com). Source Data
Extended Data Fig. 3
Extended Data Fig. 3. Documentation of the effects of MYCT1 knockdown on human foetal liver HSPC expansion and engraftment.
a,b Quantifying expansion of foetal liver (FL) HSPC after MYCT1 KD. Fold expansion (a), representative FACS plots and percentage (b) of all live cells and immunophenotypic self-renewing HSCs (CD34+CD38CD90+GPI80+) from control or MYCT1 KD FL. n = 6 (ctrl), n = 5 (KD1) and n = 4 (KD2) replicates from 2 independent experiments, mean±s.e.m. c,d Determining the transplantation ability of MYCT1 KD FL HSPCs. c FACS plots showing control or MYCT1 KD CB HSPCs sorted for transplantation 72 h after transduction. The gate indicates the population (CD34+CD38CD90+GPI80+) that was sorted and transplanted. 10,000 sorted control or KD HSPCs were transplanted per mouse. d Representative FACS plots and quantification of human hematopoietic engraftment (hCD45+) and multilineage differentiation in NSG mice 24 weeks after transplantation. In FACS plots, percentage within total hCD45+ cells indicated. Quantification shows bone marrow at 6, 12 and 24 weeks after transplantation, and spleen and blood 24 weeks after transplantation. n = 5 (control) and n = 4 (MYCT1 KD) mice per group, mean±s.e.m., two-tailed Mann–Whitney test. Source Data
Extended Data Fig. 4
Extended Data Fig. 4. Analysis of MYCT1 dependent programs in cultured human CB HSCs.
a Experimental outline for scRNAseq analysis evaluating the effects of MYCT1 KD and MYCT1 OE in CB HSPCs 72 h after transduction (4 days in culture). CB HSPCs (CD34+CD38CD90+) were isolated freshly or 72 h after transduction. b Number of total HSPCs and HLF+ cells sequenced for scRNAseq for each sample. c Percentage of HLF+ HSC among uncultured and cultured control, MYCT KD and OE HSPC. d,e TSNE plots showing all the sequenced HSPCs (d), or the selected HLF+ cells 72 h after transduction (e). f,g Dot plot depicting gene expression of selected human HSC signature genes,– that are significantly differentially expressed in HLF+ HSCs from MYCT1 KD and/or MYCT1 OE compared to control. Comparison of uncultured and cultured HLF+ HSCs is also shown. h-k scRNAseq dot plots depicting expression for selected genes in the programs found to be differentially regulated by MYCT1 KD or OE in HLF+ HSC (see Fig. 2b). n = 1 experiment with the indicated number of single cells sequenced. Schematic in a was created with BioRender (https://www.biorender.com). Source Data
Extended Data Fig. 5
Extended Data Fig. 5. Analysis of MYCT1 associated programs in independent human and mouse datasets reflecting different levels of HSC competence.
a,b Evaluating the expression of MYCT1 associated “stemness” programmes in uncultured compared to 3 day cultured CB LT-HSC (CD34+CD38CD90+CD45RACD49f+). Heatmaps depict Log Fold change. c-e Evaluating the expression of Myct1 and MYCT1 associated human HSPC “stemness” programmes in mouse repopulating and non-repopulating HSC and progenitors in PVA-cultured mouse HSPCs. Mouse sorted immunophenotypic HSPCs (ELSK: EPCR+LinSca-1+C-kit) which were able repopulate mice upon transplantation (ELSK_rep) were compared to non-repopulating ELSK cells (ELSK_non rep), as well as both repopulating and non-repopulating non-ELSK progenitor cells (Prog). Heatmaps depict normalized gene expression. Source Data
Extended Data Fig. 6
Extended Data Fig. 6. Effects of restoring MYCT1 expression on human HSPCs in culture.
a Relative MYCT1 expression by RT-qPCR evaluating in sorted control or MYCT1 OE CB HSPCs (CD34+CD38CD90+GFP+) 72 h after transduction. n = 3 independent experiments, mean±s.e.m. b Representative FACS plots and gating strategy (b), and percentage (c) of undifferentiated CD34+CD38 cells, HSPCs (CD34+CD38CD90+CD45RA), and immunophenotypic LT-HSC (CD34+CD38CD90+CD45RAEPCR+ITGA3+) expanded from control or MYCT1 OE CB HSPCs after 10, 15 and 20 days in culture. Corresponds to quantifications in Fig. 3b. Percentage of cells in each population within the total cells is indicated in the FACS plots. n = 6 replicates from 3 independent experiments, mean±s.e.m, ratio-paired two-tailed t test. d Number and type of colonies formed in enriched methylcellulose (see Methods) after plating equal number of control or MYCT1 OE CB HSPCs (CD34+CD38CD90+GFP+) sorted 72-96 h after transduction. CFU/BFU-E: Colony-forming unit-erythroid or burst-forming unit-erythroid erythroid, CFU-GM: granulocyte and/or macrophage, CFU-Mixed: granulocyte, erythroid, macrophage. n = 4 independent experiments, mean±s.e.m, paired two-tailed t test. e Percentage of cells that undergo 1 to 4 divisions, or no divisions observed for every 24 h elapsed since plating. n = 3 independent experiments, mean±s.e.m. Source Data
Extended Data Fig. 7
Extended Data Fig. 7. Multilineage differentiation after transplantation of HSPCs with restored MYCT1 expression.
a Table indicating the number of mice transplanted with control or MYCT1 OE HSPC for each condition per replicate, for the transplantations performed 96 h after transduction. b-e Percentage of human undifferentiated HSPC (CD34+CD38) (b), hematopoietic progenitor cells (HPC, CD38+) (c), erythroid (CD71+GlyA+) (d), and megakaryocytes (CD41a+) (e) in BM from NBSGW mice 12 weeks after transplantation with 2500 HSPC. n = 17 mice per group. Median and all individual values are shown, two-tailed Mann–Whitney test. f Gating strategy and representative FACS plots showing human myeloid (CD14+ or CD66b+), B-lymphoid (CD19+), T-lymphoid/other (CD3, CD4 or CD8+), undifferentiated HSPC (CD34+CD38), HPC (CD38+), megakaryocytes (CD41a+), and erythroid (GlyA+CD71+) populations of mice transplanted with 500 or 2500 HSPCs 96 h after transduction. Percentage of cells in each population within the total BM hematopoietic compartment (human and mouse CD45) is indicated in the FACS plots. Source Data
Extended Data Fig. 8
Extended Data Fig. 8. Multilineage differentiation after transplanting day 15 progeny of HSPCs with restored MYCT1 expression.
a Table indicating the number of mice transplanted with the progeny of control or MYCT1 OE HSPC after 15 days in culture for each condition and replicate. b,c Gating strategy and representative FACS plots showing the human myeloid (CD14+ or CD66b+), B-lymphoid (CD19+), T-lymphoid/other (CD3, CD4 or CD8+), undifferentiated (CD34+CD38), HPC (CD38+), megakaryocytes (CD41a+), and erythroid (GlyA+CD71+) populations of mice transplanted with the progeny of 500, 2500 (b) or 10000 (high dose) (c) HSPCs after 15 days in culture. d-f Percentage of total engraftment (hCD45+), GFP, and differentiated populations for mice transplanted with the progeny of 10000 HSPCs. n = 5 (control) or n = 6 (MYCT1 OE) mice. Percentage of cells in each population within the total BM hematopoietic compartment (human and mouse CD45) is indicated in the FACS plots. Median and all individual values are shown. Source Data
Extended Data Fig. 9
Extended Data Fig. 9. Dissecting the MYCT1 interactome in KG1 hematopoietic cells and endothelial cells.
a-f KG1 cells and E4EC as models for studying MYCT1 function in HSC. a FACS analysis of HSC surface markers CD34 and CD90 in KG1 cells and human CB HSPCs. n = 1 experiment. b Gene expression (RNAseq) for HSC genes in KG1 and K562 cells from the Cancer Cell Line Encyclopaedia. c Western blot of MYCT1 in subcellular fractions of KG1 cells overexpressing (OE) MYCT1-V5. Representative image and quantification from n = 3 independent experiments, mean±s.e.m. Lamin B1, GAPDH, and Na/K ATPase are fraction controls. For gel source data, see Supplementary Fig. 3. d,e Confocal immunofluorescence and quantification of MYCT1-V5 and co-localization with endosomal (Clathrin, Rab5, Rab7, Rab11) and mitochondrial (HSP60) markers in KG1 cells. DAPI indicates nuclei. Colocalization channel (coloc) shows areas positive for V5 and each marker. Scale bars = 10 μm. Representative images of n = 3 independent experiments. Colocalization was assessed with Imaris v9.7.2 software on n = 16 (clathrin), n = 17 (Rab5), n = 12 (Rab7), n = 9 (Rab11), n = 11 (HSP60) images per condition. Box plots depict median and 10-90 percentile, data above and below are shown. f Fold expansion of E4EC and non-immortalized HUVEC cells 15 days after transduction with control or MYCT1 KD vectors. n = 4 (E4EC) or n = 3 (HUVEC) independent experiments, mean±s.e.m., two-tailed ratio paired t-test. g-j Dissecting the MYCT1 interactome. g Western blot for immunoprecipitation of V5-tagged MYCT1 in control or MYCT1 OE KG1 cells. Representative of n = 2 experiments. For gel source data, see Supplementary Fig. 4. h Heatmap of MYCT1 interactors detected by immunoprecipitation of V5 tag in control or MYCT1 OE KG1 and E4EC cells. Scale depicts the number of detected peptides for each protein. Colours indicate protein categories. n = 3 (KG1) or n = 1 (E4EC) independent experiments, technical duplicates from each experiment are shown. i Heatmaps of -LogP values of GO, Reactome (REAC), KEGG, and WikiPathway (WP) terms for MYCT1 interactome in KG1 and E4EC. Functional enrichment analysis was performed using g:Profiler with g:SCS multiple testing correction method applying significance threshold of 0.05. j Interaction network depicting high confidence functional and physical associations of MYCT1 interactors in KG1 and E4EC generated using STRING v11.5. k Heatmaps showing MYCT1 interactors in KG1 and E4EC by number of peptides, and their average expression from RNAseq in KG1, E4EC (in RPKM, reads per kilobase of transcript per million reads mapped) and sorted ECs and HSPCs from embryonic tissues (5-6 week AGM, aorta-gonad-mesonephros, YS, yolk sac, PL, placenta), second trimester FL, CB and adult bone marrow (ABM) (in FPKM, fragments per kilobase of transcript per million reads mapped). Source Data
Extended Data Fig. 10
Extended Data Fig. 10. Expression of MYCT1 and MYCT1 associated “stemness” programs in HSCs with low, medium or high endocytosis.
a Relative expression of MYCT1 by RT-qPCR in highly purified 4-day cultured HSPCs (CD34+CD38CD90+EPCR+) with low, medium or high internalization of fluorescent dextran (10 KDa). n = 3 independent experiments, mean±s.e.m. two-tailed t-test. b-g Single cell RNAseq dot plots depicting gene expression for the programmes that were found to be governed by MYCT1. HLF+ HSC cultured for 4 days and sorted for low, medium, or high internalization of fluorescent dextran (green box) are compared to control, MYCT1 KD and MYCT1 OE HLF+ (grey box) (From Fig. 2 and Extended Data Fig. 4). n = 1 experiment. The number of cells sequenced per fraction are shown in Supplementary Table 7. Source Data
Extended Data Fig. 11
Extended Data Fig. 11. Endothelial cells as a discovery model for evaluating MYCT1 moderated signalling responses.
a,b Evaluating the effects of MYCT1 KD on endocytosis. Quantification and representative FACS histogram of fluorescent low molecular weight (10 KDa) dextran internalized over 30 min in control or MYCT1 KD E4ECs (a) or non-immortalized HUVECs (b) 72 h after transduction. For E4EC n = 10 (ctrl), n = 8 (KD1) and n = 4 (KD2) from 3 independent experiments, for HUVEC n = 4 replicates from 3 independent experiments, mean±s.e.m, two-tailed paired t-test. c-g Phosphoproteomic analysis of the effects of MYCT1 KD in E4EC 72 h after transduction from n = 1 experiment in technical duplicates. c Experimental outline. d Heatmap depicting the Log2FC for all identified phosphorylated protein sites. Pearson correlation between the two different MYCT1 KD vectors calculated using Excel is included. e Functional enrichment analysis of the differentially phosphorylated proteins. LogP values for selected KEGG, Reactome (REAC) and WikiPathway (WP) terms for the proteins with increased (red) or decreased (blue) phosphorylation after MYCT1 KD compared to control. Performed using g:Profiler with g:SCS multiple testing correction method applying significance threshold of 0.05. f Predicted relative kinase activity (KSEA) in MYCT1 KD compared to control. g Predicted pathways and perturbations enriched after MYCT1 KD determined by PTM-SEA. Schematic in c was created with BioRender (https://www.biorender.com). Source Data
Extended Data Fig. 12
Extended Data Fig. 12. Evaluation of MYCT1 moderated signalling responses in endothelial cell models.
a-c Quantifying basal signalling responses by western blot in control and MYCT1 KD E4EC cultured with continuous presence of serum and cytokines. a Experimental outline. b,c Representative western blot (b) and quantification (c) of phospho-AKT and phospho-ERK in control and MYCT1 KD E4ECs. n = 3 independent experiments, mean±s.e.m, two-tailed ratio-paired t-test. d-g Determining the effect of MYCT1 KD on the signalling responses to cytokine stimulation by western blot in control or MYCT1 KD E4EC. d Experimental outline. e-g Representative western blot (e) and quantification of phospho-AKT and phospho-ERK in control and MYCT1 KD E4ECs after overnight starvation and subsequent stimulation with complete media (containing serum, FGF, EGF and IGF) for 30 min, 1 and 3 h (f). The quantifications under starvation conditions are also shown zoomed in (g). n = 4 (KD1) or n = 5 (KD2) independent experiments, mean±s.e.m, two-tailed ratio-paired t-test. P values in m from left to right for KD1: 0.0152 (pAKT), 0.0491, 0.0288 (pERK1); for KD2: 0.0211, 0.0359 (pAKT), 0.0442, 0.0045, 0.00515 (pERK1), 0.0095, 0.0267 (pERK2). h-k Determining the effect of MYCT1 KD on EGFR internalization and downstream signalling in response to EGF stimulation in non-immortalized HUVECs 72 h after transduction. h Experimental outline. i Quantification of relative membrane EGFR by FACS in starvation or in response to EGF stimulation for 5, 10, and 30 min. n = 3 independent experiments, mean±s.e.m, two-way ANOVA. j,k Representative western blot (j) and quantification (k) of phospho-AKT in control and MYCT1 KD HUVEC after overnight starvation and subsequent stimulation with EGF for 10 and 30 min. n = 4 independent experiments, mean±s.e.m, two-tailed paired t-test. l Model figure of MYCT1 regulated environmental sensing in HSC. For gel source data, see Supplementary Fig. 5. GAPDH is a loading control for AKT in b and j, and a sample processing control for pERK1/2 in b and all antibodies in e. Schematics in a,d,h,l were created with BioRender (https://www.biorender.com). Source Data

References

    1. Ballen KK, Gluckman E, Broxmeyer HE. Umbilical cord blood transplantation: the first 25 years and beyond. Blood. 2013;122:491–498. doi: 10.1182/blood-2013-02-453175. - DOI - PMC - PubMed
    1. Gragert L, et al. HLA match likelihoods for hematopoietic stem-cell grafts in the U.S. Registry. N. Engl. J. Med. 2014;371:339–348. doi: 10.1056/NEJMsa1311707. - DOI - PMC - PubMed
    1. Ng AP, Alexander WS. Haematopoietic stem cells: past, present and future. Cell Death Discov. 2017;3:17002. doi: 10.1038/cddiscovery.2017.2. - DOI - PMC - PubMed
    1. Pineault N, Abu-Khader A. Advances in umbilical cord blood stem cell expansion and clinical translation. Exp. Hematol. 2015;43:498–513. doi: 10.1016/j.exphem.2015.04.011. - DOI - PubMed
    1. Cohen S, et al. Hematopoietic stem cell transplantation using single UM171-expanded cord blood: a single-arm, phase 1–2 safety and feasibility study. Lancet Haematol. 2020;7:e134–e145. doi: 10.1016/S2352-3026(19)30202-9. - DOI - PubMed

MeSH terms

LinkOut - more resources