. 2024 Jul;631(8019):216-223.
doi: 10.1038/s41586-024-07517-7. Epub 2024 Jun 5.

Single-cell nascent RNA sequencing unveils coordinated global transcription

Affiliations

Single-cell nascent RNA sequencing unveils coordinated global transcription

Dig B Mahat et al. Nature. 2024 Jul.

Abstract

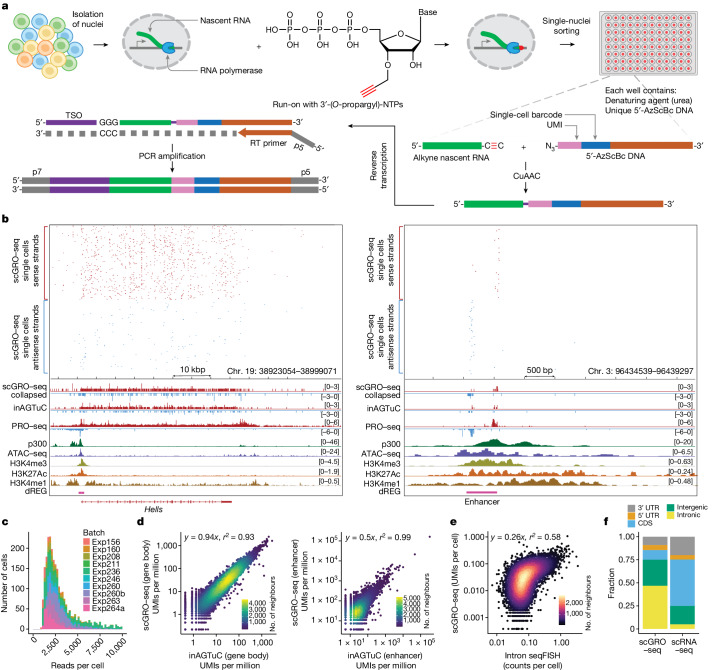
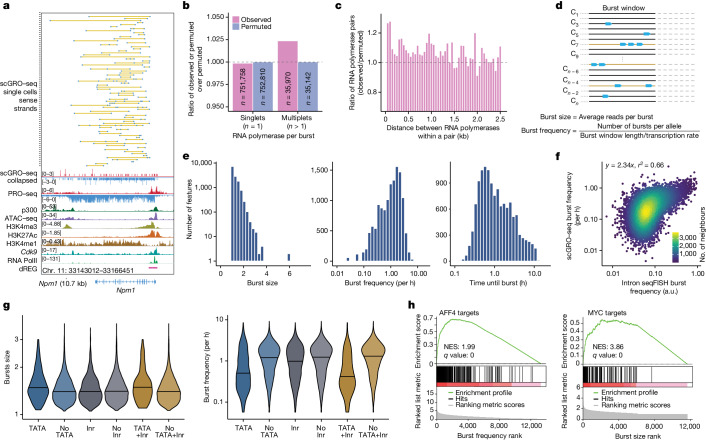
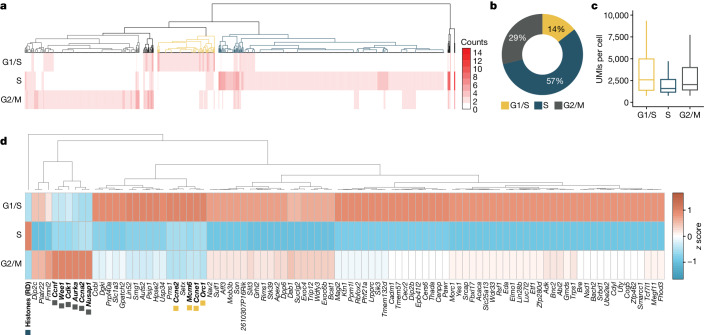
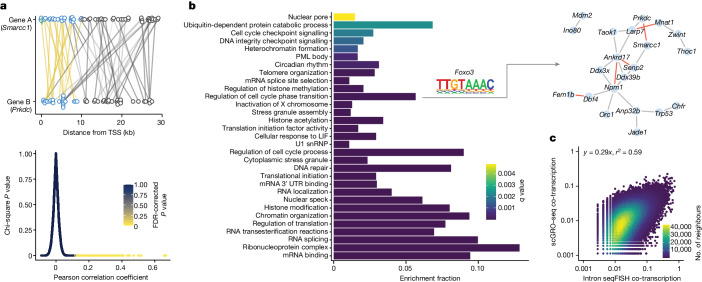
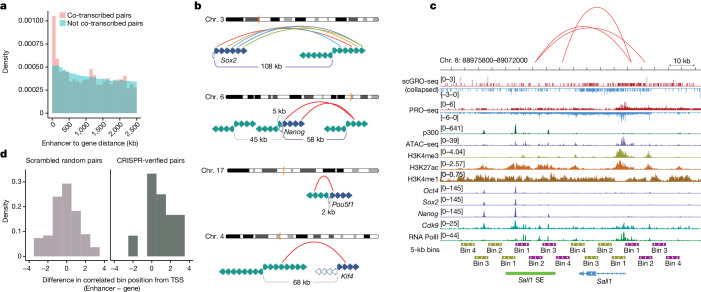
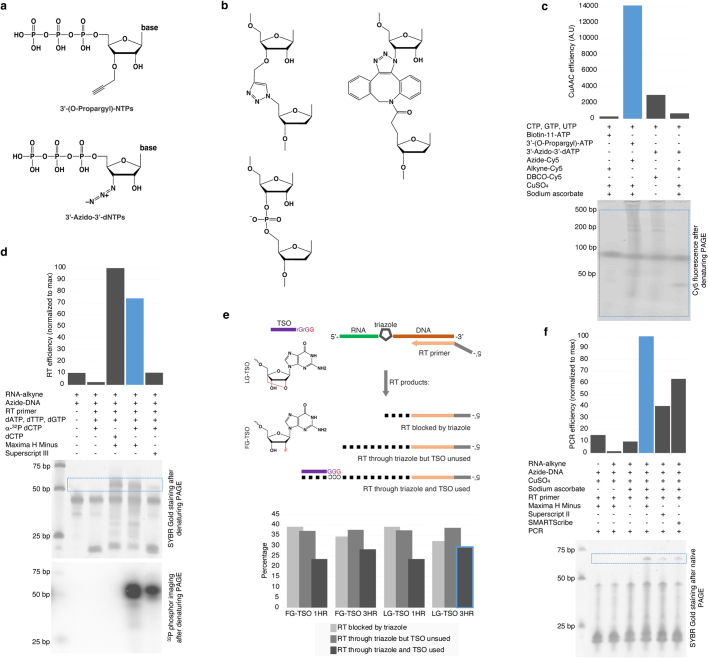
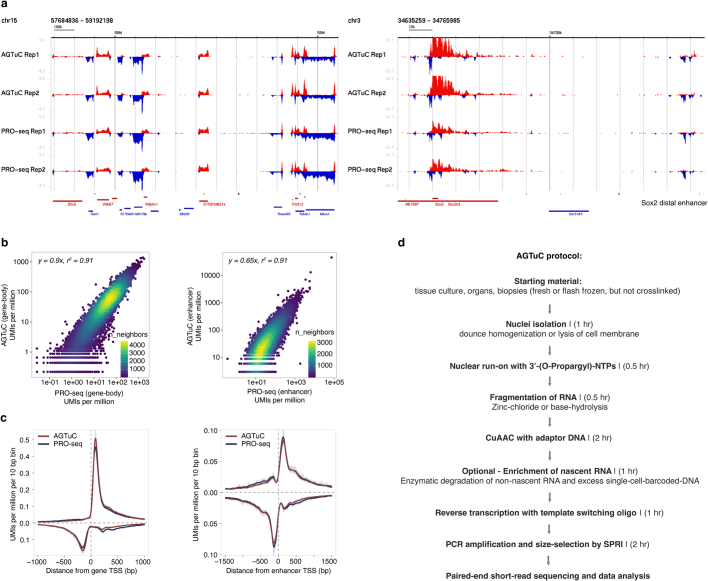
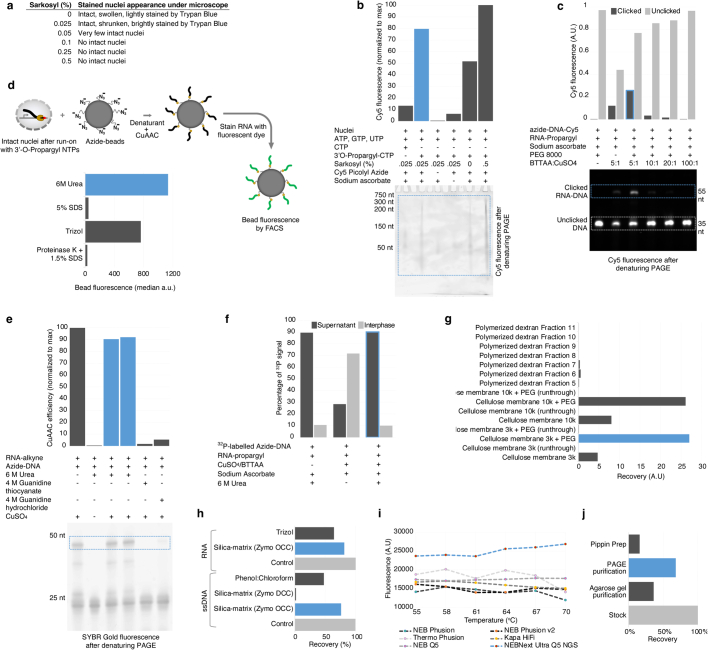
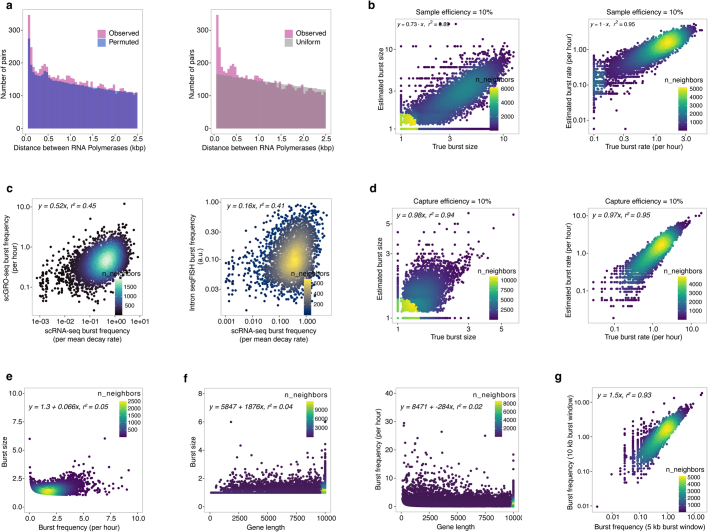
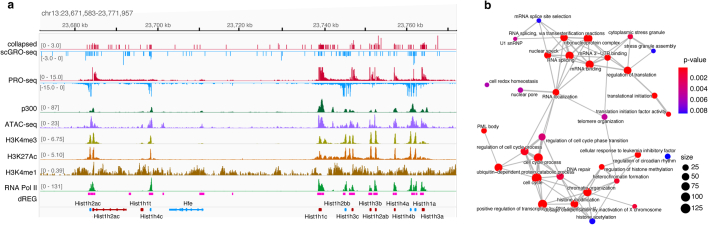
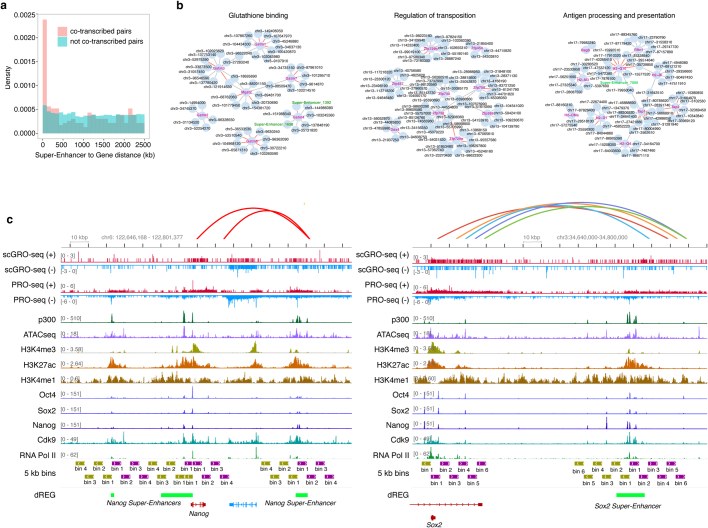
Transcription is the primary regulatory step in gene expression. Divergent transcription initiation from promoters and enhancers produces stable RNAs from genes and unstable RNAs from enhancers1,2. Nascent RNA capture and sequencing assays simultaneously measure gene and enhancer activity in cell populations3. However, fundamental questions about the temporal regulation of transcription and enhancer-gene coordination remain unanswered, primarily because of the absence of a single-cell perspective on active transcription. In this study, we present scGRO-seq-a new single-cell nascent RNA sequencing assay that uses click chemistry-and unveil coordinated transcription throughout the genome. We demonstrate the episodic nature of transcription and the co-transcription of functionally related genes. scGRO-seq can estimate burst size and frequency by directly quantifying transcribing RNA polymerases in individual cells and can leverage replication-dependent non-polyadenylated histone gene transcription to elucidate cell cycle dynamics. The single-nucleotide spatial and temporal resolution of scGRO-seq enables the identification of networks of enhancers and genes. Our results suggest that the bursting of transcription at super-enhancers precedes bursting from associated genes. By imparting insights into the dynamic nature of global transcription and the origin and propagation of transcription signals, we demonstrate the ability of scGRO-seq to investigate the mechanisms of transcription regulation and the role of enhancers in gene expression.


Conflict of interest statement

US patent number US-11519027-B2 on ‘Single-cell RNA sequencing using click-chemistry’ was granted on 6 December 2022 to the Massachusetts Institute of Technology, Cambridge, MA, USA, on which P.A.S. and D.B.M. are named inventors. The other authors declare no competing interests.

Figures

Fig. 1
Fig. 1. Schematics and benchmarking of single-cell nascent RNA sequencing.
a, A summary of the scGRO–seq workflow. b, Representative genome browser screenshots showing scGRO–seq UMIs at a single-cell resolution, the aggregate scGRO–seq profile, the inAGTuC profile, the PRO–seq profile and chromatin marks around a gene (left) and an enhancer (right). c, Distribution of scGRO–seq UMIs per cell. d, Correlation between aggregate scGRO–seq and inAGTuC UMIs per million sequences in the body of genes (left, n = 19,961) and enhancers (right, n = 12,542). UMIs from the 500 bp regions from each end of the genes and 250 bp regions from each end of the enhancers analysed were removed to only include nascent RNA from elongating RNA polymerases. Data are plotted on a log–log scale to show the range of data distribution. e, Correlation between scGRO–seq UMIs per cell from up to the first 20 kb of genes and intron seqFISH counts per cell in the body of genes used in the intron seqFISH study (n = 9,666). f, Distribution of scGRO–seq and scRNA-seq UMIs in various genomic regions.
Fig. 2
Fig. 2. Inference of transcription kinetics using scGRO–seq.
a, Single-cell view of multiplet RNA polymerase (blue dots) in Npm1. A yellow line connects RNA polymerases within the same cell. Randomly sampled 75 single cells containing more than one RNA polymerase are shown on the top, followed by the aggregate scGRO–seq, PRO–seq, chromatin marks and transcription-associated factors profiles. b, Ratio of observed or permuted burst sizes compared against the average burst sizes from 200 permutations. c, Ratio of the observed distance between consecutive RNA polymerases in the first 10 kb of gene bodies in individual cells against the permuted data. Distances up to 2.5 kb are shown in 50 bp bins. d, Illustration of the model used for direct inference of burst kinetics from scGRO–seq data. e, Histogram of burst size (left), burst frequency (middle) and duration until the next burst (1/burst frequency) (right) for genes that are at least 10 kb long (n = 13,142). f, Correlation of burst frequency of genes between scGRO–seq and intron seqFISH data. g, Effect of promoter elements in burst size greater than 1 (left) and burst frequency (right). Inr, the initiator motif. The centre line indicates the median of the distribution. h, Gene set enrichment analyses showing the role of transcription factors in determining burst frequency and burst size.
Fig. 3
Fig. 3. Cell cycle inference by non-polyadenylated replication-dependent histone gene expression.
a, Heatmap of hierarchical clustering of single cells representing transcription of G1/S-specific, S-specific and G2/M-specific genes. The dendrogram colours represent cell clusters with cell-cycle-phase-specific gene transcription. b, Fraction of cells in the three primary clusters distinguished by transcription of G1/S-specific, S-specific and G2/M-specific genes. c, Distribution of scGRO–seq UMIs per cell in the three clusters of cells (n = 122, 479 and 244 cells, respectively, from 10 independent batches) defined by cell-cycle-phase-specific gene transcription. The centre line indicates the median, the box represents the data between the first and third quantiles, the whiskers indicate the 1.5 interquartile range, and points outside the whiskers indicate outliers. d, Differentially expressed genes among the three clusters of cells defined by transcription of G1/S-specific, S-specific and G2/M-specific genes. The genes used to classify cells are denoted in bold and coloured boxes. Histones (RD) represent aggregate reads from replication-dependent histone genes.
Fig. 4
Fig. 4. Coordinated transcription of functionally related genes.
a, Top, a pair of co-transcribed genes. Reads within the first 10 kb of the gene pair (blue circle) expressed in the same cells are connected by a yellow line. Reads beyond the first 10 kb (grey circles and lines) were not used in the gene–gene correlation. Bottom, pair-wise Pearson correlation was calculated from a binarized genes by cells matrix. The relationship among the Pearson correlation coefficient, uncorrected chi-square P value and the FDR-corrected P value using the Benjamini–Hochberg correction method for pairwise gene–gene correlation. b, Gene ontology (GO) terms enriched in co-transcribed gene modules. The transcription factor motif enriched in the promoters of genes associated with the GO term and the co-transcribed genes that contributed to the enrichment of the GO term is shown as an example on the right (red line indicating ρ > 0.15). A complete list of GO terms and the co-transcribed genes contributing to the enrichment of the GO terms is provided in Supplementary Table 5. c, Correlation of co-transcription of significantly co-transcribed gene pairs (n = 164,380) between scGRO–seq and intron seqFISH data. Axes represent the fraction of cells in which a gene pair is co-transcribed.
Fig. 5
Fig. 5. Spatial and temporal coordination between genes and enhancers.
a, Distance between correlated and non-correlated enhancer–gene pairs within 2.5 Mb of each other. b, Co-transcription between pluripotency genes (filled blue arrows indicate sense gene bins, open blue arrows indicate antisense gene bins) and their enhancers (represented by green arrows, and the arrow directions indicate sense and antisense directions). Correlated full-length enhancer–gene pairs (Sox2 and Nanog) are shown with purple distance bars. For finer time resolution correlation, features are extended up to the end of the transcription signal and divided into 5 kb bins. Correlated bins are represented by a red arch, except for Sox2 and its distal enhancer bins, which are shown in different colours for visual aid. c, Co-transcription between Sall1 and its CRISPR-verified SE. Correlated SE–gene bins are denoted by arches. d, Summary of correlated bin positions in CRISPR-verified SE–gene pairs. Scrambled random pairs served as a control.
Extended Data Fig. 1
Extended Data Fig. 1. click-chemistry mediated nascent RNA conjugation to single-stranded DNA and optimization of reverse transcription.
a, Click-chemistry compatible nucleotides tested in AGTuC development. A few nucleotide triphosphates were custom synthesized or sourced with few properties in mind - smaller size, chain termination ability, and the possibility of incorporation by native RNA polymerases. b, Structure of the triazole linkage formed by CuAAC between the nascent-RNA terminally labeled with 3′-(O-Propargyl)-NTPs and the azide-labeled DNA (top left), the linkage formed by SPAAC between the nascent-RNA terminally labeled with 3′-Azido-3′-dNTPs and DBCO DNA (right). The phosphodiester linkage in a native oligonucleotide is shown for comparison (bottom left). c, Incorporation efficiency of 3′-(O-Propargyl)-ATP or 3′-Azido-3′-dATP by native RNA polymerase in nuclear run-on reaction. The propargyl or azide labeled nascent RNA is clicked with Cy5 via CuAAC (Azide-Cy5 or Alkyne-Cy5) or SPAAC (DBCO-Cy5), resolved in a denaturing polyacrylamide gel electrophoresis (PAGE), and quantified by measuring the Cy5 fluorescent from the gel image. The blue dotted line represents the quantified gel region. d, Relative quantification of reverse transcription (RT) efficiency of two commercial enzymes traversing through the triazole link formed between the alkyne-labeled RNA and azide-labeled DNA by CuAAC. RT was performed in the presence of either native dCTP or radioisotope a-32P dCTP, and the RT reaction was resolved in denaturing PAGE and imaged sequentially for nucleic acid signal (top gel) and radioisotope signal (bottom gel). e, Quantification of aborted intermediate and completed desired products (RT through triazole and TSO used) formed during the one hour or three hours of RT using TSO with terminal Locked-Nucleic-Acid-Guanosine (LG) or 2′-Fluoro-Guanosine (FG). f, Confirmation and relative quantification of CuAAC, RT, and PCR of clicked product formed between the alkyne-labeled RNA and azide-labeled DNA by three commercial Reverse transcriptase enzymes. Note: The blue bar, line, or border represents the “winner” condition. Polyacrylamide gel electrophoresis for c, d, and f was repeated at least twice with the addition or subtraction of some conditions presented here. For gel source data, see Supplementary Fig. 1.
Extended Data Fig. 2
Extended Data Fig. 2. Comparison between AGTuC and PRO-seq.
a, Representative genome-browser screenshots with two replicates of AGTuC and PRO-seq showing a region in chromosome 15 (left) and a region in chromosome 3 containing the Sox2 gene and its distal enhancer (right) of the mouse genome (mm10). b, Correlation between AGTuC and PRO-seq UMIs per million sequences in gene bodies (left, n = 19,961) and enhancers (right, n = 12,542). UMIs from the 500 bp regions from each end of the genes and 250 bp regions from each end of the enhancers were removed to only include nascent RNA from elongating RNA polymerases, and the data was plotted on a log-log scale to show the range of data distribution. c, Metagene profiles of AGTuC and PRO-seq UMIs per million per 10 base pair bins around the TSS of genes (left, n = 19,961) and enhancers (right, n = 12,542). The line represents the mean, and the shaded region represents a 95% confidence interval. d, Major steps with the approximate time required in AGTuC library preparation.
Extended Data Fig. 3
Extended Data Fig. 3. Optimization of intact nuclei run-on reaction and NGS library preparation steps.
a, Physical appearance of Trypan Blue stained nuclei under microscope treated with various sarkosyl concentrations. b, Relative quantification of nuclear run-on efficiency with various sarkosyl concentrations. Nascent RNA collected after nuclear run-on reaction with either native CTP or click-compatible 3′-(O-Propargyl)-CTP was clicked with Cy5-azide, resolved in denaturing PAGE, and imaged for Cy5 fluorescence. c, Effect of different ratios of CuAAC accelerating ligand BTTAA in CuAAC efficiency. RNA-propargyl was clicked with azide-DNA containing Cy5 in the presence of various ratios of BTTAA:CuSO4, resolved in denaturing PAGE, and imaged for Cy5 fluorescence. d, Relative quantification of denaturing efficiency of commonly used denaturing agents to release the nascent RNA from RNA polymerase complex. Intact nuclei after run-on with 3′-(O-Propargyl)-NTPs were treated with denaturing agents in the presence of azide-labeled beads and CuAAC reagents, allowing nascent RNA to click with the beads. Beads were stained with RNA-binding dye and measured for fluorescence by FACS. e, Effect of denaturing agent’s presence in CuAAC efficiency. The blue outline in the image of denaturing PAGE denotes the click product between the RNA-alkyne and azide-DNA. f, Role of urea in the residence of clicked RNA-DNA conjugate in either supernatant or interphase of Trizol during the clean-up of CuAAC reaction, as quantified by the scintillation count of 32P radioisotope. g, Desalting (removal of CuSO4, BTTAA, and sodium ascorbate from CuAAC reaction) efficiency of polymerized dextran and cellulose membrane. Fluorescence from Cy5-labeled RNA-DNA conjugate was measured in elution fractions from columns packed with polymerized dextran and elution from different pore-size cellulose membrane centrifugation tubes with or without PEG 8000. h, Relative recovery of ssDNA or RNA from phenol:chloroform or silica-based matrix column purification. Clicked RNA-DNA conjugate was radioisotope labeled using Polynucleotide kinase and γ-32P ATP, and the cleaned reaction was quantified using a scintillation counter. i, PCR amplification efficiency of clicked RNA-DNA conjugate using different commercial PCR amplification kits. The PCR reaction was resolved in native PAGE, stained with SYBR Gold, and quantified using ImageJ software. j, Relative recovery of size-selected dsDNA. A mock NGS library (purified PCR product) was selected for the desired size using various size-selection methods, and the recovered dsDNA was quantified using a dsDNA-specific fluorescence kit (Qubit). The bar represents the average of two independent replicates. Note: The blue bar, line, or border represents the “winner” condition. Polyacrylamide gel electrophoresis for b, c, and e was repeated at least twice with the addition or subtraction of some conditions presented here. For gel source data, see Supplementary Fig. 2.
Extended Data Fig. 4
Extended Data Fig. 4. Benchmarking inAGTuc against AGTuC and PRO-seq.
a, Representative genome-browser screenshots with two replicates of inAGTuC, AGTuC, and PRO-seq showing a region in chromosome 8 (left) and a region in chromosome 4 of the mouse genome (mm10). b, c, Comparison of inAGTuC metagene profiles with PRO-seq and AGTuC using UMIs per million per 10 base pair bins around (b) the TSS of genes (n = 19,961) and (c) enhancers (n = 12,542). The line represents the mean, and the shaded region represents a 95% confidence interval. d, Correlations of inAGTuC UMIs per million sequences in gene bodies (n = 19,961) between the four replicates. e, Distribution of UMIs per well (left) and features per well (right) in four replicates of 96-well plate inAGTuC libraries. Each well contains 100 nuclei. f, Relationship between the UMIs per well and the number of features detected per well in four replicates of 96-well plate inAGTuC libraries. g, Correlation between inAGTuC and AGTuC UMIs per million sequences in the body of genes (n = 19,961) and enhancers (n = 12,542). h, Correlation between inAGTuC and PRO-seq UMIs per million sequences in the body of genes (n = 19,961) and enhancers (n = 12,542). For panels g and h, UMIs from the 500 bp regions from each end of the genes and 250 bp regions from each end of the enhancers were removed to only include nascent RNA from elongating RNA polymerases, and the data was plotted on a log-log scale to show the range of data distribution.
Extended Data Fig. 5
Extended Data Fig. 5. Feasibility demonstration of inAGTuC with fewer cells.
a, Representative genome-browser screenshots of inAGTuC library from one 96-well plate with each well containing either 12, 120, or 1200 cells per well (cpw) showing two regions in chromosome 17 of the mouse genome (mm10). inAGTuC library with 1200 cpw but without Cu(I) in the CuAAC reaction (fourth track) and the PRO-seq library (fifth track) serve as the negative and positive control, respectively. b, Correlations among 12 cpw, 120 cpw, and 1200 cpw inAGTuC libraries in the body of genes (n = 19,961). c, Distribution of UMIs per well (top) and genes per well (bottom) in 12 cpw, 120 cpw, and 1200 cpw inAGTuC libraries. d, Correlations between PRO-seq and 12 cpw, 120 cpw, and 1200 cpw inAGTuC libraries in the body of genes (n = 19,961). For panels b and d, UMIs from the 500 bp regions from each end of the genes were removed to only include nascent RNA from elongating RNA polymerases, and the data was plotted on a log-log scale to show the range of data distribution.
Extended Data Fig. 6
Extended Data Fig. 6. scGRO-seq library preparation.
Major steps involved in scGRO-seq library preparation.
Extended Data Fig. 7
Extended Data Fig. 7. Additional benchmarking of scGRO-seq.
a, Coefficient of determination (r2) between each 96-well plate from scGRO-seq batches that passed the quality-control threshold. r2 was calculated from average UMIs per 96 cells in all genes and enhancers. b, Distribution of scGRO-seq features (genes + enhancers) per cell. c, Relationship between the number of features detected per cell and the UMIs per cell (left) or UMIs in features per cell (right) in scGRO-seq. Colors indicate different batches of scGRO-seq. d, Correlation between scGRO-seq and PRO-seq UMIs per million sequences in gene bodies (left, n = 19,961) and enhancers (right, n = 12,542). UMIs from the 500 bp regions from each end of the genes and 250 bp regions from each end of the enhancers were removed to only include nascent RNA from elongating RNA polymerases, and the data was plotted on a log-log scale to show the range of data distribution. e, Metagene profiles of scGRO-seq compared with inAGTuC UMIs per million per 10 base pair bins around the TSS of genes (left, n = 19,961) and enhancers (right, n = 12,542). The line represents the mean, and the shaded region represents the 95% confidence interval. f, Comparison of metagene profiles between scGRO-seq and PRO-seq UMIs per million per 10 base pair bins around the TSS of genes (left, n = 19,961) and enhancers (right, n = 12,542). The line represents the mean, and the shaded region represents 95% confidence interval. g, Correlation between scGRO-seq and scRNA-seq UMIs per cell in the body of genes (left, n = 19,961). UMIs from the 500 bp regions from each end of the genes were removed to only include nascent RNA from elongating RNA polymerases, and the data was plotted on a log-log scale to show the range of data distribution.
Extended Data Fig. 8
Extended Data Fig. 8. Effect of transcription level, gene length, and burst duration in transcription burst kinetics.
a, Distribution of distances between consecutive RNA polymerases in the first 10 kb of the gene body in single cells compared with distances from permuted data (randomized cell ID while maintaining UMIs per cell but unchanged read position, left) or uniform data (randomized read position along the gene but unchanged cell ID, right). Distances up to 2.5 kb are shown. b, Test of burst kinetics estimators by simulating burst size and burst frequency. c, Test of our burst kinetics estimators by simulating read counts using burst size and frequency inferred from observed scGRO-seq dataset. d, Correlation of burst frequency of genes higher than 0.1 in both datasets between scGRO-seq and intron seqFISH. e, Correlation between the burst frequency from scGO-seq (top) and intron seqFISH (bottom) with the burst frequency from scRNA-seq. f, The effect of gene length (from 100 bp to 10 kb after trimming 500 bp on either end of the genes) on burst size and frequency. g, Correlation between burst frequencies calculated from the burst window of either the first 5 kb or the first 10 kb gene bodies. In panels b-g with the log-log scale, the data was plotted on a log-log scale to show the range of data distribution. The y = mx fit was derived from linear data.
Extended Data Fig. 9
Extended Data Fig. 9. Co-transcription of genes with shared function.
a, Genome-browser screenshot of the histone locus body in mouse chromosome 13 showing transcription of replication-dependent histone genes. b, Network of enriched gene ontology terms in co-transcribed genes prepared using “enrichGO” function in clusterProfiler R package. A connecting gray line represents at least a 10% overlap of genes between the GO terms. The color of the dots represents the p-value calculated by the clusterProfiler, and the dot size represents the number of contributing genes in the GO term.
Extended Data Fig. 10
Extended Data Fig. 10. Organization of enhancer-gene co-transcription networks.
a, Distance between correlated and non-correlated SE-gene pairs within 2.5 Mb of each other. b, Co-transcription network of functionally related genes clustered together on the same chromosome shown as examples. Red edges between the enhancer-gene pairs indicate rho > 0.15, and rho > 0.1 and <0.15 are shown in gray. c, Co-transcription between the Sox2 gene and its distal enhancer (left), and the Nanog gene and its three enhancers (right). Green bars represent the annotated SE regions, and the 5 kb bins in sense and antisense strands are represented in magenta and yellow-green bars.

Update of

Similar articles

Cited by

References

    1. Birney E, et al. Identification and analysis of functional elements in 1% of the human genome by the ENCODE pilot project. Nature. 2007;447:799–816. - PMC - PubMed
    1. Core LJ, Waterfall JJ, Lis JT. Nascent RNA sequencing reveals widespread pausing and divergent initiation at human promoters. Science. 2008;322:1845–1848. - PMC - PubMed
    1. Core LJ, et al. Analysis of nascent RNA identifies a unified architecture of initiation regions at mammalian promoters and enhancers. Nat. Genet. 2014;46:1311–1320. - PMC - PubMed
    1. Chubb JR, Trcek T, Shenoy SM, Singer RH. Transcriptional pulsing of a developmental gene. Curr. Biol. 2006;16:1018–1025. - PMC - PubMed
    1. Raj A, Peskin CS, Tranchina D, Vargas DY, Tyagi S. Stochastic mRNA synthesis in mammalian cells. PLoS Biol. 2006;4:e309. - PMC - PubMed