. 2024 Jun;630(8017):677-685.
doi: 10.1038/s41586-024-07525-7. Epub 2024 Jun 5.

Myelin plasticity in the ventral tegmental area is required for opioid reward

Affiliations

Myelin plasticity in the ventral tegmental area is required for opioid reward

Belgin Yalçın et al. Nature. 2024 Jun.

Abstract

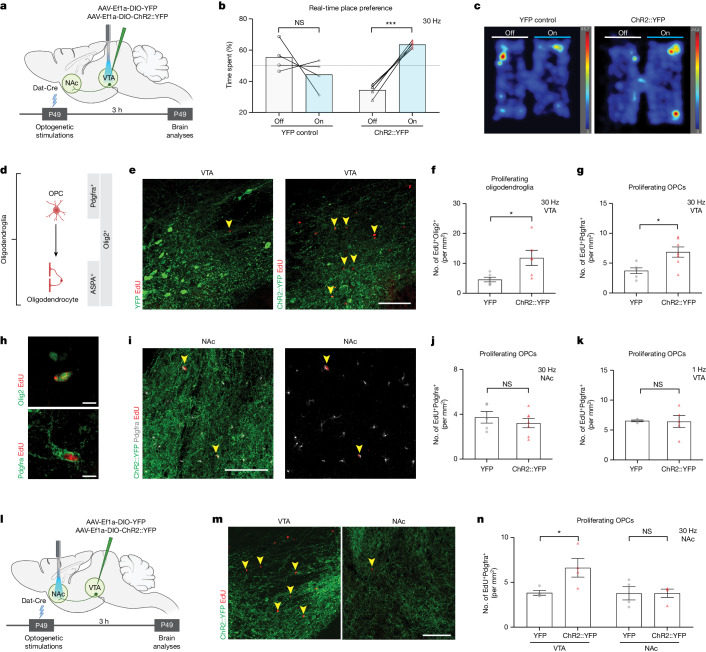
All drugs of abuse induce long-lasting changes in synaptic transmission and neural circuit function that underlie substance-use disorders1,2. Another recently appreciated mechanism of neural circuit plasticity is mediated through activity-regulated changes in myelin that can tune circuit function and influence cognitive behaviour3-7. Here we explore the role of myelin plasticity in dopaminergic circuitry and reward learning. We demonstrate that dopaminergic neuronal activity-regulated myelin plasticity is a key modulator of dopaminergic circuit function and opioid reward. Oligodendroglial lineage cells respond to dopaminergic neuronal activity evoked by optogenetic stimulation of dopaminergic neurons, optogenetic inhibition of GABAergic neurons, or administration of morphine. These oligodendroglial changes are evident selectively within the ventral tegmental area but not along the axonal projections in the medial forebrain bundle nor within the target nucleus accumbens. Genetic blockade of oligodendrogenesis dampens dopamine release dynamics in nucleus accumbens and impairs behavioural conditioning to morphine. Taken together, these findings underscore a critical role for oligodendrogenesis in reward learning and identify dopaminergic neuronal activity-regulated myelin plasticity as an important circuit modification that is required for opioid reward.


Conflict of interest statement

R.C.M. is now on leave from Stanford, functioning as the Chief Scientific Officer at Bayshore Global Management. He is on the scientific advisory boards of MapLight Therapeutics, MindMed, Bright Minds Biosciences and Aelis Farma. M.M. holds equity in MapLight Therapeutics and CARGO Biosciences. The remaining authors declare no competing interests.

Figures

Fig. 1
Fig. 1. Reward circuitry DA neuron activity increases OPC proliferation in VTA.
a, Experimental paradigm for DA neuron stimulation in VTA. b, The 30 Hz optogenetic stimulation of DA neurons increases real-time place preference (n = 4 YFP control mice; n = 5 ChR2::YFP mice). c, Representative heatmaps illustrating the time spent in different compartments during the real-time place preference test. d, Schematic of oligodendroglial lineage; Olig2 is an oligodendroglial lineage marker and Pdgfrα marks OPCs and ASPA marks mature oligodendrocytes. ek, Optogenetic stimulation of DA neurons (YFP, green) results in oligodendroglial precursor proliferation in VTA. Confocal micrographs of proliferating cells (EdU+, red) in VTA (e) and in NAc (i). Scale bars, 100 µm. The 30 Hz stimulation of VTA DA neurons increases proliferative oligodendroglial lineage (Olig2+EdU+) (f) and oligodendrocyte precursor (Pdgfrα+EdU+) (g) cells in VTA (n = 6 mice per group). h,i, Representative confocal images. Scale bars, 10 µm. j,k, OPC proliferation (Pdgfrα+EdU+) does not change in NAc after 30 Hz VTA stimulation (j) or in VTA after 1 Hz VTA stimulation (k) (n = 4 YFP control mice; n = 5 ChR2::YFP mice). l, Experimental paradigm for optogenetic stimulation of DA axons (YFP, green) in NAc. m, Proliferating cells (EdU+, red, arrowheads) in NAc and VTA after 30 Hz NAc stimulation of DA axons (ChR2::YFP, green). Scale bars, 100 µm. n, The 30 Hz NAc stimulation of DA axons increases OPC proliferation (Pdgfrα+EdU+) in VTA but not in NAc (YFP and ChR2::YFP, n = 4). Scale bars, 100 µm. b, Paired two-tailed t-test for each condition. h,I,j,k, Unpaired two-tailed t-test. NS, not significant P > 0.5, *P < 0.05, **P < 0.01, ***P < 0.001. Each data point is one mouse; data shown as mean; error bars, s.e.m. a,d,l, Schematics created with BioRender.com. Source Data
Fig. 2
Fig. 2. DA neuron activity regulates myelination in VTA.
a, Experimental paradigm for optogenetic DA neuron stimulation (30 Hz) in VTA daily for 1 week, with brain analyses 4 weeks after the end of optogenetic stimulations. bd, DA neuron stimulation increases oligodendrocytes (ASPA+ EdU+) in VTA (b) but not in NAc (c) or MFB (d) (n = 6 YFP control mice; n = 7 ChR2::YFP mice). e, Representative confocal micrographs of new oligodendrocytes (ASPA+ (grey), EdU+ (red, yellow arrowheads) in VTA. Scale bar, 50 µm. f, Myelination in VTA, yellow dotted line marks VTA border, DA neurons expressing ChR2::YFP (green); MBP (grey). Scale bar, 50 µm. g, DA neuron stimulation increases normalized myelin protein expression (ratio of average MBP intensity to DA neuron per axon area (mm2) in VTA) (n = 6 YFP control mice; n = 7 ChR2::YFP mice). h, Experimental paradigm for electron microscopy analyses, as in a. i, DA neuron stimulation increases myelinated axon density of medium-sized (500–1,000 nm) axons. j, Electron micrographs show myelinated axons in VTA. Scale bar, 1 µm (n = 5 mice per group). k, Scatter plot of g-ratio as a function of axon calibre; YFP control axons (black dots) ChR2::YFP axons (red triangles). l, DA neuron stimulation reduces g-ratio of the medium-sized (500–1,000 nm) axons in VTA, indicating an increase in myelin sheath thickness. Unpaired two-tailed t-test. NS, not significant P > 0.5, *P < 0.05, ***P < 0.001. Each data point represents a mouse; data shown as mean; error bars, s.e.m. a,h, Schematics created with BioRender.com. Source Data
Fig. 3
Fig. 3. Morphine and cocaine promote oligodendrogenesis in VTA.
a, Experimental paradigm, OPC proliferation 3 h after administration of morphine or cocaine. b, Representative confocal micrograph of VTA, TH (DA neurons, green), Pdgfrα+ (OPCs, grey) and EdU+ (red). Scale bar, 50 µm. c, Single dose of morphine or cocaine increases proliferating OPCs (Pdgfrα+EdU+) in VTA but not in NAc (saline, n = 7 mice; morphine, n = 8 mice; cocaine, n = 8 mice). d, Experimental paradigm for CPP. e,f, Morphine or cocaine conditioning increases locomotor sensitivity (saline, n = 12 mice; morphine (10 mg kg−1), n = 12 mice; morphine (20 mg kg−1), n = 11 mice; cocaine, n = 8 mice) (e) and induces a robust place preference for the conditioning chamber (f). g, Morphine or cocaine conditioning increases CPP score (post-test − pre-test preference) (saline, n = 18 mice; morphine (10 mg kg−1), n = 20 mice; morphine (20 m kg−1), n = 11 mice; cocaine, n = 16 mice). h, Both morphine and cocaine conditioning increase proliferative OPCs (Pdgfrα+EdU+) in VTA but only morphine at 20 mg kg−1 increases OPC proliferation in NAc (saline, n = 13 mice; morphine (10 mg kg−1), n = 8 mice; morphine (20 mg kg−1), n = 11 mice; cocaine, n = 16 mice). i, New oligodendrocytes after morphine (10 mg kg−1) exposure (ASPA+ EdU+). Scale bar, 10 µm. j, Both morphine and cocaine conditioning increase oligodendrocytes (ASPA+ EdU+) in VTA (saline, n = 12; morphine (10 mg kg−1), n = 8; morphine (20 mg kg−1), n = 11; cocaine, n = 16). k, The snRNA-seq identifies baseline interactions among VTA cell populations. DA neurons show strong interactions with OPCs (left, thick line from DA neurons to OPCs) and OPCs show strong interactions with DA neurons (right, thick line from OPCs to DA neurons). f, Paired two-tailed t-test. c,g,I,j, Unpaired two-tailed t-test. NS, not significant; P > 0.5, *P < 0.05, ***P < 0.001. Each data point represents a mouse; data shown as mean; error bars, s.e.m. a,d, Schematics created with BioRender.com. Source Data
Fig. 4
Fig. 4. Genetic blockade of oligodendrogenesis abrogates morphine-induced reward learning by attenuating DA release.
a, Experimental paradigm for CPP testing in Myrf-wild-type control or MyrfOPC−/ mice. b, Locomotor sensitivity during morphine conditioning (control, n = 18 mice; Myrf−/−, n = 16 mice) (control, n = 14; TrkB/−, n = 15). c, Control mice acquire a place preference for the morphine conditioning chamber, whereas MyrfOPC−/ mice or TrkBOPC−/− mice (i) do not show a strong preference (control, n = 18; Myrf−/, n = 16). d,j, Myrf−/ mice (d) and TrkBOPC−/− mice (j) show decreased CPP score (post-test − pre-test preference). e, Representative confocal micrograph of proliferating OPCs in VTA after morphine CPP, arrowheads denote proliferative OPCs (Pdgfrα+EdU+), TH (green), Pdgfrα+ (grey), EdU+ (red). Scale bar, 50 µm. f, Proliferative OPCs in VTA of control or MyrfOPC−/ mice after morphine CPP (n = 18 control mice; n = 15 MyrfOPC−/ mice) g, Experimental paradigm for CPP in TrkBOPC−/− mice. h, Locomotor sensitivity during morphine conditioning in control or TrkBOPC−/ mice. i,j,k, CPP as in c (i), d (j) and e (k) in the TrkBOPC−/− mouse model (n = 14 control mice; n = 15 TrkBOPC−/−). l, as in f, n = 12 control; n = 16 TrkB/ mice. m, Experimental paradigm for dopamine release detection in MyrfOPC−/− model with fibre photometry (FP) during before and after morphine CPP. n, Group average GRABDA responses in NAc on first entry into the conditioning chamber in control and MyrfOPC−/− mice. o,p, Dopamine release in control and MyrfOPC−/− mice before (o) and after (p) morphine CPP (n = 8 control mice; n = 10 MyrfOPC−/−). c,i, Paired two-tailed t-test. d,f,j,l,o,p, Unpaired two-tailed t-test. NS, not significant; P > 0.5, *P < 0.05, **P < 0.01, ***P < 0.001, ****P < 0.0001. Each data point represents a mouse; data shown as mean; error bars, s.e.m. a,g,m, Schematics created with BioRender.com. Source Data
Extended Data Fig. 1
Extended Data Fig. 1. Optogenetic activation of dopaminergic neuron activity.
a, Experimental timeline for optogenetics experiments. b, Colocalization of YFP (green, panels above) or ChR2::YFP (green, panels below) with the dopaminergic neuron marker, TH (magenta) in VTA, scale bar= 50 µm. c, Experimental timeline for optogenetics stimulations. d, 30 Hz optogenetic stimulation of ChR2::YFP+ neurons increases cfos labeling in VTA within 90 min (YFP, n = 3; ChR2::YFP, n = 4). e, Colocalization of YFP (green, panels above) or ChR2::YFP (green, panels below) with the immediate early gene marker, cfos (grey) indicating neuronal activity in VTA. Unpaired two-tailed t-test, **p < 0.01. Each data point represents a mouse, data shown as mean, error bars indicate SEM. a,c, Schematics created with BioRender.com. Source Data
Extended Data Fig. 2
Extended Data Fig. 2. Dopaminergic neuron activity promotes new oligodendroglia in VTA.
a, Experimental paradigm for acute dopaminergic neuron stimulation in VTA; 30 min optogenetic stimulation followed by brain analysis after 3 h. b, 30 Hz VTA stimulation of dopaminergic neurons does not change proliferating oligodendroglia (Olig2+ EdU+) in NAc (YFP, n = 4 mice; ChR2::YFP, n = 5 mice). c, 1 Hz VTA stimulation of dopaminergic neurons does not change proliferating oligodendroglia (Olig2+ EdU+) in VTA (YFP, n = 4 mice; ChR2::YFP, n = 5 mice). d, Experimental paradigm for acute dopaminergic neuron stimulation in NAc; 30 min optogenetic stimulation followed by brain analysis after 3 h. e, 30 Hz stimulation of dopaminergic neurons increases proliferating oligodendroglia (Olig2+ EdU+) in VTA but not in NAc (YFP, n = 4 mice; ChR2::YFP, n = 4 mice). f, Experimental paradigm for acute GABAergic neuron inhibition in VTA; 30-min optogenetic inhibition followed by brain analysis after 3 h. g, VTA inhibition of GABAergic neurons increases proliferating oligodendroglia (Olig2+ EdU+) and h, proliferating OPCs (Pdgfrα+ EdU+) in VTA (YFP, n = 3 mice; NpHR::YFP, n = 4 mice). i, Experimental paradigm for chronic dopaminergic neuron stimulation in VTA; 30 Hz optogenetic stimulation for 10 min a day for 7 days, followed by brain analysis 4 weeks after this paradigm. Chronic 30 Hz dopaminergic neuron stimulation does not change in j, NAc (YFP, n = 4 mice; ChR2::YFP, n = 4 mice) or k, MFB (YFP, n = 6 mice; ChR2::YFP, n = 7 mice). l, Percentage of immunogold labelled medium sized (500-1000 nm) axons in VTA (YFP, n = 5 mice; ChR2::YFP, n = 5 mice). m, electron micrographs of immunogold labelled myelinated axons, scale bar= 1 µm. Unpaired two-tailed t-test, ns (not significant) p > 0.5, *p < 0.05. Each data point represents a mouse, data shown as mean, error bars indicate SEM. a,d,f,i, Schematics created with BioRender.com. Source Data
Extended Data Fig. 3
Extended Data Fig. 3. Morphine increases oligodendrocytes in VTA.
a, Experimental paradigm, mT-mGlox/lox; Plp1-CreERT mice are administered tamoxifen 3 weeks prior to morphine CPP. Mice groups injected with saline and EdU or morphine (10 mg/kg) and EdU at 7 weeks and brains analyzed after post-test. b, Morphine conditioned mice exhibit increased locomotor sensitivity (saline, n = 6 mice; morphine, n = 5 mice). c, Morphine injected mice acquire a place preference for the morphine conditioning chamber, whereas saline mice do not show a strong preference. Graph shows the percentage of time spent in conditioning chamber, comparing pre-test and post-test (saline, n = 6 mice; morphine, n = 5 mice). d, Morphine group show increased CPP Score (post-test – pre-test preference) compared to saline controls. e, mGFP+ oligodendrocytes in VTA after morphine CPP, dotted lines focus on an oligodendrocyte interacting with the proximal section of a dopaminergic axon. e, mGFP+ oligodendrocytes in VTA. TH marks DA neurons (grey), mGFP+ oligodendrocytes (green), scale bars= 50 µm. g, morphine increases number of mGFP+ oligodendrocytes interacting with TH+ dopaminergic axons and h, area of mGFP+ oligodendrocyte processes in VTA. c, paired two-tailed t-test, d, g, h, unpaired two-tailed t-test, ns (not significant) p > 0.5, *p < 0.05, **p < 0.01. Each data point represents a mouse, data shown as mean, error bars indicate SEM. a, Schematic created with BioRender.com. Source Data
Extended Data Fig. 4
Extended Data Fig. 4. Morphine or cocaine show no effect on cortical OPC proliferation.
a, Experimental paradigm, mice groups injected with saline and EdU, or morphine (10 mg/kg, or 20 mg/kg), or cocaine (15 mg/kg) and EdU at 7 weeks and brains analyzed after post-test. b, Neither morphine nor cocaine changes OPC proliferation in premotor cortex (saline, n = 12 mice; morphine-10 mg/kg, n = 8 mice; morphine-20 mg/kg, n = 11 mice; cocaine, n = 16 mice). c, Proliferating OPCs in premotor cortex after cocaine CPP, arrowheads denote proliferating OPCs (Pdgfrα+ EdU+), Pdgfrα+ (grey), EdU+ (red). ns = not significant, p > 0.5; unpaired two-tailed t-test. Each data point represents a mouse, data shown as mean, error bars indicate SEM. a, Schematic created with BioRender.com. Source Data
Extended Data Fig. 5
Extended Data Fig. 5. Morphine shifts oligodendroglial gene expression program towards differentiation.
a, Experimental paradigm, mice groups injected with saline or morphine (10 mg/kg) at 7 weeks and after post-test, VTA tissue punches are collected and nuclei sorted, then libraries are prepared to perform snRNA-seq. b, UMAP of all cell types in VTA by snRNA-seq. snRNA-seq identifies different cellular populations in VTA, GABAergic neurons, glutamatergic neurons, dopaminergic neurons, tanycytes, endothelial cells, astrocytes, oligodendrocytes, OPCs, astrocytes and microglia. c, UMAP of oligodendroglia in VTA by snRNA-seq. snRNA-seq identifies different 19 different subpopulations oligodendroglia at various stages of maturity in VTA. d, Morphine causes shifts in oligodendroglial subpopulation clusters. For example, cluster 4 shifts towards cluster 9 with morphine exposure. e, Differentially expressed genes defines the changes between cluster 4 to cluster 9 shift. f, Morphine causes shifts in oligodendroglial transcription which is consistent with a more differentiated cell stage (TM: transmembrane; PM: plasma membrane). g, TrkB (Ntrk2 gene) is highly expressed by OPCs in the VTA and downregulated as they differentiate into oligodendrocytes. h, Bdnf is expressed by neurons including dopaminergic neurons in VTA. a, Schematic created with BioRender.com.
Extended Data Fig. 6
Extended Data Fig. 6. Morphine exerts no effect on OPC proliferation in vitro or through Oprk.
a, Proliferating OPCs (Pdgfrα+ EdU+) in vitro when exposed to control OPC media, 1 µM morphine, or 10 µM dopamine. b, Quantification of proliferating OPCs (Pdgfrα+ EdU+) after exposure to different concentrations of morphine and dopamine show similar OPC proliferation compared to OPC media control (each point indicates one technical replicate). c, Experimental paradigm, tamoxifen was administered at 4 weeks of age to conditionally knockout Oprk1 from OPCs, 3 weeks prior to start of the morphine CPP. During conditioning days mice groups injected with morphine (10 mg/kg) and EdU at 7 weeks and brains analyzed after post-test. d, Morphine increases locomotor sensitivity in both control and OprkOPC−/−. e, Both control and OprkOPC−/− mice acquire a place preference for the morphine conditioning chamber and f, Show similar CPP score. g, Proliferating OPCs in VTA after morphine CPP, arrowheads denote proliferating OPCs (Pdgfrα+ EdU+), TH marks dopaminergic neurons (green), Pdgfrα+ (grey), EdU+ (red), scale bar= 50 µm. h, Control and OprkOPC−/− mice show similar OPC proliferation in response to morphine CPP. i-j, UMAP of single nucleus sequencing (sn-Seq) in VTA. Cell cluster identity is labeled in the first panel. i, Oligodendroglial cells in the VTA do not express opioid receptors (Oprk1, Oprm1, Oprd1) and this does not change after morphine CPP. j, Oligodendroglial cells in the VTA do not express dopamine receptors (Drd1-5) and this does not change after morphine CPP. d, e, f, h, (control, n = 10 mice; OprkOPC−/−, n = 6 mice) d, paired two-tailed t-test, b, f, h, unpaired two-tailed t-test, ns (not significant) p > 0.5, *p < 0.05. Each data point represents a mouse, data shown as mean, error bars indicate SEM. c, Schematic created with BioRender.com. Source Data
Extended Data Fig. 7
Extended Data Fig. 7. Myrf loss causes reduced oligodendrogenesis but not memory impairment or anhedonia at the time points tested.
a, Experimental paradigm for determining the effects of Myrf loss on oligodendrogenesis; 15 weeks after conditional knock-out of Myrf by tamoxifen administration in MyrfOPC−/− (Myrflox/lox; Pdgfrα-CreERT) and littermate controls, EdU is added to drinking water to measure the baseline levels of oligodendrogenesis within 4 weeks. b, MyrfOPC−/− animals show reduced proliferating oligodendroglia (Pdgfrα+ Olig+) in corpus callosum white matter compared to controls (control, n = 5 mice; MyrfOPC−/−, n = 4 mice). c, Experimental paradigm for novel object recognition test; mice are introduced to two identical objects and tested 24 h after for memory by switch one of the objects with a novel object. 1 week after the end of tamoxifen administration MyrfOPC−/− (Myrflox/lox; Pdgfrα-CreERT) or TrkBOPC−/− (TrkBlox/lox; Pdgfrα-CreERT) animals and littermate controls are tested in novel object recognition test. This timeline is identical to CPP paradigms tested in Fig. 4a and g. d, Both control and MyrfOPC−/− animals spend more time with novel object compared to the familiar object (control, n = 10 mice; MyrfOPC−/−, n = 8 mice). e, Both control and TrkBOPC−/− animals spend more time with novel object compared to the familiar object (control, n = 12 mice; MyrfOPC−/−, n = 11 mice). f, Experimental paradigm for MyrfOPC−/− and littermate controls; conditional knock-out performed with tamoxifen administration at 7-weeks of age, 4-weeks before CPP. Mice groups injected with morphine (10 mg/kg) and EdU during conditioning sessions and brains analyzed after post-test. g, Both control and MyrfOPC−/− mice exhibits increased locomotor sensitivity during morphine conditioning (control, n = 11 mice; MyrfOPC−/−, n = 10 mice). h, Control mice acquire a place preference for the morphine conditioning chamber, whereas MyrfOPC−/− mice do not (control, n = 11 mice; MyrfOPC−/−, n = 10 mice). i, MyrfOPC−/− animals show decreased CPP Score (post-test – pre-test preference) compared to controls. j, Loss of Myrf decreases number of proliferating OPCs (Pdgfrα+ EdU+) in VTA after morphine CPP (control and MyrfOPC−/−, n = 10 mice). k, Experimental paradigm for MyrfOPC−/− and littermate controls; conditional knock-out performed with tamoxifen administration at 7-weeks of age, 4-weeks prior to behavioral tests. l, Both control and MyrfOPC−/− mice show strong preference for the social subject during a three-chamber social preference test and m, spent similar time investigating social subject (control, n = 16 mice; MyrfOPC−/−, n = 17 mice). n, Both control and MyrfOPC−/− mice show strong preference for sucrose over water (control, n = 8 mice; MyrfOPC−/−, n = 7 mice). b, i, j, l, m, n, unpaired two-tailed t-test, d, e, h, paired two-tailed t-test for each genotype, ns (not significant) p > 0.5, *p < 0.05, **p < 0.01, ***p < 0.001, ****p < 0.0001. Each data point represents a mouse, data shown as mean, error bars indicate SEM. a,c,f,k, Schematics created with BioRender.com. Source Data
Extended Data Fig. 8
Extended Data Fig. 8. Neither food reward nor naloxone aversion requires oligodendrogenesis.
a, Experimental paradigm for food-induced CPP; mice were conditioned with chocolate pellet (after food restriction), one control group fed ad libitum while another control group is food restricted. All animals received EdU injections during conditioning sessions for tracing proliferating cells. b, Food reward conditioned animals exhibit a strong preference to the reward-paired chamber, whereas control groups do not (ad libitum control, n = 6 mice; food restricted control, n = 10 mice; food reward, n = 10 mice). c, Food reward conditioned animals show increased CPP Score (post-test – pre-test preference) compared to the control groups. d, Food reward conditioning does not change the number of proliferating OPCs (Pdgfrα+ EdU+) in VTA. Food restricted control group shows a slight increase of proliferating OPCs compared to the food reward group due to the known effects of calorie restriction on oligodendroglia dynamics (ad libitum control, n = 6 mice; food restricted control, n = 10 mice; food reward, n = 10 mice). e, Experimental paradigm for MyrfOPC−/− (Myrlox/lox; Pdgfrα-CreERT) and littermate controls; conditional knock-out performed with tamoxifen administration at 7-weeks of age, 4-weeks before CPP. Mice groups are conditioned with chocolate pellet food reward and administered with EdU during conditioning sessions and brains analyzed immediately after post-test. f, Both control and MyrfOPC−/− mice acquire a place preference for the food reward-paired chamber (control, n = 5 mice; MyrfOPC−/−, n = 6 mice). g, MyrfOPC−/− animals similar CPP Score (post-test – pre-test preference) to controls. h, Loss of Myrf does not change the number of proliferating OPCs (Pdgfrα+ EdU+) in VTA after food reward CPP (control, n = 5 mice; MyrfOPC−/−, n = 6 mice). i, Experimental paradigm for the opioid receptor antagonist, naloxone, conditioning; mice were conditioned with naloxone (5 mg/kg) or saline and injected with EdU during conditioning sessions. j, Naloxone conditioned animals exhibit a strong avoidance to the naloxone-paired chamber, whereas saline animals do not show a preference (saline and naloxone, n = 9 mice). k, Naloxone conditioned animals show decreased CPP Score compared to the saline groups. l, Naloxone conditioned place avoidance does not change the number of proliferating OPCs (Pdgfrα+ EdU+) in VTA (saline and naloxone, n = 9 mice). m, Experimental paradigm for MyrfOPC−/− (Myrflox/lox; Pdgfrα-CreERT) and littermate controls; conditional knock-out performed with tamoxifen administration at 7-weeks of age, 4-weeks before naloxone conditioning. Mice groups are conditioned with naloxone and administered with EdU during conditioning sessions and brains analyzed after post-test. n, Both control and MyrfOPC−/− mice acquire a place avoidance for the naloxone-paired chamber (control, n = 6 mice; MyrfOPC−/−, n = 5 mice). o, MyrfOPC−/− animals similar CPA to controls. p, Loss of Myrf does not change number of proliferating OPCs (Pdgfrα+ EdU+) in VTA after naloxone CPA (control, n = 6 mice; MyrfOPC−/−, n = 7 mice). c, d, g, h, k, l, o, p, unpaired two-tailed t-test, b, f, j, n, paired two-tailed t-test, ns (not significant) p > 0.5, *p < 0.05, **p < 0.01, ***p < 0.001. Each data point represents a mouse, data shown as mean, error bars indicate SEM. a,e,i,m, Schematics created with BioRender.com. Source Data
Extended Data Fig. 9
Extended Data Fig. 9. Morphine-induced oligodendrogenesis alters dopamine dynamics in NAc.
a, Experimental paradigm to determine the effects of morphine on dopamine dynamics in MyrfOPC−/− (Myrflox/lox; Pdgfrα-CreERT) and littermate controls; conditional knock-out performed with tamoxifen administration prior to CPP. Dopamine dynamics measured with fiber photometry during pre-test and post-test as mice freely explored CPP chambers. Mice groups injected with morphine (10 mg/kg) during conditioning sessions. b, Fiber photometry cannula positioning in NAc outlined by yellow dashed lines, white dashed line marks anterior commissure (aco). GRABDA (green) expression in NAc below the cannula, scale bar= 100 µm. c, Morphine increases locomotor sensitization in both control and MyrfOPC−/− mice. d, Control mice acquire a place preference for the morphine conditioning chamber, whereas MyrfOPC−/− mice do not (control, n = 8 mice; MyrfOPC−/−, n = 10 mice). e, Control mice release more dopamine in post-test compared to MyrfOPC−/− mice (control, n = 8 mice; MyrfOPC−/−, n = 10 mice). AUC (area under the curve), d, Wilcoxon matched-pairs test, f, g, h, unpaired two-tailed t-test, ns (not significant) p > 0.5, *p < 0.05. Each data point represents a mouse, data shown as mean, error bars indicate SEM. a, Schematic created with BioRender.com. Source Data

References

    1. Saal D, Dong Y, Bonci A, Malenka RC. Drugs of abuse and stress trigger a common synaptic adaptation in dopamine neurons. Neuron. 2003;37:577–582. doi: 10.1016/S0896-6273(03)00021-7. - DOI - PubMed
    1. Nestler, E. J. & Luscher, C. The molecular basis of drug addiction: linking epigenetic to synaptic and circuit mechanisms. Neuron102, 48–50 (2019). - PMC - PubMed
    1. Gibson EM, et al. Neuronal activity promotes oligodendrogenesis and adaptive myelination in the mammalian brain. Science. 2014;344:1252304–1252304. doi: 10.1126/science.1252304. - DOI - PMC - PubMed
    1. McKenzie IA, et al. Motor skill learning requires active central myelination. Science. 2014;346:318–322. doi: 10.1126/science.1254960. - DOI - PMC - PubMed
    1. Geraghty AC, et al. Loss of adaptive myelination contributes to methotrexate chemotherapy-related cognitive impairment. Neuron. 2019;103:250–265. doi: 10.1016/j.neuron.2019.04.032. - DOI - PMC - PubMed

MeSH terms