. 2024 Jun;630(8017):686-694.
doi: 10.1038/s41586-024-07523-9. Epub 2024 Jun 5.

Descending networks transform command signals into population motor control

Affiliations

Descending networks transform command signals into population motor control

Jonas Braun et al. Nature. 2024 Jun.

Abstract

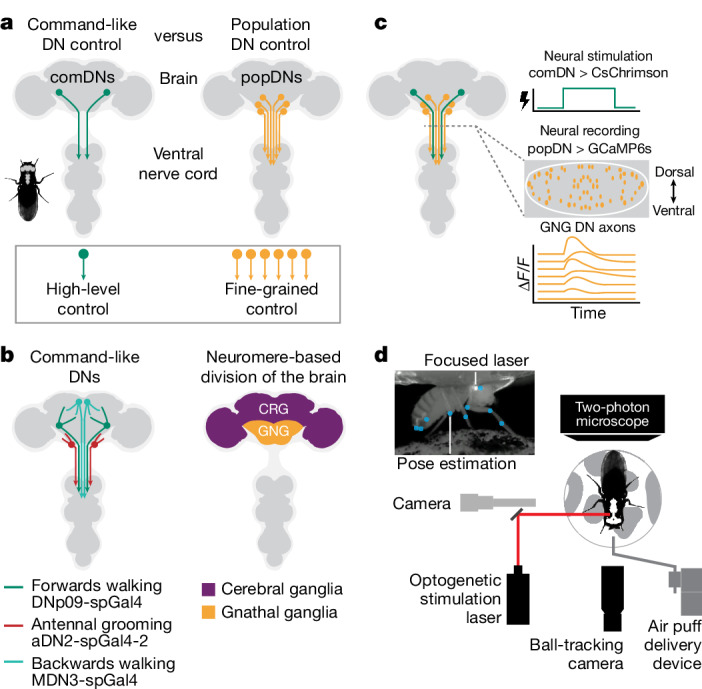
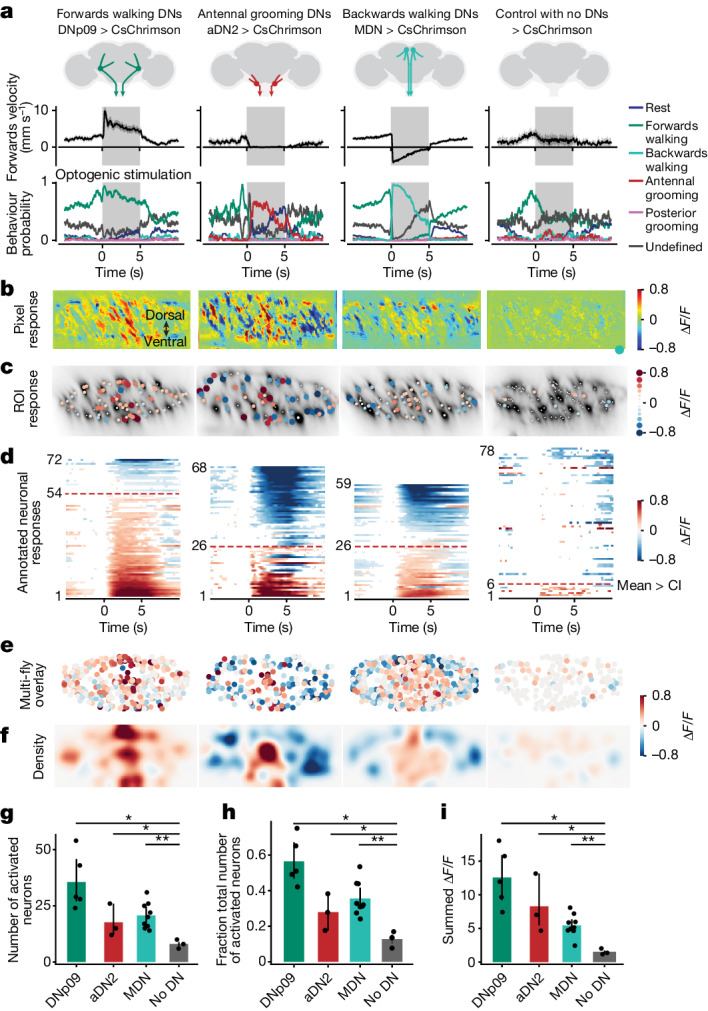
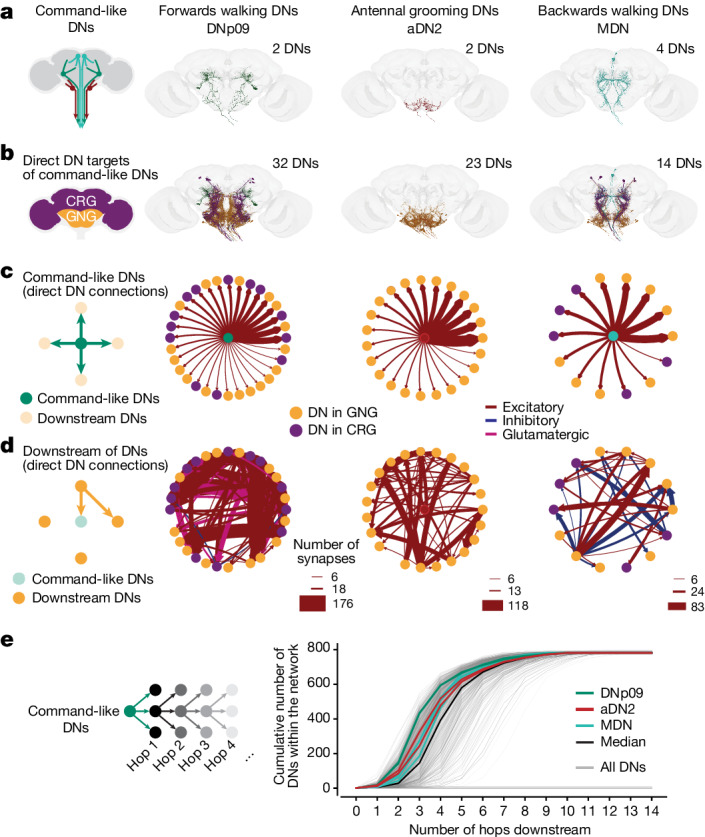
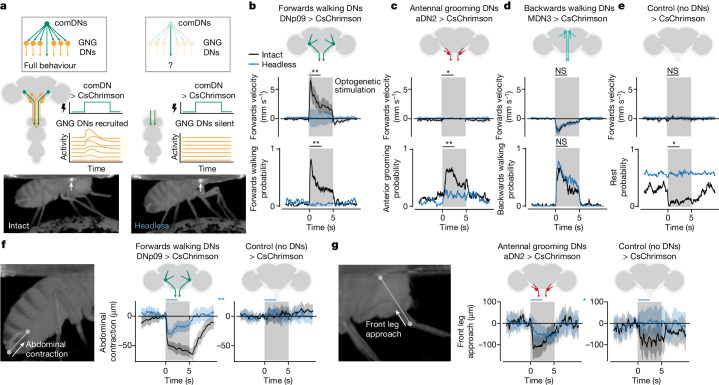
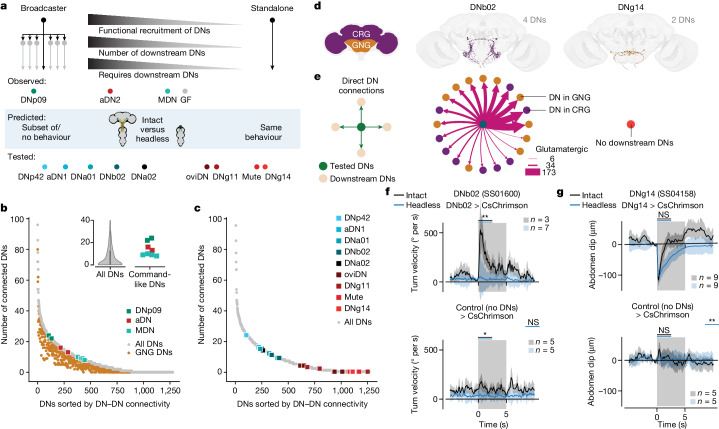
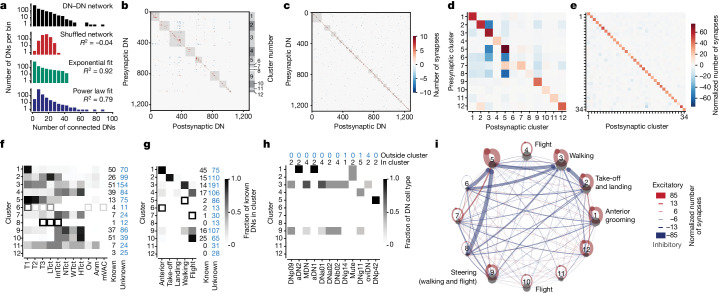
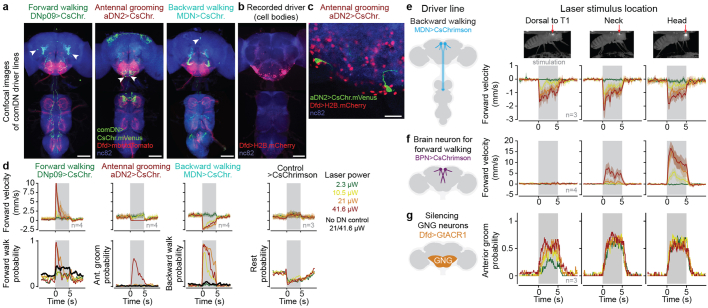
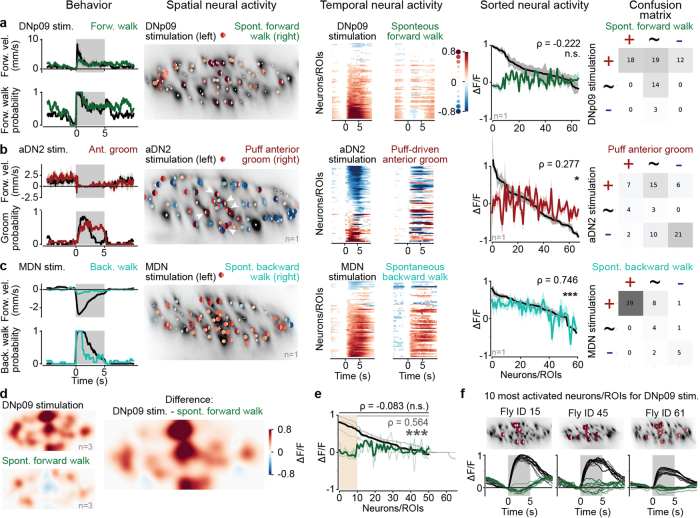
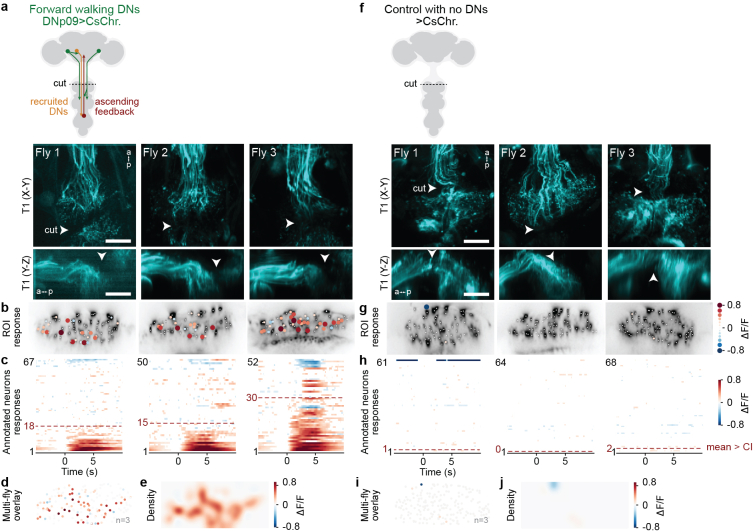
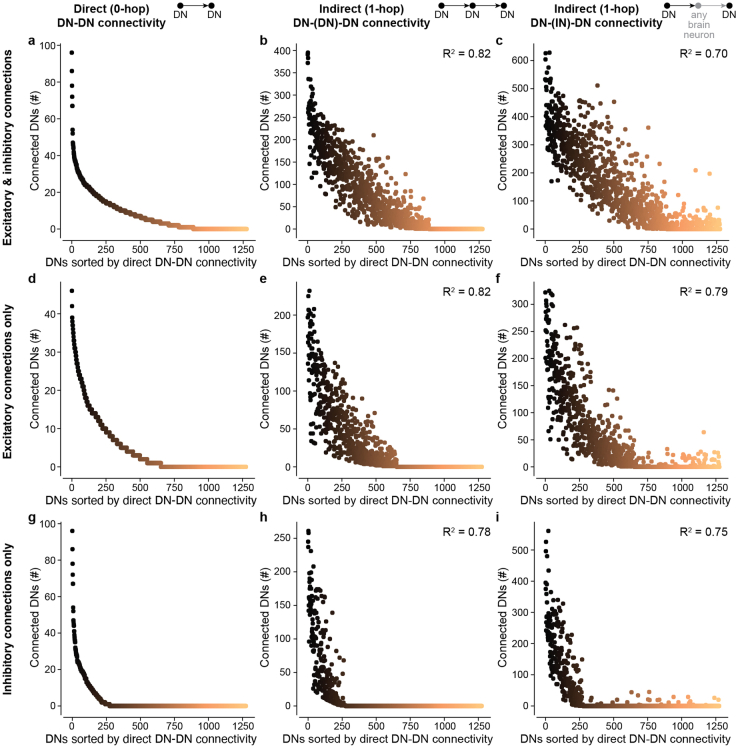
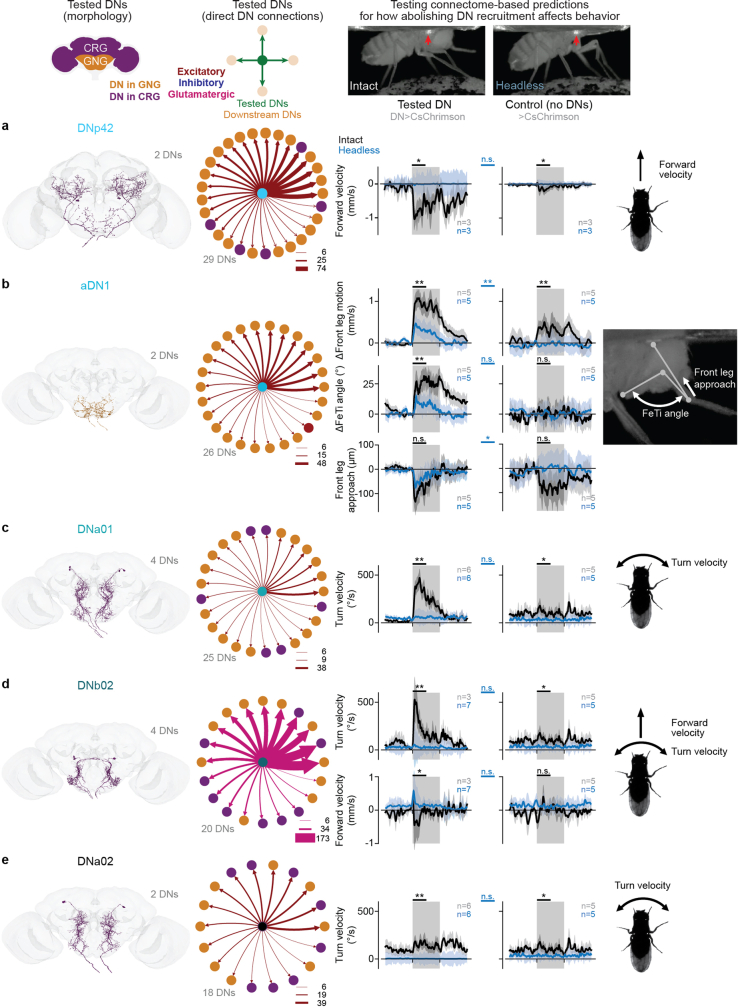
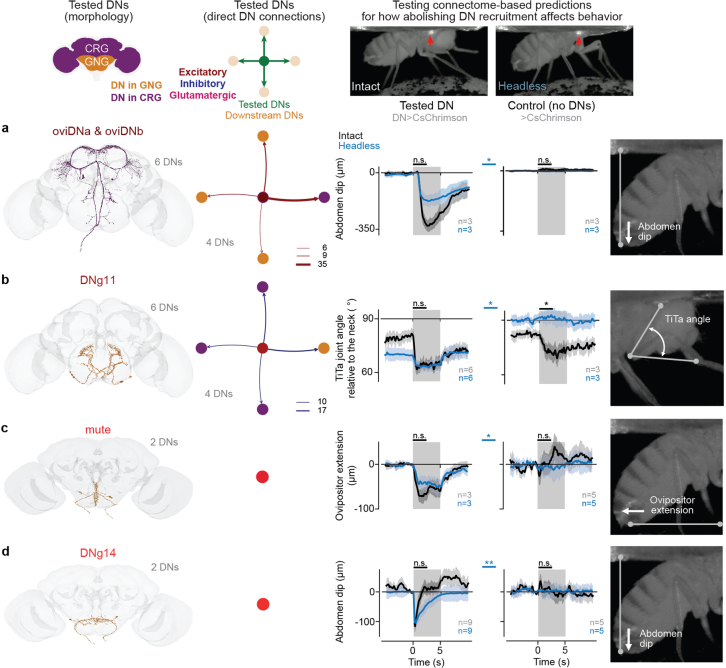
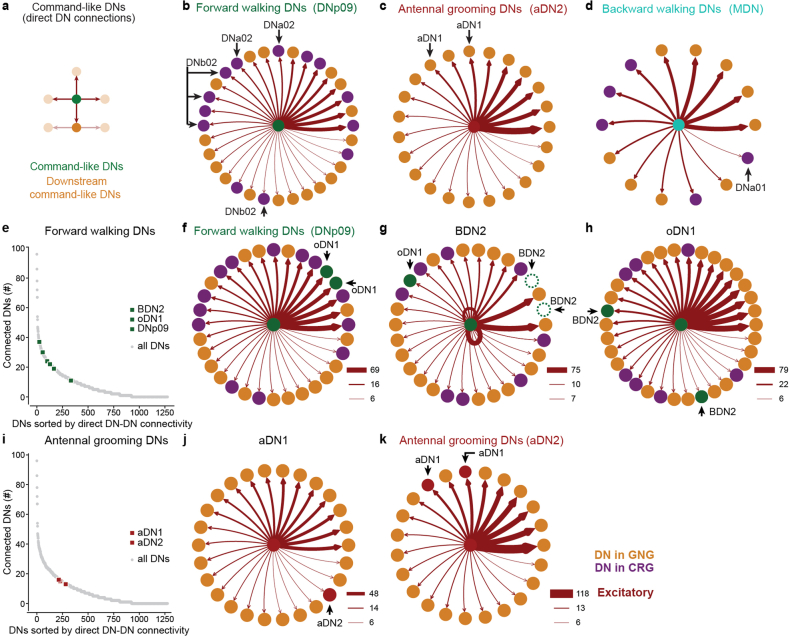
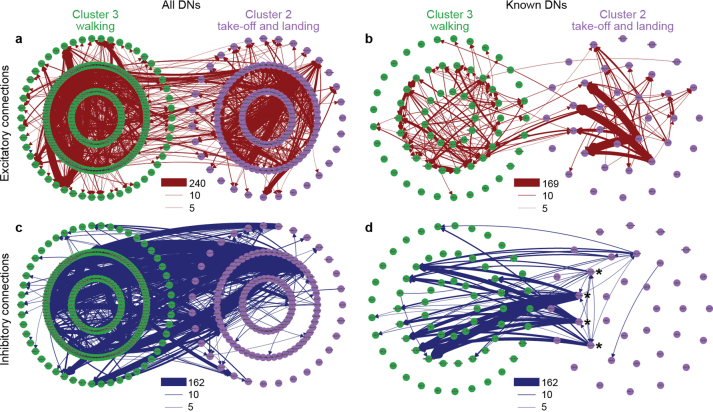
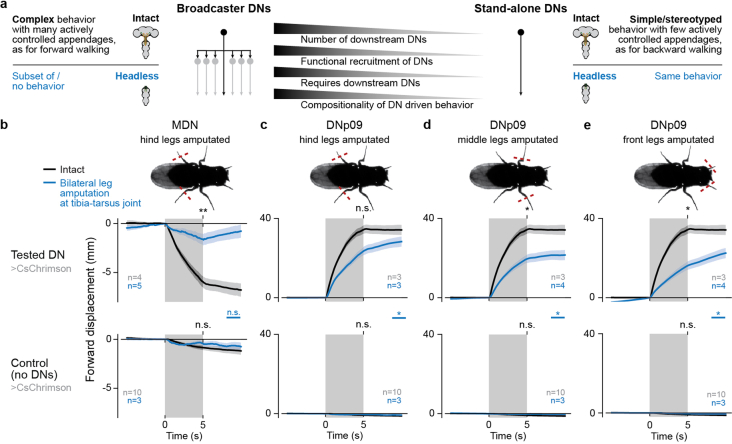
To convert intentions into actions, movement instructions must pass from the brain to downstream motor circuits through descending neurons (DNs). These include small sets of command-like neurons that are sufficient to drive behaviours1-the circuit mechanisms for which remain unclear. Here we show that command-like DNs in Drosophila directly recruit networks of additional DNs to orchestrate behaviours that require the active control of numerous body parts. Specifically, we found that command-like DNs previously thought to drive behaviours alone2-4 in fact co-activate larger populations of DNs. Connectome analyses and experimental manipulations revealed that this functional recruitment can be explained by direct excitatory connections between command-like DNs and networks of interconnected DNs in the brain. Descending population recruitment is necessary for behavioural control: DNs with many downstream descending partners require network co-activation to drive complete behaviours and drive only simple stereotyped movements in their absence. These DN networks reside within behaviour-specific clusters that inhibit one another. These results support a mechanism for command-like descending control in which behaviours are generated through the recruitment of increasingly large DN networks that compose behaviours by combining multiple motor subroutines.


Conflict of interest statement

The authors declare no competing interests.

Figures

Fig. 1
Fig. 1. Optical approach to probe the relationship between comDNs and popDNs in behaving animals.
a, Schematic of the Drosophila nervous system showing a pair of DNs that project from the brain to motor circuits in the VNC (left). Activation of small sets of comDNs (green) can drive complete behaviours. Thus, comDNs are thought to send simple, high-level control signals to the VNC, where they are transformed into complex, multi-joint movements. However, larger popDNs (orange) are also known to become active during natural behaviours (right). Therefore, in another model, individual DNs contribute to complex behaviours by sending low-level signals that control the fine-grained movements of individual or sparse sets of joints. b, We stimulated three sets of comDNs to elicit three distinct behaviours: forwards walking (DNp09, green),, antennal grooming (aDN2, red) and backwards walking (MDN, cyan) (left). DN cell body locations are schematized. Two coarse subdivisions of the adult Drosophila brain are the cerebral ganglia (CRG; previously known as the supraoesophageal ganglion) and the GNG (also known as the suboesophageal ganglion) (right). We recorded from DNs within the GNG, which houses most DNs. c, We recorded neural activity in the axons of GNG DN populations (orange) during optogenetic stimulation of different sets of comDNs (green). The grey dashed line denotes a coronal section region of interest in the thoracic cervical connective illustrating DN axon cross-sections (orange ellipses). d, A system for recording behaviour, GNG DN neural activity and optogenetically stimulating comDN axons in the neck connective (schema not to scale). The inset shows a camera image of a fly with focused laser light on its neck. Superimposed on the camera image are pose estimation key points (light blue).
Fig. 2
Fig. 2. Activation of comDNs recruits larger, distinct DN populations.
Optogenetic stimulation of comDNs: DNp09 (forwards walking, n = 5 flies, 120 stimulation trials), aDN2 (antennal grooming, n = 3 flies, 34 trials) and MDN (backwards walking, n = 9 flies, 271 trials). Control: no DN expression (n = 3 flies, 47 trials). a, Forwards walking velocities (top) and the probability of classified behaviours (bottom) during optogenetic stimulation (grey bar). b, Images illustrating GNG DN population activity upon comDN stimulation. For each, one representative animal is shown (as in Supplementary Video 1; n = 33, 10, 97 and 10 trials for DNp09, aDN2, MDN and control flies, respectively). The same flies are shown in panels c,d. c, Single-neuron responses to DN stimulation. Circles are scaled or colour coded to represent the maximum change in fluorescence (normalized ΔF/F) of one detected DN axon or region of interest (ROI). The small white dots indicate responses smaller than the 95% CI of the trial mean. d, Trial-averaged single ROI responses across time, ordered by response magnitude. Response magnitude is colour coded or white if smaller than the 95% CI. The red dashed line indicates the number of activated ROIs (that is, positive response larger than the 95% CI). e,f, A registered overlay (e) or density visualization (f) of the data from multiple flies analysed as in c. The number of flies or trials is identical to a. gi, Statistical comparison of the number of activated ROIs (that is, red dashed line in d) (g), the fraction of activated ROIs (that is, divided by the number of visible ROIs) (h) and the strength of activation (that is, the sum of the normalized ΔF/F for positively activated neurons) (i) using two-sided Mann–Whitney U-tests (n as in a; P values for each comparison to control: DNp09 = 0.018, aDN2 = 0.040 and MDN = 0.008). The shaded areas in a and the error bars in gi represent 95% CI of the mean. ***P < 0.001, *P < 0.05. Source Data
Fig. 3
Fig. 3. ComDNs connect to other DNs, forming larger DN networks.
a, The neuronal morphologies of three sets of comDNs in the female adult fly brain connectome: DNp09 (left), aDN2 (middle) and MDN (right). b, The location and morphologies of DNs directly (monosynaptically) targeted by comDNs. DNs are colour coded based on their cell body localization in the GNG (orange) or CRG (purple). Command-like neurons are colour coded as in a. c, ComDNs form monosynaptic excitatory connections to downstream DN targets. Edge weights reflect the number of synapses as shown in d, with consistent scaling across all plots. Edge colours denote whether synapses are excitatory (red), inhibitory (blue) or glutamatergic (pink), which can be excitatory or inhibitory depending on the receptor type. DNs are colour coded as in b. d, Network connectivity among downstream DNs shows strong recurrence and minimal feedback to comDNs (only in aDN2). e, The cumulative number of downstream DNs that three sets of command-like neurons—DNp09 (green lines; 2 DNs), aDN2 (red lines; 2 DNs), MDN (cyan lines; 4 DNs)—connect to across an increasing number of DN–DN synapses or ‘hops’. This is compared with the number of DNs accessible over an increasing number of hops for all DNs (grey lines) and the median of all DNs (black line). Many DNs do not connect to any other DN, and 455 DNs only receive inputs from maximally one other DN, limiting the maximum number of recruited DNs to approximately 800.
Fig. 4
Fig. 4. Recruited DN networks are required for forwards walking and grooming, but not for backwards walking.
a, In intact animals (left), activation of a comDN (green) recruits other DNs (orange) and leads to the execution of a complete behaviour. In headless animals (right), the axons of comDNs (green) can still be activated in the VNC. However, other DN axons (orange) cannot be recruited in the brain and remain silent. This comparison between intact and headless animals allows one to isolate the necessity of downstream DN networks to generate complete behaviours. be, Forwards walking velocities and behaviour probabilities for DNp09 (b), aDN2 (c), MDN (d) or control (e) flies. Mann–Whitney U-tests compare the difference between the means of the first 2.5 s of optogenetic stimulation across intact (black traces) versus headless (blue traces) animals. f, DNp09 stimulation in both intact and headless animals leads to abdominal contraction (change in Euclidian distance between the anal plate and the ventral side of the most posterior stripe). Mann–Whitney U-test compares the mean of the first 2.5 s of stimulation (blue bars) for headless DNp09 versus headless control animals (blue traces). g, aDN2 stimulation in both intact and headless animals leads to front leg approach (change in Euclidian distance between the front leg tibia–tarsus joint and the neck). Mann–Whitney U-test compares the first 2.5 s of stimulation (blue bars) between headless aDN2 and headless control animals (blue traces). All plots in bg show data from n = 5 flies with 10 trials each (trial mean and 95% CI (shaded area)). Two-sided Mann–Whitney U-tests compare the trial mean across different flies. ***P < 0.001, **P < 0.01, *P < 0.05 and not significant (NS) P > 0.05. For exact P values, see Supplementary Table 5. Source Data
Fig. 5
Fig. 5. Network connectivity accurately predicts the necessity for downstream DNs to drive behaviour.
a, For the comDNs investigated, three important properties covary in a continuum that spans from broadcaster DNs to standalone DNs. Schematized along this continuum are our three comDNs, giant fibre (GF) neurons and nine additional tested neurons: DNp42, aDN1, DNa01, DNb02, DNa02, oviDN, DNg11, Mute and DNg14. b, For each Drosophila DN, the total (grey) or GNG-based (orange) number of monosynaptically downstream DNs. ComDNs are colour coded. The inset shows median and 25% and 75% quantiles (left violin plot, n = 1,303) comparing all DNs to DNp09, aDN2 and MDN. c, The number of DNs directly downstream of nine additional sets of DNs (colour-coded circles as in a) for which connectome-based experimental predictions are made. All DNs (grey) shown are as in b. d, The morphology of two sets of DNs (DNb02 and DNg14) in the female adult fly brain connectome. e, Monosynaptic connectivity for two tested DNs (DNb02 and DNg14). Edge weights denote the number of glutamatergic synapses (pink). f, Absolute, undirected turn velocity for DNb02 (top) and control (bottom) animals upon laser stimulation. g, Abdomen dipping for DNg14 (top) and control (bottom) animals upon laser stimulation (change in anal plate vertical position). In f,g, data are shown for intact (black traces) and headless (blue traces) animals. The number of animals is indicated for each condition. Each fly was optogenetically stimulated ten times. Traces show the average and 95% CI across n × 10 trials. Two-sided Mann–Whitney U-tests comparing the trial mean of intact and headless animals (black bars) or comparing headless experimental with headless control flies (blue bars, between top and bottom plots). **P < 0.01, *P < 0.05 and NS P > 0.05. For exact P values, see Supplementary Table 5. Source Data
Fig. 6
Fig. 6. Networks of DNs for similar behaviours excite one another and inhibit those for other behaviours.
a, The connectivity distribution of the DN–DN network (black), the same data after shuffling individual connections (red), the best exponential fit (green) or the best power law fit (blue). b, DN–DN connectivity clusters (grey squares) indicating excitatory (red) and inhibitory (blue) connectivity between presynaptic DNs (rows) and postsynaptic DNs (columns). The numbers on the right side indicate cluster numbers in d,fi. c, As in b, but for a network with shuffled DN–DN connectivity. d, The number of synapses (excitatory minus inhibitory) between any two clusters normalized by the number of DNs in the postsynaptic cluster. e, As in d, but for the shuffled network in c. f, Fraction of known DNs within each cluster projecting to different VNC neuropil regions. Anm, abdominal neuromere; HTct, haltere tectulum; IntTct, intermediate tectulum; LTct, lower tectulum; mVAC, medial ventral association centre; NTct, neck tectulum; Ov, ovoid; T1–T3, leg neuropils; WTct, wing tectulum. Data are from ref. . g, Fraction of known DNs within each cluster associated with distinct behaviours. Data are taken from the literature (Supplementary Table 8). Open squares indicate clusters containing fewer than five known DNs (f,g). h, The distribution of experimentally investigated DNs across DN clusters. i, A network visualization of clusters in d with associated behaviours from g. There are predominantly excitatory (red) connections within each DN cluster and inhibitory (blue) connections between clusters.
Extended Data Fig. 1
Extended Data Fig. 1. DN driver lines and optogenetic stimulation strategy.
(a) Z-projected confocal images of the brain (top) and VNC (bottom) show the expression of UAS-CsChrimson.mVenus (green) in command-like DNs, membrane-bound tdTomato in the Dfd driver line (red), and neuropil (‘nc82’, blue). The location of command-like DN cell bodies is indicated (white arrowheads). Scalebars are 100 μm. (b) Z-projected confocal image of Dfd driver line expression of soma-targeted mCherry. Only brain neurons in the GNG are labeled. Scalebar is 100 μm. (c) Confocal image of the posterior GNG with Dfd driver line expression of soma-targeted mCherry and aDN2 expression of UAS-CsChrimson.mVenus (green). The two GNG-DNs in the aDN2 driver line are not targeted by the Dfd driver line. Scalebar is 20 μm. Immunohistochemistry and confocal imaging experiments in (a-c) were performed once due to the reliability of these methods. (d) Behavioral responses to optogenetic stimulation of the neck connective at different laser intensities for DNp09 (left; 4 flies, total 49 trials per condition), aDN2 (left-middle; 4 flies, total 60 trials per condition), MDN (right-middle; 4 flies, total 50 trials per condition), and no DN control (right; 3 flies, total 60 trials per condition) animals. Flies reliably (i) walk forward upon DNp09 stimulation for stimuli ≥ 21 μW, (ii) groom upon aDN2 stimulation only for the highest stimulation power (41.6 μW) but rest at 21 μW, and (iii) walk backward upon MDN stimulation for stimuli ≥ 10.5 μW. For all stimulation intensities, control flies walk more and rest less. Thus, we selected 21 μW as our default laser stimulation power and 41.6 μW for aDN2 stimulation specifically. (e) MDN stimulation with focused laser light elicits backward walking when illuminating the anterior dorsal thorax (left, as in Figs. 4 and 5), the neck (middle, as in Fig. 2) or the head (right). 3 flies, total 30 stimulation trials per condition. (f) Stimulation of a brain-specific neuron (‘Bolt protocerebral neurons’ or BPN) known to drive forward walking with focused laser light elicits forward walking when illuminating the head (right), but not the thorax (left). Laser light focused on the neck (middle) can only elicit weak forward walking at 41.6 μW. 4 flies, total 40 stimulation trials per condition. (g) Silencing GNG neurons (Dfd-LexA > LexAop-GtACR1) with focused 561 nm laser light elicits anterior grooming when illuminating the head (right), neck (middle), or thorax (left). 3 flies, total of 30 stimulation trials per condition. All velocity traces in (d,e,f) show mean ± 95% confidence interval of the mean across stimulation trials.
Extended Data Fig. 2
Extended Data Fig. 2. Comparison of GNG-DN population neural activity during optogenetic stimulation versus corresponding natural behaviors.
(a-c) For (a) DNp09 and forward walking, (b) aDN2 and anterior grooming, or (c) MDN and backward walking: (left) behavioral responses to optogenetic stimulation of command-like DNs (black) versus natural occurrences of the behavior in question (color); (middle left) single neuron/ROI responses (analyzed as in Fig. 2c). Here the left half-circle reflects the response to optogenetic activation and the right half-circle the activity during natural behavior; (middle) single neuron average responses as in Fig. 2d; (middle right) Comparing the activity of individual neurons between optogenetic stimulation (black) and natural behavior (color). Neurons/ROIs are sorted by the magnitude of their responses to optogenetic activation. Shaded areas indicate 95% confidence interval of the mean across trials. Pearson correlation between optogenetic and spontaneous response and significance of test against null-hypothesis (the two variables are uncorrelated, see Methods) are shown; (right) Confusion matrix comparing the number of active neurons/ROIs that were more active (+), similar (~), or less active (−) upon optogenetic stimulation versus during natural behavior. (a) DNp09: for one fly n=23 optogenetic stimulation trials (not forward walking before stimulus) and 28 instances of spontaneous forward walking in which the fly was not walking forward for at least 1 s and then walking forward for at least 1 s (correlation: ρ = − 0.022, p = 0.356, N = 66 neurons, two-sided test, see Methods). (b) aDN2: for one fly, n = 20 optogenetic stimulation trials (pre-stimulus behavior not restricted) and 16 instances of anterior grooming elicited by a 5 s humidified air puff (correlation: ρ = 0.277, p = 0.022, N = 68 neurons, two-sided test, see Methods). Indicated are central neurons/ROIs with strong activation during aDN2 stimulation of the neck cervical connective as in Fig. 2f. (c) MDN: for one fly, n = 80 optogenetic stimulation trials (pre-stimulus behavior not restricted) and 21 instances of spontaneous backward walking on a cylindrical treadmill in which the fly was not walking backward for 1 s and then walked backward for at least 1 s (correlation: ρ = 0.746, p < 0.001, N = 60 neurons, two-sided test, see Methods). (d) Density visualisation (as in Fig. 2f) of neural responses to DNp09 stimulation and spontaneous forward walking across three animals. The difference in responses is primarily localized to the medial but not lateral regions of the connective. To maximize comparability, only trials where the fly was not walking forward before stimulus onset were selected. (e) Same plot as in a, middle right but for three animals with DNp09 stimulation and forward walking. Indicated are the correlation values when including (ρ = − 0.083, p = 0.564, n = 172 neurons across three flies, two-sided test, see Methods) or excluding (ρ = 0.564, p < 0.001, n = 142 neurons across three flies, two-sided test, see Methods) the ten neurons most activated by optogenetic stimulation (orange region). (f) The locations of ten neurons indicated in e within the connective of three flies (top) and their single neuron responses to optogenetic stimulation (bottom, black traces) or during natural backward walking (bottom, green traces).
Extended Data Fig. 3
Extended Data Fig. 3. GNG-DNs are recruited by command-like DNs despite resection of ascending axons from the VNC.
Experimental data (three flies each) showing anatomy and functional responses of GNG-DNs upon optogenetic stimulation of (a-e) DNp09 > CsChrimson or (f-j) control flies. (a,f) Horizontal (top) and side (bottom) projections of the cervical connective and VNC for three flies after resecting the VNC T1 neuropil. Arrowheads indicate the locations of cuts. Scale bars are 50 μm. (b,g) Single neuron/region-of-interest (ROI) response magnitude during laser light illumination. Each circle is scaled and color-coded to represent the maximum change in fluorescence (normalized ΔF/F) of one detected DN axon/ROI relative to the level of activity 1 s prior to illumination. Small white dots are shown if the response magnitude is smaller than the 95% confidence interval of the mean across trials. The background image is a standard-deviation projection across time of raw fluorescence microscopy data. (c,h) Trial-averaged single neuron/ROI responses across time, aligned to illumination onset and ordered by response magnitude. Data are color-coded according to the magnitude of activity, or white if the response is smaller than the 95% confidence interval of the mean. Indicated are the number of neurons/ROIs with a positive response magnitude larger than the 95% confidence interval of the mean across trials (horizontal red line). (d,i) A registered overlay of the data from all three flies shown in panel b,g. (e,j) A density visualization of the data from all three flies shown in panel b,g.
Extended Data Fig. 4
Extended Data Fig. 4. DN-DN connectivity statistics when also including interneurons in the underlying connectome network.
(a) The number of DNs monosynaptically (directly) downstream of every DN, taking into account both excitatory and inhibitory synapses. Data are identical to those in figure 5. (b) The number of DNs disynaptically downstream of each DN, allowing for at most one additional intervening DN. Sorting of the x axis identical to panel (a). Correlation coefficient compares the distributions of panels (a) and (b). (c) The number of DNs disynaptically downstream of each DN, allowing for at most one additional intervening interneuron of any type. Sorting of the x axis identical to panel (a). Correlation coefficient compares the distributions of panels (a) and (c). (d-f) Identical to panels (a-c) but restricted only to excitatory connections between individual neurons. Sorting of the x axis identical in panels (d-f). (g-i) Identical to panels (a-c) but restricted only to inhibitory connections between individual neurons. Sorting of the x axis identical in panels (g-i).
Extended Data Fig. 5
Extended Data Fig. 5. Testing the connectome-based prediction for broadcaster DNs that behaviors depend strongly on downstream DNs.
(a-e)(first column) The morphology of tested DNs in the adult female brain connectome. DNs are color-coded based on their somata localization within the cerebral ganglia (purple) or gnathal ganglia (orange). The number of DNs is indicated. (second column) A network schematic of direct connections from tested to downstream DNs. Edge widths reflect the number of synapses and is consistent across plots. Edge colors denote excitatory (red), inhibitory (blue), or glutamatergic (pink) which can be excitatory or inhibitory depending on receptor type. (third column) Quantitative analyses of optogenetically-driven behaviors and movements in intact (black traces) and headless animals (blue traces). The number of flies for each condition are indicated. Each fly is optogenetically stimulated ten times. Thus, the average and 95% confidence interval of the mean for a total of n*10 trials is shown. (fourth column) Identical behavioral analysis for control flies without DN opsin expression. Note that controls for different parameters include the same five animals. Two-sided Mann-Whitney U tests comparing the trial mean of intact and headless animals (black bars, above each plot) and comparing headless experimental with headless control flies (blue, in between experimental and control plots) are shown (*** means p < 0.001, ** means p < 0.01, * means p < 0.05, n.s. means p≥0.05; for exact p-values see Supplementary Table 5). (fifth column) An illustration of the behavioral parameter(s) being quantified. (a) DNp42 has monosyaptic connections to 29 other DNs and triggers backing up in intact animals. This behavior is not observed in headless flies, as quantified by fictive forward walking velocity. (b) aDN1 has monosynaptic connections to 26 other DNs and triggers grooming in intact animals. By contrast, headless animals produce mostly uncoordinated front leg movements. These occur more slowly at a lower frequency (top) with a smaller change in femur-tibia angle (middle). The ‘front leg approach’ to the head—the change in Euclidean distance between the neck and tibia-tarsus joint relative to 1 s before stimulus onset—is similar between intact and headless animals (bottom). (c) DNa01 has monosynaptic connections to 25 other DNs and triggers in place turning. This is quantified as an increase in turn velocity. This behavior is lost in headless animals. (d) DNb02 has monosynaptic connections to 20 other DNs and weakly triggers turning. This is quantified as an increase in turning velocity (top), a phenotype that is lost in headless animals. Instead, a flexion of the front legs can be observed in headless animals. This is quantified as a short spike in forward velocity (bottom). These data partially overlap with those in Fig. 5d–g. (e) DNa02 has monosynaptic connections to 18 other DNs and weakly triggers turning. This is quantified as an increase in turning velocity. This behavior is lost in headless animals.
Extended Data Fig. 6
Extended Data Fig. 6. Testing the connectome-based prediction for stand-alone DNs that behaviors depend weakly on downstream DNs.
(a-d)(first column) The morphology of tested DNs in the adult female brain connectome. DNs are color-coded based on their somata localization within the cerebral ganglia (purple) or gnathal ganglia (orange). The number of DNs is indicated. (second column) A network schematic of direct connections from tested to downstream DNs. Edge widths reflect the number of synapses and is consistent across plots. Edge colors denote excitatory (red), inhibitory (blue), or glutamatergic (pink) which can be excitatory or inhibitory depending on receptor type. (third column) Quantitative analyses of optogenetically-driven behaviors and movements in intact (black traces) and headless animals (blue traces). The number of flies for each condition are indicated. Each fly is optogenetically stimulated ten times. Thus, the average and 95% confidence interval of the mean for a total of n*10 trials is shown. (fourth column) Identical behavioral analysis for control flies without DN opsin expression. Note that controls for different parameters include the same five animals. Two-sided Mann-Whitney U tests comparing the trial mean of intact and headless animals (black bars, above each plot) and comparing headless experimental with headless control flies (blue, in between experimental and control plots) are shown (*** means p < 0.001, ** means p < 0.01, * means p < 0.05, n.s. means p≥0.05; for exact p-values see Supplementary Table 5). (fifth column) An illustration of the behavioral parameter(s) being quantified. (a) oviDNs have four direct downstream partners and trigger curling of the abdomen in both intact and headless animals. This movement is quantified as a change in the vertical positioning of the ovum during optogenetic stimulation. (b) All together, six DNg11 neurons have four downstream partners and trigger foreleg rubbing. This movement is quantified by the angle drawn by the axis between the coxa and front legs’ tibia-tarsus joint, and the coxa-neck axis. This metric allows to compare positions across flies. (c) The DN ‘Mute’ has no monosynaptic connections to other DNs and triggers ovipositor extension in both intact and headless animals. This movement is quantified as a change in the horizontal position of the ovipositor relative to the 1 s prior to stimulus onset. (d) DNg14 has no monosynaptic connections to other DNs and triggers abdominal dipping and vibration in both intact and headless animals. This movement is quantified as a change in the vertical position of the anal plate relative to 1 s before stimulus onset. These are the same data as in Fig. 5d–f).
Extended Data Fig. 7
Extended Data Fig. 7. Inputs to clusters by brain region.
Fraction of DN input synapses from different brain neuropils within each cluster. Although there is largely no clear link between the source of DN inputs in the brain and DN clusters, there is one exception: Among ‘walking’ or ‘steering’ clusters 3 & 9 we find a bias with neurons in the right hemisphere being assigned mainly to cluster 3 and those in the left hemisphere being assigned to cluster 9. This was due to differences in connectivity between the two brain hemispheres, both in terms of bilateral symmetry in the brain as well as a left-right imbalance of inputs from the inferior posterior slope (IPS), superior posterior slope (SPS) and the lateral accessory lobe (LAL) (white asterisks). Neuropil names are listed in Supplementary Table 7.
Extended Data Fig. 8
Extended Data Fig. 8. DN-DN connectivity for multiple DNs driving similar behaviors.
(a-d) DNs used to test predictions and that are directly downstream of our studied command-like DNs (DNp09, aDN2 and MDN). (a) Schematic illustrating that command-like DNs can recruit other command-like DNs involved in related behaviors. (b) Downstream partners of DNp09 include DNa02 and DNb02 neurons. (c) Downstream partners of aDN2 include aDN1 neurons. (d) Downstream of MDN is one DNa01 neuron. (e,i) Command-like DNs whose artificial stimulation are known to evoke (e) forward walking (DNp09, BDN2, and oDN1), or (i) antennal grooming (aDN1 and aDN2) are all well-connected to other DNs. (f-h, j,k) Direct connectivity diagrams showing downstream partners of (f) DNp09, (g) BDN2, (h) oDN1, (j) aDN1, and (k) aDN2. Command-like DNs are shown at the center of each plot. Edge widths indicate the strength of the synaptic connections. Peripheral neurons highlighted in (f-h) green or (j-k) red are the interconnected DNs evoking forward locomotion or antennal grooming, respectively. Dashed circles in (g) represent internal connections among BDN2 neurons, grouped in the center through self loops.
Extended Data Fig. 9
Extended Data Fig. 9. Node-wise connectivity between two clusters controlling walking versus take-off and landing.
(a-b) Excitatory connections between (a) all or only (b) experimentally studied (prior to) nodes from cluster 2 implicated in take-off and landing (purple) or cluster 3 implicated in walking (green). Synapse counts are indicated by edge weights. Each cluster is organized such that DNs with outputs only within the cluster are on the inner ring, DNs with both inputs and outputs to the same cluster are on the middle ring, and remaining cluster DNs are on the outer ring. Most excitatory connections are within a given cluster. (c-d) As in panels a-d but including only inhibitory connections. Most connections project across clusters 2 and 3. In panel d, four Web DNs are indicated (black asterisks). These neurons receive strong excitatory input from within their cluster 2 (panel b) and inhibit many DNs in cluster 3.
Extended Data Fig. 10
Extended Data Fig. 10. Backward locomotion depends on the active actuation of fewer appendages than forward locomotion.
(a) Illustration of the hypothesis that behavioral complexity/compositionality correlates with underlying DN network size. (b-e, top row) Cartoon schema illustrating legs that were bilaterally amputated at the level of the tibia-tarsus joint. Indicated are optogenetically activated DNs. Shown below is the cumulative fictive forward displacement for tethered flies before, after, and during optogenetic stimulation (gray region) for either optogenetic stimulation of (b-e, middle row) the DN in question, or (b-e, bottom row) a control animal with no GAL4 driver. Data are shown for traces for both amputated (blue) and intact control (black traces) flies. Flies were optogenetically stimulated 10 times. Shaded areas represent the 95% confidence interval of the mean. Shown are two-sided Mann-Whitney U tests comparing the trial-wise mean of intact versus leg amputated animals (black asterisks and ‘n.s.’) as well as the leg amputated DN > GAL4 versus leg amputated control flies (blue asterisks and ‘n.s.’). *** Indicates p < 0.001, ** indicates p < 0.01, * indicates p < 0.05, n.s. indicates p ≥ 0.05; for exact p-values see Supplementary Table 6. (b) Amputation of the hind legs is sufficient to prevent flies from walking backward upon MDN optogenetic stimulation. Residual backward displacement results from struggle-associated noise and is not statistically distinguishable from control animal backward displacement. (c-e) Amputation of either the hind-, mid- or forelegs does not prevent forward walking but only reduces forward walking velocity.

Similar articles

  • Distributed control of motor circuits for backward walking in Drosophila.
    Feng K, Sen R, Minegishi R, Dübbert M, Bockemühl T, Büschges A, Dickson BJ. Feng K, et al. Nat Commun. 2020 Dec 2;11(1):6166. doi: 10.1038/s41467-020-19936-x. Nat Commun. 2020. PMID: 33268800 Free PMC article.
  • Descending neuron population dynamics during odor-evoked and spontaneous limb-dependent behaviors.
    Aymanns F, Chen CL, Ramdya P. Aymanns F, et al. Elife. 2022 Oct 26;11:e81527. doi: 10.7554/eLife.81527. Elife. 2022. PMID: 36286408 Free PMC article.
  • MDN brain descending neurons coordinately activate backward and inhibit forward locomotion.
    Carreira-Rosario A, Zarin AA, Clark MQ, Manning L, Fetter RD, Cardona A, Doe CQ. Carreira-Rosario A, et al. Elife. 2018 Aug 2;7:e38554. doi: 10.7554/eLife.38554. Elife. 2018. PMID: 30070205 Free PMC article.
  • A connectome and analysis of the adult Drosophila central brain.
    Scheffer LK, Xu CS, Januszewski M, Lu Z, Takemura SY, Hayworth KJ, Huang GB, Shinomiya K, Maitlin-Shepard J, Berg S, Clements J, Hubbard PM, Katz WT, Umayam L, Zhao T, Ackerman D, Blakely T, Bogovic J, Dolafi T, Kainmueller D, Kawase T, Khairy KA, Leavitt L, Li PH, Lindsey L, Neubarth N, Olbris DJ, Otsuna H, Trautman ET, Ito M, Bates AS, Goldammer J, Wolff T, Svirskas R, Schlegel P, Neace E, Knecht CJ, Alvarado CX, Bailey DA, Ballinger S, Borycz JA, Canino BS, Cheatham N, Cook M, Dreher M, Duclos O, Eubanks B, Fairbanks K, Finley S, Forknall N, Francis A, Hopkins GP, Joyce EM, Kim S, Kirk NA, Kovalyak J, Lauchie SA, Lohff A, Maldonado C, Manley EA, McLin S, Mooney C, Ndama M, Ogundeyi O, Okeoma N, Ordish C, Padilla N, Patrick CM, Paterson T, Phillips EE, Phillips EM, Rampally N, Ribeiro C, Robertson MK, Rymer JT, Ryan SM, Sammons M, Scott AK, Scott AL, Shinomiya A, Smith C, Smith K, Smith NL, Sobeski MA, Suleiman A, Swift J, Takemura S, Talebi I, Tarnogorska D, Tenshaw E, Tokhi T, Walsh JJ, Yang T, Horne JA, Li F, Parekh R, Rivlin PK, Jayaraman V, Costa M, Jefferis GS, Ito K, Saalfeld S, George R, Meinertzhagen IA, Rubin GM, Hess HF, Jain V, Plaza SM. Scheffer LK, et al. Elife. 2020 Sep 7;9:e57443. doi: 10.7554/eLife.57443. Elife. 2020. PMID: 32880371 Free PMC article.
  • Of what use is connectomics? A personal perspective on the Drosophila connectome.
    Meinertzhagen IA. Meinertzhagen IA. J Exp Biol. 2018 May 20;221(Pt 10):jeb164954. doi: 10.1242/jeb.164954. J Exp Biol. 2018. PMID: 29784759 Review.

Cited by

  • Comparative connectomics of the descending and ascending neurons of the Drosophila nervous system: stereotypy and sexual dimorphism.
    Stürner T, Brooks P, Capdevila LS, Morris BJ, Javier A, Fang S, Gkantia M, Cachero S, Beckett IR, Champion AS, Moitra I, Richards A, Klemm F, Kugel L, Namiki S, Cheong HSJ, Kovalyak J, Tenshaw E, Parekh R, Schlegel P, Phelps JS, Mark B, Dorkenwald S, Bates AS, Matsliah A, Yu SC, McKellar CE, Sterling A, Seung S, Murthy M, Tuthill J, Lee WA, Card GM, Costa M, Jefferis GSXE, Eichler K. Stürner T, et al. bioRxiv [Preprint]. 2024 Jun 28:2024.06.04.596633. doi: 10.1101/2024.06.04.596633. bioRxiv. 2024. PMID: 38895426 Free PMC article. Preprint.
  • Biomaterials for neuroengineering: applications and challenges.
    Wu H, Feng E, Yin H, Zhang Y, Chen G, Zhu B, Yue X, Zhang H, Liu Q, Xiong L. Wu H, et al. Regen Biomater. 2025 Feb 21;12:rbae137. doi: 10.1093/rb/rbae137. eCollection 2025. Regen Biomater. 2025. PMID: 40007617 Free PMC article. Review.
  • Comparative connectomics of Drosophila descending and ascending neurons.
    Stürner T, Brooks P, Serratosa Capdevila L, Morris BJ, Javier A, Fang S, Gkantia M, Cachero S, Beckett IR, Marin EC, Schlegel P, Champion AS, Moitra I, Richards A, Klemm F, Kugel L, Namiki S, Cheong HSJ, Kovalyak J, Tenshaw E, Parekh R, Phelps JS, Mark B, Dorkenwald S, Bates AS, Matsliah A, Yu SC, McKellar CE, Sterling A, Seung HS, Murthy M, Tuthill JC, Lee WA, Card GM, Costa M, Jefferis GSXE, Eichler K. Stürner T, et al. Nature. 2025 Jul;643(8070):158-172. doi: 10.1038/s41586-025-08925-z. Epub 2025 Apr 30. Nature. 2025. PMID: 40307549 Free PMC article.
  • Connectomic analysis of taste circuits in Drosophila.
    Walker SR, Peña-Garcia M, Devineni AV. Walker SR, et al. Sci Rep. 2025 Feb 12;15(1):5278. doi: 10.1038/s41598-025-89088-9. Sci Rep. 2025. PMID: 39939650 Free PMC article.
  • Inhibitory circuit motifs in Drosophila larvae generate motor program diversity and variability.
    Francis J, Gibeily CR, Smith WV, Petropoulos IS, Anderson M, Heitler WJ, Prinz AA, Pulver SR. Francis J, et al. PLoS Biol. 2025 Apr 21;23(4):e3003094. doi: 10.1371/journal.pbio.3003094. eCollection 2025 Apr. PLoS Biol. 2025. PMID: 40258087 Free PMC article.

References

    1. Simpson J. Descending control of motor sequences in Drosophila. Curr. Opin. Neurobiol. 2024;84:102822. doi: 10.1016/j.conb.2023.102822. - DOI - PMC - PubMed
    1. Bidaye SS, Machacek C, Wu Y, Dickson BJ. Neuronal control of Drosophila walking direction. Science. 2014;344:97–101. doi: 10.1126/science.1249964. - DOI - PubMed
    1. Bidaye SS, et al. Two brain pathways initiate distinct forward walking programs in Drosophila. Neuron. 2020;108:469–485. doi: 10.1016/j.neuron.2020.07.032. - DOI - PMC - PubMed
    1. Hampel S, Franconville R, Simpson JH, Seeds AM. A neural command circuit for grooming movement control. eLife. 2015;4:e08758. doi: 10.7554/eLife.08758. - DOI - PMC - PubMed
    1. Lassek AM, Rasmussen GL. A comparative fiber and numerical analysis of the pyramidal tract. J. Comp. Neurol. 1940;72:417–428. doi: 10.1002/cne.900720209. - DOI

LinkOut - more resources