. 2024 Jun;630(8016):447-456.
doi: 10.1038/s41586-024-07501-1. Epub 2024 Jun 5.

A disease-associated gene desert directs macrophage inflammation through ETS2

Affiliations

A disease-associated gene desert directs macrophage inflammation through ETS2

C T Stankey et al. Nature. 2024 Jun.

Abstract

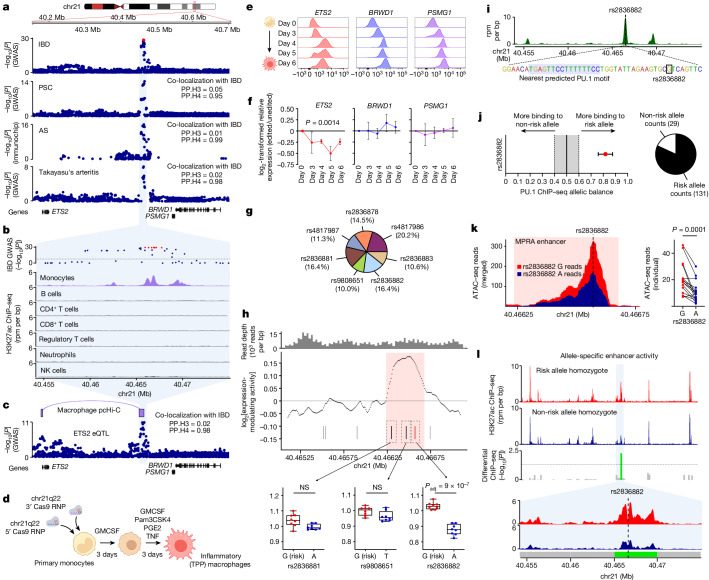
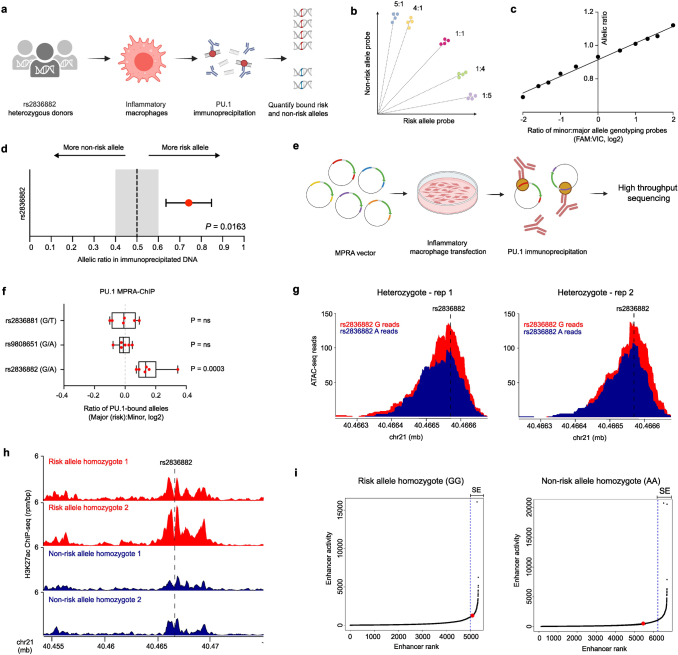
Increasing rates of autoimmune and inflammatory disease present a burgeoning threat to human health1. This is compounded by the limited efficacy of available treatments1 and high failure rates during drug development2, highlighting an urgent need to better understand disease mechanisms. Here we show how functional genomics could address this challenge. By investigating an intergenic haplotype on chr21q22-which has been independently linked to inflammatory bowel disease, ankylosing spondylitis, primary sclerosing cholangitis and Takayasu's arteritis3-6-we identify that the causal gene, ETS2, is a central regulator of human inflammatory macrophages and delineate the shared disease mechanism that amplifies ETS2 expression. Genes regulated by ETS2 were prominently expressed in diseased tissues and more enriched for inflammatory bowel disease GWAS hits than most previously described pathways. Overexpressing ETS2 in resting macrophages reproduced the inflammatory state observed in chr21q22-associated diseases, with upregulation of multiple drug targets, including TNF and IL-23. Using a database of cellular signatures7, we identified drugs that might modulate this pathway and validated the potent anti-inflammatory activity of one class of small molecules in vitro and ex vivo. Together, this illustrates the power of functional genomics, applied directly in primary human cells, to identify immune-mediated disease mechanisms and potential therapeutic opportunities.


Conflict of interest statement

C.T.S., C.B. and J.C.L. are listed as co-inventors on a patent application related to this work. C.W. holds a part-time position at GSK. GSK had no role in the design or conduct of this study. F.N.N. and P.D. are employees and shareholders of NanoString Technologies. NanoString had no role in the design or conduct of this study. The other authors declare no competing interests.

Figures

Fig. 1
Fig. 1. Resolving molecular mechanisms at chr21q22.
a, Disease associations at chr21q22. The red points denote the IBD 99% credible set. Co-localization results for each disease versus IBD. PP.H3, posterior probability of independent causal variants; PP.H4, posterior probability of shared causal variant. b, Immune cell H3K27ac ChIP–seq at chr21q22. IBD GWAS results are shown. NK cells, natural killer cells. rpm, reads per million. c, The ETS2 eQTL in resting monocytes, with co-localization versus IBD association. Macrophage promoter-capture Hi-C (pcHi-C) data at the disease-associated locus. d, Experimental schematic for studying the chr21q22 locus in inflammatory (TPP) macrophages. e, ETS2, BRWD1 and PSMG1 mRNA expression during TPP stimulation, measured using PrimeFlow RNA assays. Data are from one representative donor out of four. f, Relative ETS2, BRWD1 and PSMG1 expression (mean fluorescence intensity (MFI)) in chr21q22-edited macrophages versus unedited cells. n = 4. Data are mean ± s.e.m. Statistical analysis was performed using two-way analysis of variance (ANOVA)). g, SuSiE fine-mapping posterior probabilities for IBD-associated SNPs at chr21q22 (99% credible set). h, Macrophage MPRA at chr21q22. Data are oligo coverage (top), enhancer activity (sliding-window analysis with significant enhancer activity highlighted; middle) and expression-modulating effects of SNPs within the enhancer (bottom). For the box plots, the centre line shows the median, the box limits show the interquartile range, and the whiskers represent the minimum and maximum values. n = 8. False-discovery rate (FDR)-adjusted P values were calculated using QuASAR-MPRA (two-sided). i, Inflammatory macrophage PU.1 ChIP–seq peaks at chr21q22. Bottom, magnification of the location of rs2836882 and the nearest predicted PU.1 motif. j, BaalChIP analysis of allele-specific PU.1 ChIP–seq binding at rs2836882 in two heterozygous macrophage datasets (data are mean ± 95% posterior distribution of allelic balance). Total counts shown as a pie chart. k, Allele-specific ATAC–seq reads at rs2836882 in monocytes from 16 heterozygous donors (including healthy controls and patients with ankylosing spondylitis). Statistical analysis was performed using two-sided Wilcoxon matched-pair tests. l, H3K27ac ChIP–seq data from risk (top) or non-risk (bottom) allele homozygotes at rs2836882. Data are shown from two out of four donors. FDR-corrected P values were calculated using MEDIPS (two-sided). The diagrams in d and e were created using BioRender. Source Data
Fig. 2
Fig. 2. ETS2 is essential for macrophage inflammatory responses.
a, Experimental schematic for studying ETS2 in inflammatory (TPP) macrophages. The diagram was created using BioRender. b, Cytokine secretion after ETS2 disruption. Heat map of relative cytokine levels from ETS2-edited versus unedited macrophages. n = 8. c, Phagocytosis of fluorescently labelled zymosan particles by ETS2-edited and unedited macrophages (non-targeting control (NTC)) (left). Data are from one representative donor out of seven. Right, the phagocytosis index (the product of the proportion and MFI of phagocytosing cells). n = 7. d, ROS production by ETS2-edited and unedited macrophages. Data from one representative donor out of six (left). Right, NADPH oxidase component expression in ETS2-edited and unedited macrophages (western blot densitometry). n = 7. Source gels are shown in Supplementary Fig. 1. RLU, relative light units. e, RNA-seq analysis of differentially expressed genes in ETS2-edited versus unedited TPP macrophages (limma with voom transformation, two-sided). n = 8. The horizontal line denotes the FDR-adjusted significance threshold. f, fGSEA of differentially expressed genes between ETS2-edited and unedited TPP macrophages. The results of selected GO Biological Pathways are shown. The dot size denotes the unadjusted P value (two-sided), and the colour denotes normalized enrichment score (NES). g, The log2[fold change (FC)] of genes differentially expressed by chr21q22 enhancer deletion, plotted against their fold change after ETS2 editing. The percentages denote upregulated (red) and downregulated (blue) genes. The coloured points (blue or red) represent differentially expressed genes after ETS2 editing (FDR < 0.1, two-sided). For c and d, data are mean ± s.e.m. Statistical analysis was performed using two-sided Wilcoxon tests (bd); *P < 0.05. Source Data
Fig. 3
Fig. 3. ETS2 orchestrates macrophage inflammatory responses.
a, Experimental schematic for studying the effects of ETS2 overexpression. The diagram was created using BioRender. b, ETS2 mRNA levels in transfected (n = 8) or untransfected (from a separate experiment) macrophages. Data are mean ± s.e.m. CPM, counts per million. c, fGSEA analysis of differentially expressed genes between ETS2-overexpressing and control macrophages. Results shown for pathways downregulated by ETS2 disruption. The dot size denotes the unadjusted P value (two-sided), the colour denotes NES and the border colour denotes the quantity of transfected mRNA. d, fGSEA analysis of a Crohn’s disease intestinal macrophage signature in ETS2-overexpressing macrophages (versus control). FDR P-value, two-sided (top). Heat map of the relative expression of leading-edge genes after ETS2 overexpression (500 ng mRNA; bottom). e, Enrichment of macrophage signatures from patients with the indicated diseases in ETS2-overexpressing macrophages (versus control). The colour denotes the disease category, the numbers denote the NES and the dashed line denotes FDR = 0.05. The Crohn’s disease signature is from a different study to that shown in d. AS, ankylosing spondylitis. f, SNPsea analysis of genes tagged by 241 IBD SNPs within ETS2-regulated genes (red) and known IBD pathways (black). Significant pathways (Bonferroni-corrected P < 0.05) are indicated by hash symbols (#). Source Data
Fig. 4
Fig. 4. ETS2 directs macrophage responses through transcriptional and metabolic effects.
a, Genes co-expressed with ETS2 across 67 monocyte/macrophage activation conditions. The dotted lines denote FDR-adjusted P < 0.05. b, The effect of ETS2 disruption on glucose metabolism. The colour denotes median log2-transformed fold change in label incorporation from 13C-glucose in ETS2-edited versus unedited cells. The bold black border denotes P < 0.05 (Wilcoxon matched-pairs, two-sided). n = 6. Sec., secreted. c, fGSEA analysis of differentially expressed genes between ETS2-edited and unedited macrophages that were treated with roxadustat or vehicle. Results shown for pathways downregulated by ETS2 disruption. d, Enrichment heat maps of macrophage ETS2 CUT&RUN peaks (IDR cut-off 0.01, n = 2) in 4 kb peak-centred regions from ATAC–seq (accessible chromatin), H3K4me3 ChIP–seq (active promoters) and H3K27ac ChIP–seq (active regulatory elements). e, Functional annotations of ETS2-binding sites (using gene coordinates and TPP macrophage H3K27ac ChIP–seq data). f, ETS2 motif enrichment in CUT&RUN peaks (hypergeometric P value, two-sided). g, ETS2 binding, chromatin accessibility (ATAC–seq) and regulatory activity (H3K27ac) at selected loci. h, Intersections between genes with ETS2 peaks in their core promoters or cis-regulatory elements and genes upregulated (Up) or downregulated (Dn) after ETS2 editing (KO) or overexpression (OE). The vertical bars denote the size of overlap for lists indicated by connected dots in the bottom panel. The horizontal bars denote the percentage of gene list within intersections. i, ETS2 binding, PU.1 binding, chromatin accessibility and enhancer activity at chr21q22. Predicted ETS2-binding sites (red) and PU.1-binding sites (purple) shown below. The dashed line is positioned at rs2836882. Source Data
Fig. 5
Fig. 5. ETS2-driven inflammation is evident in disease and can be therapeutically targeted.
a, Myeloid cell clusters in intestinal scRNA-seq from Crohn’s disease and health (top). Middle, scaled expression of ETS2-regulated genes (downregulated by ETS2 disruption). Bottom, the source of cells (disease or health). b, Scaled expression of selected genes. c, Spatial transcriptomics of PSC and healthy liver. n = 4. The images show representative fields of view (0.51 mm × 0.51 mm) with cell segmentation and semisupervised clustering. The main key (left and middle below images) denotes InSituType cell types; clusters a–e (far right key) are unannotated cell populations. Hep., hepatocyte; LSECs, liver sinusoidal endothelial cells; non-inflamm. macs, non-inflammatory macrophages. d, The number of macrophages within the indicated distances of cholangiocytes. e, The distance from cholangiocytes to the nearest macrophage. Data are shown as Tukey box and whisker plots. Statistical analysis was performed using two-tailed Mann–Whitney U-tests. Data in d and e are from 10,532 PSC and 13,322 control cholangiocytes. f, Scaled expression of ETS2-regulated genes in 21,067 PSC macrophages at defined distances from cholangiocytes (excluding genes used to define macrophage subsets). g, Classes of drugs that phenocopy ETS2 disruption (from the NIH LINCS database). h, fGSEA results for NIH LINCS drug signatures. Significant MEK inhibitor signatures are coloured by molecule. i, The log2[fold change] of differentially expressed genes after chr21q22 enhancer deletion, plotted against their fold change after MEK inhibition. The percentages indicate the proportion of upregulated (red) and downregulated genes (blue). The coloured points (blue or red) were differentially expressed after MEK inhibition (FDR < 0.1). j, fGSEA of differentially expressed genes between MEK-inhibitor-treated and control TPP macrophages. Results are shown for pathways downregulated by ETS2 disruption. The dot size denotes the unadjusted P value (two-sided) and the colour denotes the NES. k, IBD biopsy cytokine release with PD-0325901, infliximab or vehicle control. l, GSVA enrichment scores for chr21q22-downregulated genes in IBD biopsies after MEK inhibition. m, GSVA enrichment scores of a biopsy-derived molecular inflammation score (bMIS). Data are mean ± 95% CI (f and l) and mean ± s.e.m. (k and m). Statistical analysis was performed using two-sided paired t-tests. n = 10 (k), n = 9 (l). **P < 0.01, ***P < 0.001, ****P < 0.0001. Source Data
Extended Data Fig. 1
Extended Data Fig. 1. Colocalisation between genetic associations at chr21q22.
a. Example comparison of genetic associations at chr21q22: IBD and ETS2 eQTL in unstimulated monocytes. Plot adapted from locuscomparer. b. Tukey box-and-whisker plot depicting ETS2 expression stratified by rs2836882 genotype in unstimulated monocytes (AA, n = 39; AG, n = 142; GG, n = 233). P-value is as reported in index study. c. Radar plot of representative colocalization results for the indicated genetic associations compared to IBD. Posterior probability of independent causal variants, PP.H3, dark blue; posterior probability of shared causal variant, PP.H4, light blue. PP.H4 > 0.5 was used to call colocalisation (denoted by dashed line). Labels are coloured according to class of data (indicated in the key). Asterisks denote colocalisation. Data sources are: IBD, PSC, AS, Takayasu Arteritis, BLUEPRINT, Fairfax, Quach, Nedelec, Alasoo. Source Data
Extended Data Fig. 2
Extended Data Fig. 2. CRISPR-Cas9 editing of the chr21q22 locus and ETS2 in monocytes.
a. Cas9 gRNAs were designed to flank the chr21q22 enhancer region at the indicated sites. b. Representative bioanalyzer trace of PCR-amplified target region following monocyte CRISPR/Cas9 editing with an equimolar mix of RNPs containing 5′ and 3′ chr21q22 gRNAs. Example editing efficiency calculation shown. c. Editing efficiency at the chr21q22 locus. Mean enhancer deletion: 42.4% (n = 11). d. Location and sequence of gRNAs used to disrupt ETS2. e. ETS2 editing efficiency. gRNA1 (mean), 89.7% (n = 31); gRNA2 (mean), 78.6% (n = 14). f. ETS2 expression (relative to NTC) following CRISPR/Cas9 editing, measured by qPCR (housekeeping gene PPIA; equivalent results with other housekeeping genes; n = 10). g. Viability following monocyte nucleofection with Cas9 RNPs and macrophage differentiation. Mean values: NTC, 97.9%; gRNA1: 98.3%; gRNA2, 98.6% (n = 6). h. Expression of myeloid lineage markers following ETS2 editing and TPP differentiation (n = 5). Gating strategy shown in Supplementary Information Fig. 2. i. GSVA enrichment scores for 67 different monocyte/macrophage activation conditions to identify stimuli that phenocopy CD14+ monocytes/macrophages from IBD patients. j. Chromatin accessibility in ETS2-edited versus unedited inflammatory macrophages (n = 3). k. Enhancer activity (H3K27ac) in ETS2-edited versus unedited inflammatory macrophages (n = 3). P values calculated using edgeR (two-sided) in j, k. Red points denote adjusted P-value (Padj) < 0.1, grey points NS. Error bars are mean±SEM in c, e-h. * P < 0.05. NTC: non-targeting control. Source Data
Extended Data Fig. 3
Extended Data Fig. 3. Optimization of MPRA and mRNA overexpression in primary human macrophages.
a. Schematic of MPRA. A library of oligonucleotides (each containing a genomic sequence and unique barcode, separated by restriction enzyme sites) is cloned into a pGL4.10 M cloning vector. A promoter and reporter gene are inserted using directional cloning. The resulting plasmids are transfected into primary human macrophages (TPP) and RNA is extracted after 24 h. Barcode abundance in cellular mRNA and input DNA library are quantified by high-throughput sequencing, and mRNA barcode counts are normalized to corresponding counts in DNA library to assess expression-modulating activity. b. Identification of suitable promoters for MPRA in TPP macrophages. TPP macrophages were transfected with reporter vectors, each with GFP expression under the control of a different promoter. GFP expression was quantified by flow cytometry after 24 h. c. Adapted MPRA vector for use in primary human macrophages, containing RSV promoter. d. Heatmap showing pairwise correlation of expression-modulating activity of all constructs between donors. e. Principal component analysis of element counts (sum of barcodes tagging same genomic sequence) in mRNA from TPP macrophages (n = 8 donors; red) and four replicates of DNA vector (black). f. Primary human macrophages (M0) were transfected with different quantities of GFP mRNA using Lipofectamine MessengerMAX. GFP expression was quantified by flow cytometry 18 h after transfection. g. Cytokine secretion following ETS2 overexpression. Plot shows relative cytokine concentrations in macrophage supernatants (ETS2 relative to control) following transfection with 500 ng mRNA (n = 11). Error bars are mean±SEM. One-sample t-test (two-tailed) * P < 0.05, ** P < 0.01. The diagram in a was created using BioRender. Source Data
Extended Data Fig. 4
Extended Data Fig. 4. Molecular effects of allelic variation at rs2836882.
a. Schematic of PU.1 ChIP-genotyping assay to assess allele-specific PU.1 binding at rs2836882 in human macrophages. b. Schematic of standard curve generation by TaqMan genotyping various pre-defined ratios of risk and non-risk containing DNA sequences. c. Standard curve generated using different allelic ratios of 200-nt DNA geneblocks centred on either the major (risk) or minor (non-risk) rs2836882 allele. d. Allele-specific PU.1 binding at rs2836882 in TPP macrophages (one-sample t-test, two-sided, n = 5). Error bars represent mean±95%CI. e. Schematic of PU.1 MPRA-ChIP assay to assess allele-specific PU.1 binding at individual SNPs within chr21q22 enhancer. f. Allele-specific PU.1 binding at SNPs within chr21q22 enhancer in TPP macrophages. Data represents the allelic ratio of normalized PU.1 binding for constructs centred on the SNP allele from the MPRA library (fixed-effects meta-analysis of QuASAR-MPRA results, two-sided, n = 6). Box represents median (IQR), whiskers represent minima and maxima. g. Allele-specific ATAC-seq reads at rs2836882 in two deeply sequenced heterozygous TPP macrophage datasets (left: 154.7 million non-duplicate paired-end reads, right: 165.4 million non-duplicate paired-end reads). h. H3K27ac ChIP-seq data from risk (red) or non-risk (blue) allele homozygotes at rs2836882 (n = 4). i. Rank Ordering of Super-Enhancers (ROSE) analysis of H3K27ac ChIP-seq data from TPP macrophages from major (left) and minor (right) allele homozygotes. Dashed line denotes inflection point of curve, with enhancers above this point being denoted as super-enhancers. Red points indicate rs2836882-containing chr21q22 enhancer. SE, super-enhancer. The diagrams in a, b and e were created using BioRender. Source Data
Extended Data Fig. 5
Extended Data Fig. 5. Functional effects of the chr21q22 enhancer.
a. Extracellular ROS production by unedited (NTC), chr21q22-edited, and ETS2 g1-edited TPP macrophages, quantified by chemiluminescence. Points represent relative area under curve for edited versus unedited cells (Wilcoxon signed-rank test, two-sided; n = 6). b. Cytokine secretion from inflammatory macrophages following deletion of the chr21q22 enhancer. Heatmap shows relative cytokine concentrations in the supernatants of chr21q22-edited TPP macrophages versus unedited (NTC) cells (Wilcoxon signed rank test, one-sided; n = 7). c. Representative flow cytometry histograms demonstrating phagocytosis of fluorescently-labelled zymosan particles by chr21q22-edited and unedited (NTC) TPP macrophages. d. Phagocytosis index for unedited and chr21q22-edited TPP macrophages, calculated as proportion of positive cells multiplied by mean fluorescence intensity of positive cells. Plot shows relative phagocytosis index for chr21q22-edited cells versus unedited cells (Wilcoxon signed-rank test two-sided; n = 7). e. Enrichment of differentially-expressed genes following deletion of the disease-associated chr21q22 locus (upregulated genes, top; downregulated genes, bottom) in ETS2-edited versus unedited macrophages. Padj, FDR-adjusted P-value (two-sided). f. Tukey box-and-whisker plot depicting quantitative PCR of selected ETS2-target genes in resting (M0) macrophages from minor and major allele homozygote IBD patients (n = 22, expression normalized to PPIA and scaled to minimum 0, maximum 1). Mann-Whitney test (one-sided). * P < 0.05, ** P < 0.01, *** P < 0.001. Source Data
Extended Data Fig. 6
Extended Data Fig. 6. Polygenic Risk Score of 22 ETS2-regulated IBD-associated genes.
a. Summary of IBD BioResource cohorts used for PRS analysis. b. Association between PRS and age at diagnosis. c. Association between PRS and extent of ulcerative colitis (E1, proctitis; E2, left-sided; E3, extensive colitis). d. Association between PRS and Crohn’s disease location (L1, ileal; L2, colonic; L3, ileocolonic). L2 is associated with a milder disease phenotype. e. Association between PRS and perianal involvement in Crohn’s disease. f. Association between PRS and Crohn’s disease behaviour (B1, inflammatory; B2, stricturing; B3, fistulating). B2 and B3 represent more aggressive, complicated forms of Crohn’s disease. g. Association between PRS and response to anti-TNFα in Crohn’s disease and ulcerative colitis (PR, primary responder; PNR, primary non-responder). h. Association between PRS and need for surgery in Crohn’s disease and ulcerative colitis. Overall, higher PRS was associated with: earlier age at diagnosis, ileal or ileocolonic forms of Crohn’s disease, B2/B3 Crohn’s disease behaviour, and increased need for surgery in IBD. Analysis in b performed using linear regression. Analyses in c-h performed using logistic regression (with diagnosis as covariate in g and h). SNPs included in PRS are listed in Extended Data Table 1. i. Plot of enrichment statistic (standardized effect size) against statistical significance from SNPsea analysis of genes tagged by 241 IBD SNPs within ETS2-regulated genes (red) and known IBD pathways (black). j. SNPsea analyses of SNPs associated with PSC, ankylosing spondylitis, Takayasu’s arteritis or Schizophrenia (negative control) within lists of ETS2-regulated genes–either upregulated by ETS2 overexpression, downregulated by ETS2 disruption, or downregulated following chr21q22 deletion (all FDR < 0.05). Dashed line denotes P < 0.05. Source Data
Extended Data Fig. 7
Extended Data Fig. 7. Effects of modulating ETS2.
a and b. Changes in total metabolite abundance (a) and percentage of label incorporation from 13C-glucose (b) following ETS2 editing in TPP macrophages (n = 6). Colour depicts median log2 fold-change in ETS2-edited macrophages relative to unedited macrophages (transfected with non-targeting control RNPs; NTC). Bold black border indicates P < 0.05 (Wilcoxon signed rank test, two-sided). c. Heatmap summarizing metabolic changes following ETS2 disruption. Colour depicts median log2 fold-change in ETS2 g1-edited cells relative to unedited cells (Wilcoxon signed rank test, two-sided, * P < 0.05). d. Phagocytosis index in unedited (NTC) and ETS2-edited TPP macrophages treated with roxadustat (ROX) or vehicle. Phagocytosis index is calculated as proportion of positive cells multiplied by mean fluorescence intensity of positive cells (488 nm channel). Data normalized to phagocytosis index in unedited cells (n = 5). e. Extracellular ROS production by unedited (NTC) and ETS2-edited TPP macrophages treated with ROX or vehicle – quantified using a chemiluminescence assay. Data represent log2 fold-change of area under curve (AUC) normalized to unedited (NTC) TPP macrophages (n = 5). f. TFmotifView enrichment results for motifs of transcription factors expressed in TPP macrophages (CPM > 0.5) within ETS2 CUT&RUN peaks. Results shown for all significantly enriched transcription factors (Bonferroni P value < 0.05, two-sided) with motifs in more than 10% peaks. g. Schematic of experiment to assess how ETS2 disruption affects the activity of the chr21q22 ETS2 enhancer in inflammatory (TPP) macrophages. h. Schematic of experiment to assess how ETS2 overexpression affects the activity of the chr21q22 ETS2 enhancer in resting (M0) macrophages. i. Normalized H3K27ac ChIP-seq read counts (edgeR fitted values) from chr21:40,465,000-40,470,000 in experiments depicted in g (left) and h (right) (edgeR P values, two-sided, n = 3 for each). Error bars in d and e represent mean±SEM. The diagrams in g and h were created using BioRender. Source Data
Extended Data Fig. 8
Extended Data Fig. 8. The transcriptional signature of ETS2 is detectable in affected tissues from chr21q22-linked diseases.
a. ETS2 expression in scRNA-seq clusters of myeloid cells from Crohn’s disease and healthy controls (upper panel). Relative contributions of single cells from Crohn’s disease or healthy controls to individual clusters (same UMAP dimensions as for combined analysis). b. Overlay of CosMx morphology 2D image data and raw transcripts of selected ETS2 target genes. Fluorescent morphology markers alone (top row), CXCL8 (cyan) and S1009A (yellow) transcripts (middle row), CCL5 (cyan) and CCL2 (yellow) transcripts (bottom row). Columns are representative examples of PSC with diseased ducts (left), PSC with uninflamed background liver (centre), and healthy liver (right). Size marker (white) on every field of view (FOV) denotes 50 µm. c. Gene set enrichment analysis (fGSEA) of genes downregulated following chr21q22 enhancer deletion or ETS2 disruption (gRNA1 or gRNA2) within intestinal macrophages from patients with active IBD (compared to control intestinal macrophages, n = 20; left), ankylosing spondylitis synovium (compared to control synovium, n = 15; centre), and PSC liver biopsies (compared to control liver biopsies, n = 17; right). Padj, FDR-adjusted P-value (two-sided). Source Data
Extended Data Fig. 9
Extended Data Fig. 9. Effect of MEK1/2 inhibition on ETS2-regulated genes.
a-c. Gene set enrichment analysis (fGSEA) in MEK1/2 inhibitor-treated TPP macrophages showing enrichment of gene sets upregulated (upper panel) or downregulated (lower panel) following ETS2 or chr21q22 editing (MEK1/2 inhibited using PD-0325901, 0.5 µM). Gene sets obtained from differential gene expression analysis (limma using voom transformation) following ETS2 disruption with gRNA1 (a), gRNA2 (b), or following chr21q22 deletion (c). d. fGSEA in intestinal biopsies from IBD patients showing enrichment of gene sets downregulated following ETS2 or chr21q22 editing in MEK inhibitor-treated biopsies. Upregulated gene sets were not enriched. e. Proportion and pathway analysis of MEK inhibitor-induced differentially expressed genes that have no evidence for being ETS2 targets in macrophages (incorporating differential expression from knockout or overexpression experiments and promoter / regulatory element binding from ETS2 CUT&RUN). Padj, FDR-adjusted P-value (two-sided). Source Data
Extended Data Fig. 10
Extended Data Fig. 10. Geographic distribution and history of rs2836882.
a. rs2836882 allele frequency in modern global populations (data from 1000 Genomes Project, plotted using Geography of Genetic Variants browser: https://popgen.uchicago.edu/ggv/). b. Genotypes of candidate SNPs at chr21q22 (99% credible set) in archaic humans (Neanderthals and Denisovans). Colour depicts the proportion of reads containing ALT alleles, with a value close to 0 consistent with a homozygous REF (risk) genotype, a value close to 1 consistent with a homozygous ALT (non-risk) genotype, and an intermediate value indicating a potential heterozygous genotype. Number in each cell indicates the number of reads at that SNP in the indicated sample. Putative causal variant highlighted in red. c. Inferred genealogy of the age of the rs2836882 polymorphism – analysed using Relate. The diagram in a was created using the Geography of Genetic Variants browser. Source Data

Comment in

  • ETS2 drives IBD.
    Crunkhorn S. Crunkhorn S. Nat Rev Drug Discov. 2024 Aug;23(8):581. doi: 10.1038/d41573-024-00110-7. Nat Rev Drug Discov. 2024. PMID: 38937615 No abstract available.

References

    1. Miller, F. W. The increasing prevalence of autoimmunity and autoimmune diseases: an urgent call to action for improved understanding, diagnosis, treatment, and prevention. Curr. Opin. Immunol.80, 102266 (2023). 10.1016/j.coi.2022.102266 - DOI - PMC - PubMed
    1. Dowden, H. & Munro, J. Trends in clinical success rates and therapeutic focus. Nat. Rev. Drug Discov.18, 495–496 (2019). 10.1038/d41573-019-00074-z - DOI - PubMed
    1. de Lange, K. M. et al. Genome-wide association study implicates immune activation of multiple integrin genes in inflammatory bowel disease. Nat. Genet.49, 256–261 (2017). 10.1038/ng.3760 - DOI - PMC - PubMed
    1. International Genetics of Ankylosing Spondylitis Consortium et al. Identification of multiple risk variants for ankylosing spondylitis through high-density genotyping of immune-related loci. Nat. Genet.45, 730–738 (2013). 10.1038/ng.2667 - DOI - PMC - PubMed
    1. Ji, S. G. et al. Genome-wide association study of primary sclerosing cholangitis identifies new risk loci and quantifies the genetic relationship with inflammatory bowel disease. Nat. Genet.49, 269–273 (2017). 10.1038/ng.3745 - DOI - PMC - PubMed

MeSH terms