. 2024 Jul;26(7):1047-1061.
doi: 10.1038/s41556-024-01436-5. Epub 2024 Jun 5.

MFSD1 with its accessory subunit GLMP functions as a general dipeptide uniporter in lysosomes

Affiliations

MFSD1 with its accessory subunit GLMP functions as a general dipeptide uniporter in lysosomes

Katharina Esther Julia Jungnickel et al. Nat Cell Biol. 2024 Jul.

Abstract

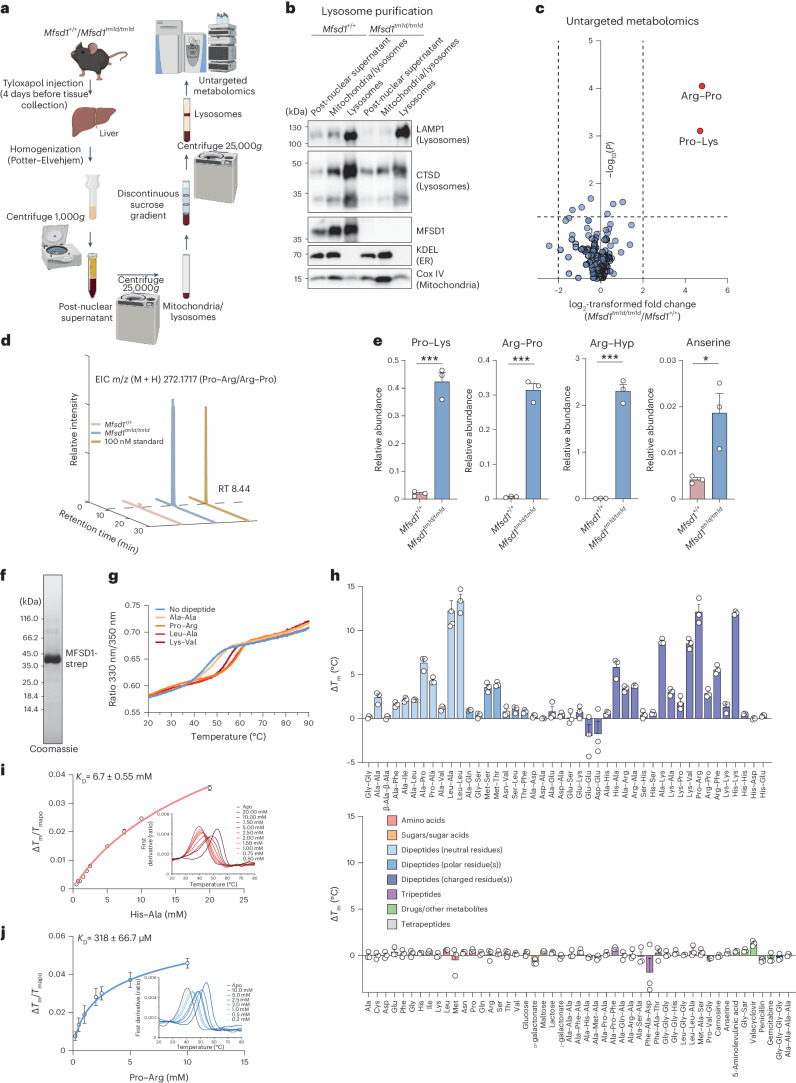
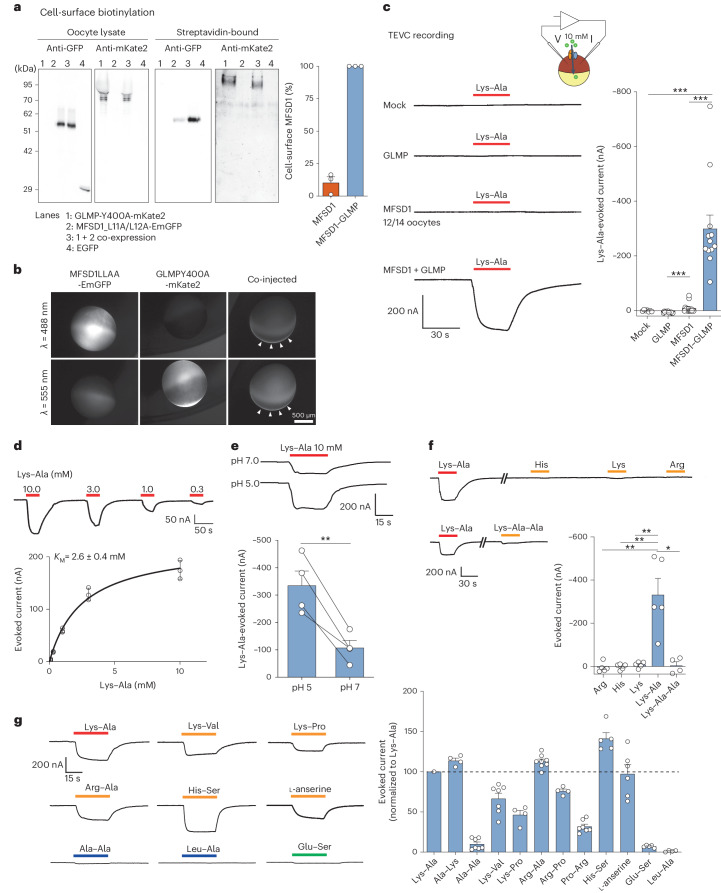
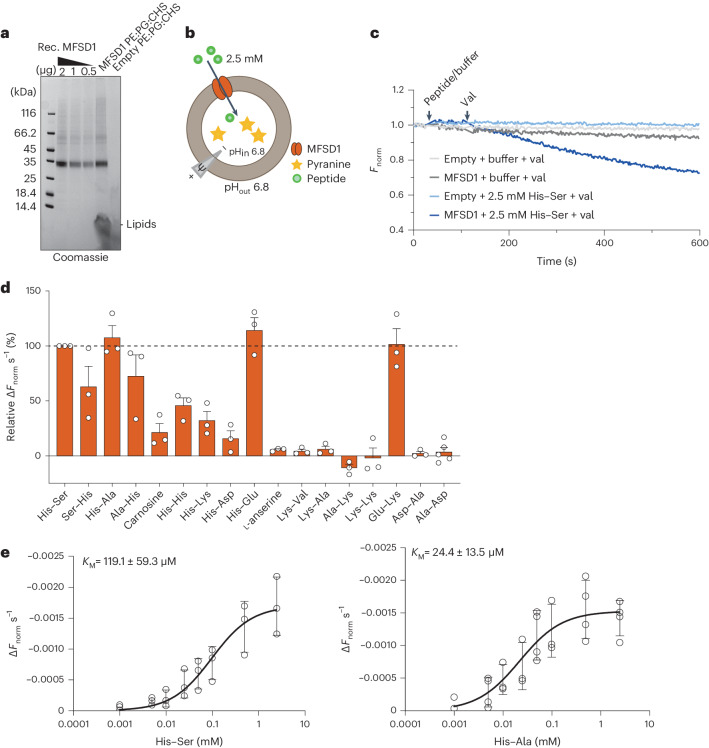
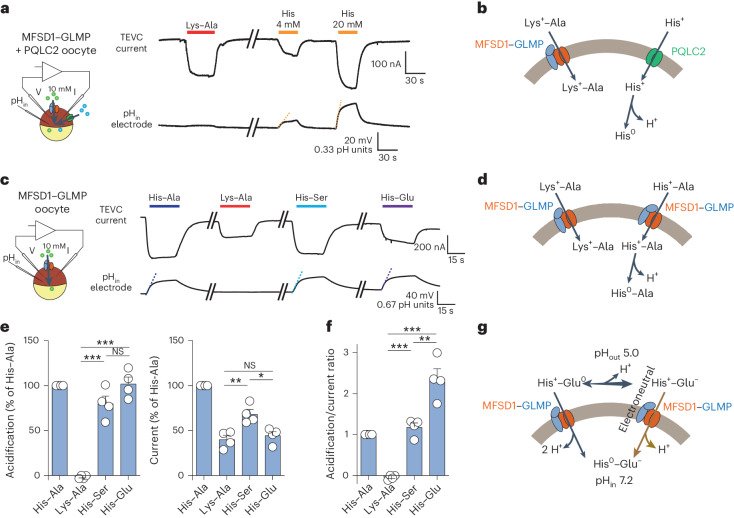
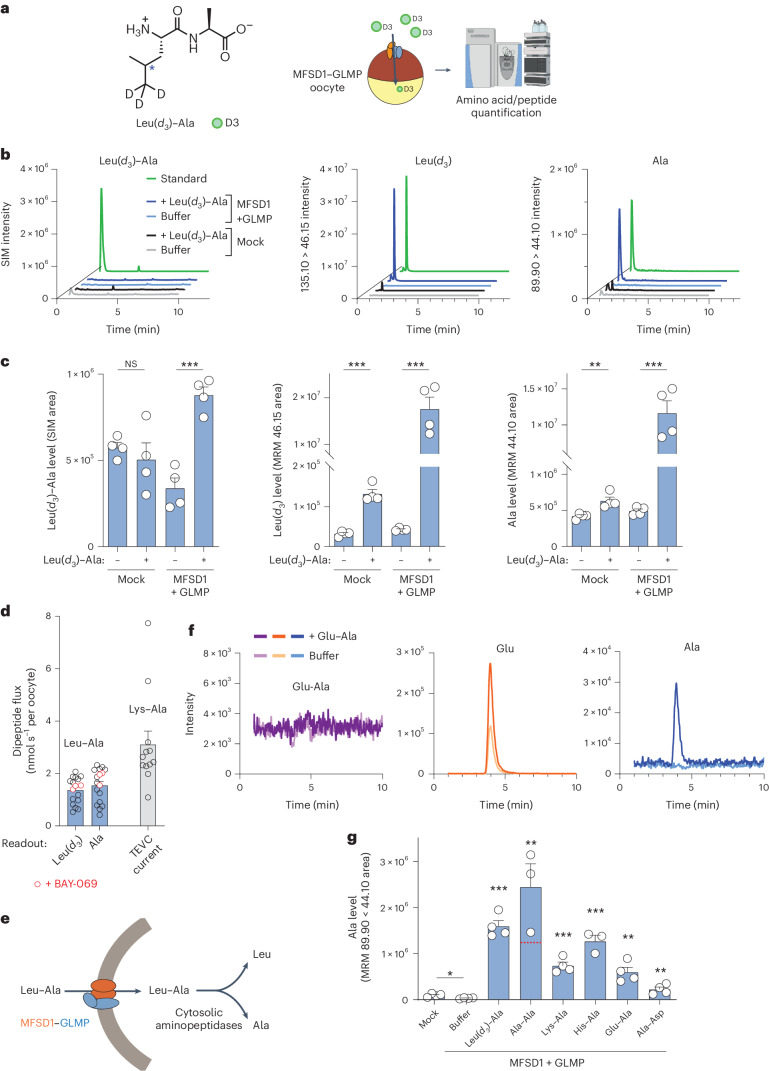
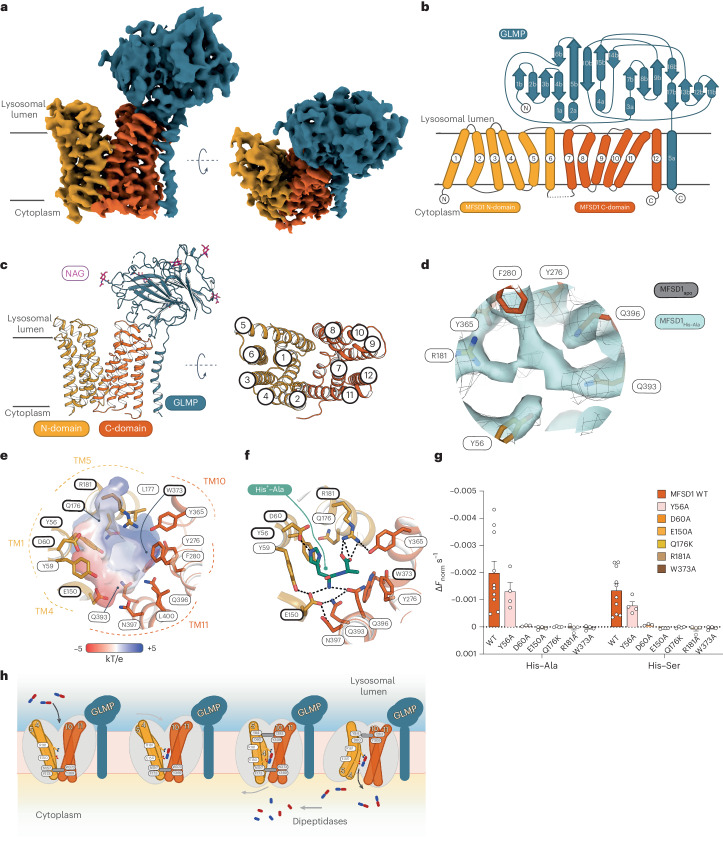
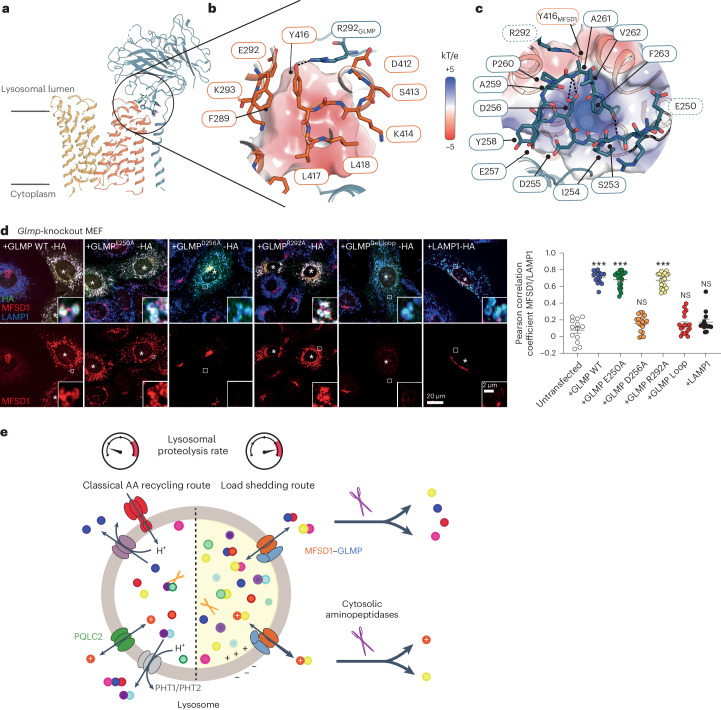
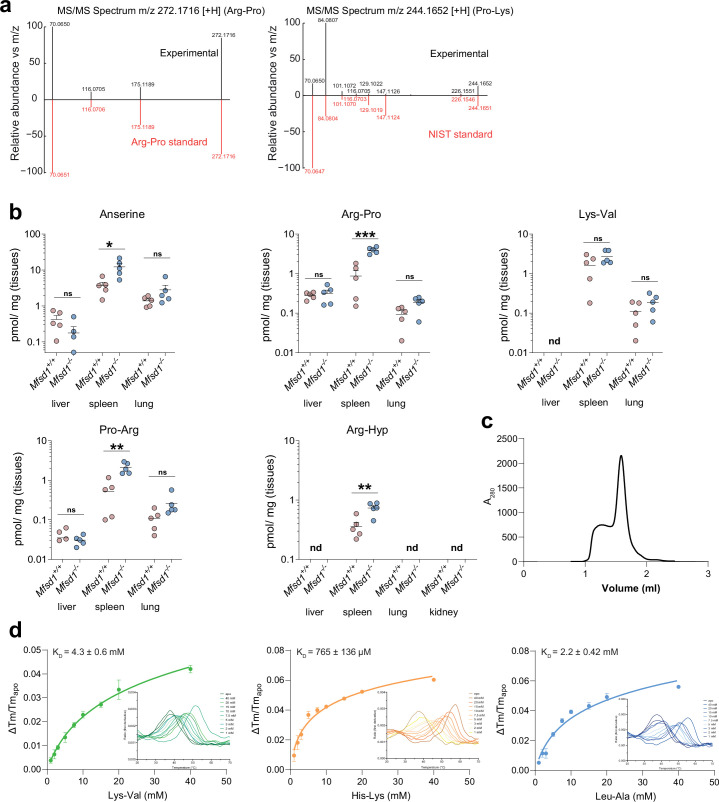
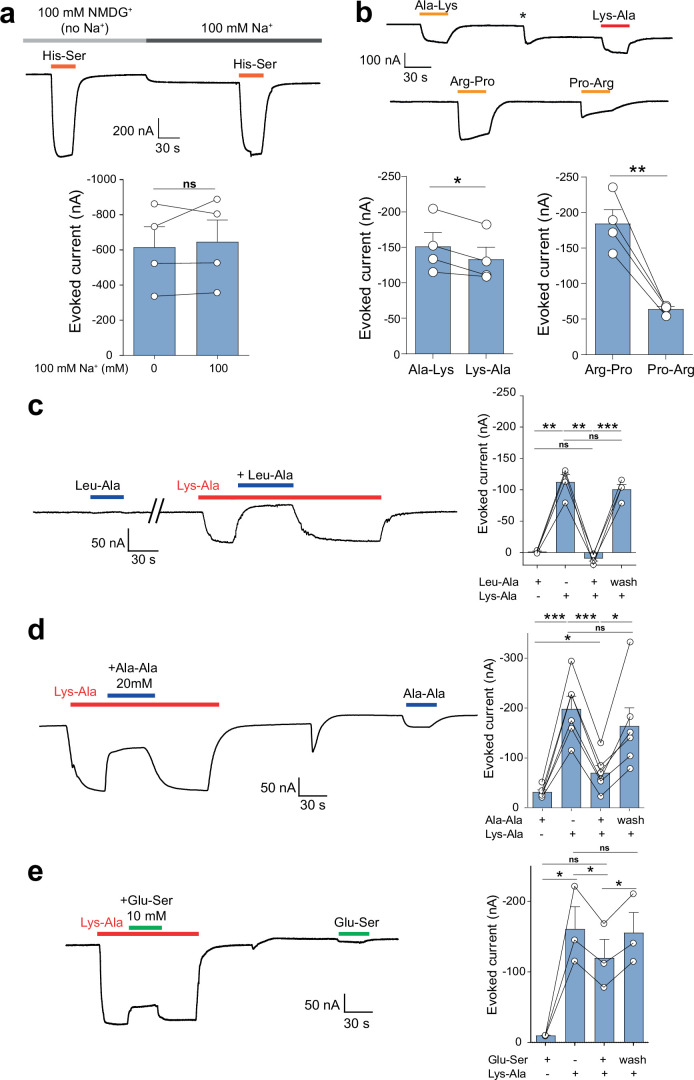
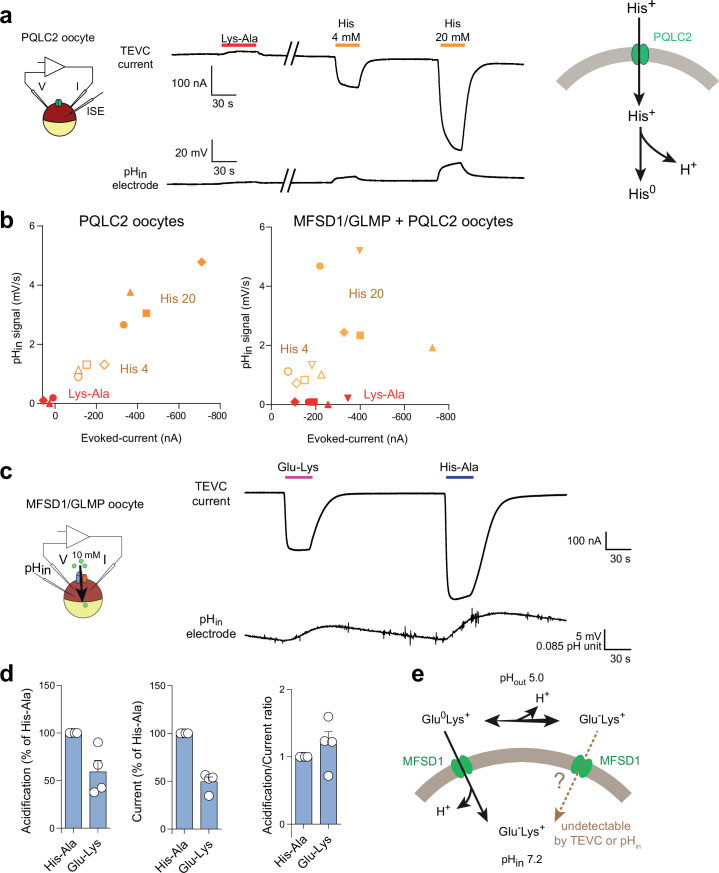
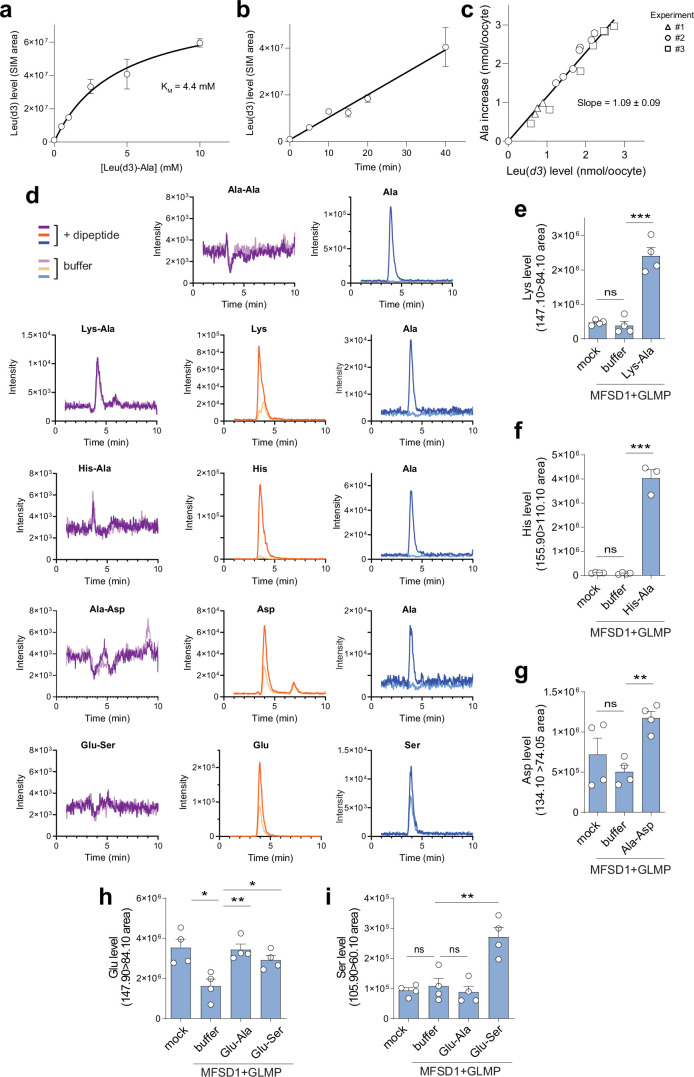
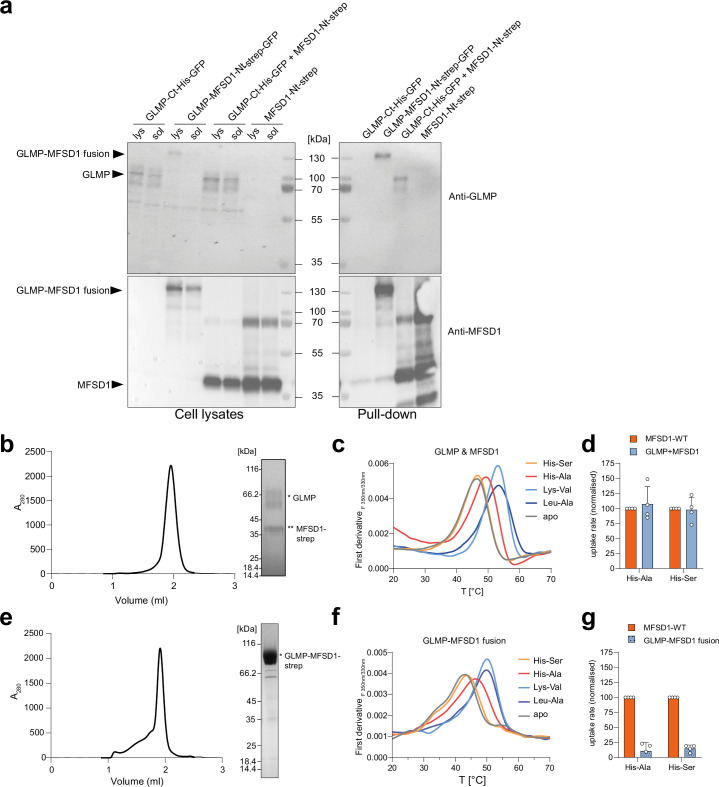
The lysosomal degradation of macromolecules produces diverse small metabolites exported by specific transporters for reuse in biosynthetic pathways. Here we deorphanized the major facilitator superfamily domain containing 1 (MFSD1) protein, which forms a tight complex with the glycosylated lysosomal membrane protein (GLMP) in the lysosomal membrane. Untargeted metabolomics analysis of MFSD1-deficient mouse lysosomes revealed an increase in cationic dipeptides. Purified MFSD1 selectively bound diverse dipeptides, while electrophysiological, isotope tracer and fluorescence-based studies in Xenopus oocytes and proteoliposomes showed that MFSD1-GLMP acts as a uniporter for cationic, neutral and anionic dipeptides. Cryoelectron microscopy structure of the dipeptide-bound MFSD1-GLMP complex in outward-open conformation characterized the heterodimer interface and, in combination with molecular dynamics simulations, provided a structural basis for its selectivity towards diverse dipeptides. Together, our data identify MFSD1 as a general lysosomal dipeptide uniporter, providing an alternative route to recycle lysosomal proteolysis products when lysosomal amino acid exporters are overloaded.


Conflict of interest statement

The authors declare no competing interests.

Figures

Fig. 1
Fig. 1. Mfsd1-knockout mice accumulate cationic dipeptides in liver lysosomes, and recombinant MFSD1 binds various dipeptides.
a, A schematic representation of lysosome enrichment by ultracentrifugation and untargeted metabolomics. b, Immunoblot analysis of PNS, mitochondria and lysosome-enriched fractions and the final lysosome-enriched fraction from WT and Mfsd1-knockout mice for markers of various cellular compartments. ER, endoplasmic reticulum. c, Volcano plot of differential metabolites between liver lysosomes of WT and Mfsd1-knockout mice (two-sided one-way analysis of variance with Tukey’s post hoc test, adjustment for multiple testing). d, Extracted ion chromatogram (EIC) for the chemical standard Pro–Arg (yellow, 100 nM) and representative samples from WT (red) and Mfsd1-knockout mice (blue). Pro–Arg is detected as a peak eluting at a retention time (RT) of 8.44 min. e, Relative abundance of Pro–Lys, Arg–Pro and anserine between WT and Mfsd1-knockout mice. The abundance was normalized to the isotopically labelled arginine levels, which showed no differences between the two genotypes in the untargeted metabolomic analysis (two-tailed unpaired t-tests). The data are means ± s.e.m. N = 5 for the animals/genotype (*P ≤ 0.05 and ***P ≤ 0.001). f, Coomassie-stained SDS–PAGE gel of purified MFSD1 with a Twin-Strep-tag that was transiently expressed in Expi293F cells and purified to homogeneity in DDM/CHS detergent solution. g, Unfolding traces of MFSD1 in the absence and presence of Ala–Ala, Pro–Arg, Leu–Ala and Lys–Val at a concentration of 5 mM. h, Thermal stability of MFSD1 in the presence of a compound library at a 5 mM final ligand concentration. The ΔTm of MFSD1 are given as a difference to the melting temperature of apo MFSD1 (Tm(apo)). The data are means ± s.e.m. (n = 3 for the independent samples). i,j, Examples of KD measurements are based on changes in the thermal stability of MFSD1 in the presence of varying concentrations of the dipeptides His–Ala (red) (i) or Pro–Arg (blue) (j). The KD values were determined using Moltenprot. hj, Data are shown as mean ± s.d. The source numerical data and unprocessed blots are available in the source data. Source data
Fig. 2
Fig. 2. Cationic dipeptides evoke an inward current in MFSD1–GLMP-expressing oocytes.
a, Surface biotinylation analysis of Xenopus oocytes expressing MFSD1L11A/L12A-EmGFP and/or GLMPY400A-mKate2. The oocytes expressing EGFP in the cytosol validated the selectivity of surface labelling in streptavidin-bound fractions. The western blots are representative of three independent experiments. b, Fluorescence micrographs of representative oocytes (n = 7 for either GLMP or MDFS1 alone and n = 25 for MFSD1 + GLMP). The arrowheads show MFSD1–GLMP colocalization at the plasma membrane. c, TEVC recording of oocytes clamped at −40 mV and perfused with 10 mM Lys–Ala at pH 5.0. The traces show representative Lys–Ala-evoked currents of 7–14 oocytes per expression condition. Only 2 out of 14 oocytes expressing only MFSD1L11A/L12A-EmGFP responded to Lys–Ala. The P values were calculated using two-sided Mann–Whitney U tests (***P ≤ 0.001). d, Dose–response relationship of the Lys–Ala current in MFSD1–GLMP oocytes. The current follows Michaelis–Menten kinetics with a KM of 2.6 ± 0.4 mM (mean ± s.e.m. of n = 3 oocytes). e, Lys–Ala was applied to each MFSD1–GLMP oocyte at pH 5.0 and pH 7.0 (mean ± s.e.m. of n = 4 oocytes). Two-tailed paired t-test, **P ≤ 0.01. f, Response of MFSD1–GLMP oocytes to cationic amino acids and to the tripeptide Lys–Ala–Ala (10 mM each) at pH 5.0. The P values were calculated using two-sided Mann–Whitney U tests, *P ≤ 0.05 and **P ≤ 0.01 (mean ± s.e.m. of n = 5 oocytes (Arg, His, Lys and Lys–Ala) and n = 4 oocytes (Lys–Ala–Ala)). g, Response of MFSD1–GLMP oocytes to diverse dipeptides compared with Lys–Ala (mean ± s.e.m. of 4–11 oocytes per substrate). The source numerical data and unprocessed blots are available in the source data.
Fig. 3
Fig. 3. MFSD1 is active as a dipeptide transporter in a liposome-based assay.
a, Coomassie-stained SDS–PAGE gel of MFSD1 after reconstitution into POPE:POPG:CHS liposomes (PE:PG:CHS). The experiment was performed 11 times. Rec., recombinant. b, A schematic of the experimental setup of liposome-based transporter assay. c, Representative traces of time-course measurements of uptake in the presence of 2.5 mM His-Ser and 1 µM val using MFSD1-containing liposomes (mmMFSD1) and those devoid of protein (empty). The addition of peptide or buffer and val during the measurements is indicated by the arrows. d, Substrate specificity of MFSD1 measured for liposome-based uptake assays. The initial uptake rates for each peptide are given as a percentage of the determined initial uptake rate of His-Ser. The data are shown as mean ± s.d. for n = 3. e, Michaelis–Menten kinetics of uptake of His-Ser and His–Ala by MFSD1. The KM and vmax values were calculated from three independent experiments using Prism GraphPad. The individual data points are plotted as mean ± s.d. The source numerical data are available in the source data. Source data
Fig. 4
Fig. 4. MFSD1 is a dipeptide uniporter.
a, Combined TEVC and pHin recording of oocytes expressing both MFSD1–GLMP and PQLC2 (sorting mutant L290A/L291A) at their surface. His, but not Lys–Ala, applied at pH 5.0, induces intracellular acidification (orange dotted lines). The traces are representative of five oocytes shown in Extended Data Fig. 3b. b, A model for the acidification induced by His following its release from PQLC2. c, Combined TEVC and pHin recording of an MFSD1–GLMP oocyte perfused with the indicated dipeptides (10 mM) at pH 5.0. d, A model accounting for the selective acidification by His-containing dipeptides. e, The experiment in c was repeated on four MFSD1–GLMP oocytes. The data are means ± s.e.m. of the acidification and current responses normalized to His–Ala (two-tailed unpaired t-test). *P ≤ 0.05, **P ≤ 0.01 and ***P ≤ 0.001. f, Normalized acidification/current ratios provide the number of protons released per translocated elementary charge for each substrate (two-tailed unpaired t-test). Mean ± s.e.m. **P ≤ 0.01 and ***P ≤ 0.001. g, A model accounting for the high number of protons released by His–Glu. At the tested potential (−40 mV), His–Glu molecules would be taken up by MFSD1–GLMP predominantly in the minor cationic form, His+–Glu0, releasing two protons per elementary charge. The higher acidification/current ratio observed (2.5 ± 0.2) may result either from the non-linear acidification/current relationship (Main) or from simultaneous uptake in the predominant zwitterionic form, His+–Glu-, which would release another proton in an electroneutral manner. The source numerical data are available in the source data. Source data
Fig. 5
Fig. 5. MFSD1 has a broad dipeptide selectivity.
a, Heavy isotope tracer approach used to monitor Leu–Ala transport. b, Representative LC–MS chromatograms of  ≥5 independent experiments. The amount of standard (green lines) was 3.9 pmol for Leu(d3)–Ala and 15.6 pmol for Leu(d3) and Ala. c, Relative quantification of the chromatographic peak area of Leu(d3)–Ala, Leu(d3) and Ala in extracts from mock and MFSD1–GLMP oocytes, incubated or not, with, 10 mM Leu(d3)–Ala for 20 min at pH 5.0. The data are means ± s.e.m. of four oocytes from a representative example of three independent experiments (two-tailed unpaired t-tests). *P ≤ 0.05, **P ≤ 0.01 and ***P ≤ 0.001. d, Absolute quantification of Leu–Ala uptake. The data are means ± s.e.m. of 17 oocytes from two oocyte batches. In one experiment, some oocytes were treated with the branched-chained amino acid transaminase inhibitor BAY-069. The Lys–Ala currents from Fig. 2c were divided by the Faraday constant and plotted with the same scale (grey bar) to allow comparison with Leu–Ala uptake. e, A model accounting for the LC–MS/MS data. f, Representative LC–MS chromatograms of eight MFSD1–GLMP oocytes from two batches incubated for 23 min at pH 5.0 with 10 mM Glu–Ala. g, Quantification of Ala in oocytes incubated for 23 min with the indicated dipeptides (10 mM). The means ± s.e.m. of three to four oocytes are depticted. The red dotted line at mid-height of the Ala–Ala bar is shown for comparison with other substrates. Two-tailed unpaired t-tests relative to MFSD1–GLMP oocytes incubated in dipeptide-free buffer; *P ≤ 0.05, **P ≤ 0.01 and ***P ≤ 0.001. The source numerical data are available in the source data.
Fig. 6
Fig. 6. The outward-open structure of GLMP–MFSD1.
a, Cryo-EM map of GLMP–MFSD1His–Ala. The N- and C-domain of MFSD1 are coloured yellow and orange, respectively. GLMP is coloured blue. b, Topology diagram of MFSD1 and GLMP. The N- and C-termini are labelled, and the secondary structure elements are numbered. c, Cartoon representation of GLMP–MFSD1 with top view of MFSD1. The numbering of TMs is indicated. Sugar modifications (acetylglucosamine (NAG)) identified on GLMP are coloured pink. d, Additional binding-site density was found for the GLMP–MFSD1 data set in the presence of the dipeptide with His–Ala (MFSD1His–Ala) compared with the apo dataset (MFSD1apo). The map of MFSD1His–Ala is shown as light blue surface and that of the apo dataset as grey mesh (light grey). Both the maps are depicted at σ = 6. The residues surrounding the extra density are labelled. e, The electrostatic surface potential (expressed as kT/e, with k, Boltzmann constant; T, temperature in K; and e, elementary charge), calculated with the APBS plugin in PyMol, highlights the bipolar character of the binding site. The residues that were mutated in this study are framed in bold black. f, Binding of the protonated dipeptide His+–Ala (green) as observed after 500 ns of MD simulations. Hydrogen bonds are indicated as dashed black lines, and residues used for mutational studies are framed in bold black. g, Effect of mutations of binding-site residues on uptake of His–Ala or His-Ser compared with MFSD1WT. The uptake rates are given as mean ± s.d. for n = 8 (MFSD1WT) or n = 4 (mutants) of independent experiments. h, A schematic of transport of dipeptides (blue (N-terminus) and red (C-terminus) sticks) by the GLMP–MFSD1 complex. The cytoplasmic gate formed by residues N157, F173, W373 and Y369 is shown (shown as a grey bar) as well as residues E150 and R118 involved in peptide coordination. The source numerical data are available in the source data.
Fig. 7
Fig. 7. Interaction of GLMP with MFSD1.
a, Cartoon representation of GLMP in complex with MFSD1. The interaction site of GLMP with MFSD1 is highlighted in stick representation. b, Zoom in on the interaction of MFSD1 to GLMP as viewed from MFSD1. The electrostatic surface of GLMP is shown. Y416 (MFSD1) is in hydrogen-bond (H-bond) distance to R292 (GLMP) and is highlighted as a black dotted line. c, Zoom in on the interaction of GLMP to MFSD1 as viewed from GLMP. The electrostatic potential surface of MFSD1 is highlighted, indicating complementarity to the GLMP surface. Besides the salt bridge between residues Y416 (MFSD1) and R292 (GLMP), residue D256 (GLMP) is at an H-bond distance from the backbone amide of A261 (GLMP), shown as black dotted lines. The loop region spanning residues 253 to 260 was mutated (blue border). The single-point mutants are highlighted in bold. d, Immunofluorescence-staining of endogenous MFSD1 (red) after transfection with hemagglutinin (HA)-tagged GLMP, GLMP mutants and LAMP1 (green) in Glmp-knockout MEFs. The endogenous LAMP1 is shown in blue. The transfected cells are marked with an asterick. The Pearson correlation coefficient for MFSD1/endogenous LAMP1 is shown in the right panel. The means ± s.e.m. for n = 13–20 cells are shown over two independent experiments (two-tailed unpaired t-tests). *P ≤ 0.05, **P ≤ 0.01 and ***P ≤ 0.001. e, Cellular model for the role of MFSD1 in the recycling of amino acids (AA) derived from lysosomal proteolysis. Owing to its broad selectivity and low affinity for dipeptides, MFSD1 provides an alternative recycling route when the lysosomal breakdown of proteins exceeds the capacity of lysosomal amino acid exporters. Fast cleavage of the released dipeptides by cytosolic aminopeptidases drives MFSD1 activity in the export direction and provides amino acids for biosynthetic pathways. The narrow selectivity of MFSD1 for dipeptides (in contrast with PHT1 and PHT2 transporters) prevents competition by single amino acids and protects this load-shedding route from amino acid overload. The source numerical data are available in the source data.
Extended Data Fig. 1
Extended Data Fig. 1. Validation of Arg-Pro and Pro-Lys with standards and dipeptide levels in tissues of Mfsd1tm1d/tm1d mice.
(a) Mirror plots for the experimental MS/MS spectra of Arg-Pro (left) and Pro-Lys (right) and authentic chemical standards. The individual spectra for the experimentally determined metabolites are shown in black, and the spectra of the chemical standards are shown in red. (b) Quantification of the levels of the dipeptides anserine, Arg-Pro, Lys-Val, Pro-Arg, and Arg-Hyp in total tissue lysates of 6-month-old wildtype ad Mfsd1 knockout mice. n = 5 animals/genotype.P-values were calculated using two-tailed paired t-tests. Error bars show the mean ± SEM. (c) SEC chromatogram of purified MFSD1 with a Streptavidin-tag (Superdex 200 5/150 increase (Cytiva) column). (d) KD measurements for Lys-Val, His-Lys, LeuAla. KD measurements are based on changes in the thermal stability of MFSD1 in the presence of varying concentrations of the dipeptides Lys-Val (green), His-Lys (orange), and LeuAla (blue). N = 3 experiments, data are shown as mean ± SEM. KD values were determined using Moltenprot (Kotov et al.). Source numerical data are available in source data.
Extended Data Fig. 2
Extended Data Fig. 2. Dipeptide selectivity of MFSD1/GLMP in the TEVC oocyte assay.
(a) The MFSD1/GLMP transport current does not depend on sodium ions. His-Ser (10 mM) was applied to MFSD1/GLMP oocytes at pH 5.0 in the presence of Na+ or NMDG+ as the major cation. P-values were calculated using two-tailed paired t-tests. mean + SEM, n = 4 oocytes. (b) Residue order effect for two cationic dipeptides. Representative traces and mean TEVC currents ± SEM of four MFSD1/GLMP oocytes. P-values were calculated using two-tailed paired t-tests. mean ± SEM, n = 4 oocytes. (c, d) Competition of the Lys-Ala current by neutral dipeptides. Lys-Ala (3 mM) and Leu-Ala or Ala-Ala (20 mM) were applied separately or simultaneously to MFSD1/GLMP oocytes at pH 5.0. Representative traces and mean currents ± SEM n = 4 (Leu-Ala) n = 6 (Ala-Ala) oocytes. (e) The competition experiment was repeated with the anionic dipeptide Glu-Ser (10 mM). P-values were calculated using two-tailed paired t-tests, mean ± SEM, n = 3 oocytes. Source numerical data are available in source data.
Extended Data Fig. 3
Extended Data Fig. 3. Additional evidence for the uniporter model uptake of Glu-Lys into MFSD1/GLMP oocytes.
(a) Combined TEVC and intracellular pH (pHin) recording of oocytes expressing only the sorting mutant of PQLC2. Lys-Ala (20 mM) is not transported by PQLC2. The traces are representative of four PQLC2 oocytes. (b) The current/acidification relationship of the experiments is shown in Fig. 4a and Extended Data Fig. 3a. The graphs show individual TEVC and pHin responses to Lys-Ala (10 mM) and His (4 or 20 mM). Each symbol shape represents a distinct oocyte. (c) Representative TEVC and pHin traces of the response of MFSD1/GLMP oocytes to Lys-Glu. (d) Acidification and current responses normalized to His-Ala and normalized acidification/current ratios. Data are means ± SEM of 4 oocytes. (e) A model accounting for the uptake of Glu-Lys by MFSD1/GLMP. Only uptake of the minor cationic form, Glu0-Lys+, can be detected in this electrophysiological technique. Source numerical data are available in source data.
Extended Data Fig. 4
Extended Data Fig. 4. Additional evidence for Leu-Ala uptake by MFSD1 and Substrate selectivity of MFSD1/GLMP in the LC-MS/MS assay.
(a) Dose-response relationship of the accumulation of Leu(d3) in MFSD1/GLMP oocytes exposed to Leu(d3)-Ala (means ± SEM of 3 oocytes). The line shows a hyperbolic curve fit with a KM value of 4.4 mM (R2 = 0.989). (b) Time course of Leu(d3) accumulation in the presence of 10 mM Leu(d3)-Ala (means ± SEM of 3 oocytes). Linear regression R2 = 0.980. (c) Relationship between the accumulation of Leu(d3) and the increase of ‘light’ Ala over its endogenous level. Data shown in Fig. 5c were replotted to show the equimolar ratio between these two proxies of Leu(d3)-Ala uptake. Linear regression of the pooled data yielded a ratio of 1.15 Ala molecule co-released with each Leu(d3) molecule (R2 = 0.980), or a mean ratio of 1.09 ± 0.09 when the 3 experiments were analyzed separately. (d-i) Substrate selectivity of MFSD1/GLMP in the LC-MS/MS assay. (d) Representative LC-MS chromatograms of 6 to 8 oocytes per condition from 2 independent experiments. (e-i) Relative quantification of the chromatographic peak area of Lys, His, Asp, Glu, and Ser in extracts from mock and MFSD1/GLMP oocytes, incubated or not, with the indicated dipeptides (10 mM) for 23 min at pH 5.0. Data are means ± SEM; (e + g): n = 4 oocytes, (f): n = 3 oocytes from the same experiment. Two-tailed unpaired t-tests: ns = not significant; * p ≤ 0.05; ** ≤ 0.01; *** p ≤ 0.001. Source numerical data are available in source data.
Extended Data Fig. 5
Extended Data Fig. 5. The recombinantly expressed proteins interact in vitro.
(a) Pull-down assays of Twin-Strepavidin (strep) tagged MFSD1 (MFSD1-Nt-strep), GFP-strep-tagged GLMP-MFSD1 (GLMP-MFSD1-Nt-strep-GFP) and GFP-8×His-tagged GLMP (GLMP-Ct-His-GFP) and GLMP-MFSD1-Nt-strep-GFP. Each protein was individually over-expressed in Expi293F, and additionally, MFSD1-Nt-strep was co-expressed with GLMP-Ct-His-GFP. MFSD1 and GLMP were detected in Western blot using specific primary antibodies against either MFSD1 or GLMP. Samples either contained crude lysate (lys) or the soluble fraction (sol) of each construct over-expressed in Expi293F cells (left panel) or the elution fraction after pull-down over Strep-Tactin beads (right panel). Bands corresponding to GLMP, GLMP-MFSD1, or MFSD1 are indicated. The experiment was performed once. (b) SEC chromatogram and SDS-PAGE gel of purified GLMP in complex with MFSD1 carrying a twin-streptavidin-tag (MFSD1-strep). (c) Thermal stability of GLMP in complex with MFSD1-strep in the absence (apo) or presence of 5 mM His-Ser, His-Ala, Lys-Val, or Leu-Ala. (d) Normalized initial uptake rates of the dipeptides His-Ala or His-Ser during liposome-based assays by MFSD1WT and GLMP/MFSD1 complex. n = 4, of two reconstitution batches; Error bars are shown as SD. (e) SEC chromatogram and SDS-PAGE gel of purified GLMP-MFSD1-fusion protein carrying a twin-streptavidin-tag. (f) Thermal stability of GLMP-MFSD1-fusion protein in the absence (apo) or presence of 5 mM His-Ser, His-Ala, Lys-Val, or Leu-Ala. (g) Normalized initial uptake rates of the dipeptides His-Ala or His-Ser during liposome-based assays by MFSD1WT and GLMP-MFSD1 fusion protein. n = 4, Error bars are shown as SD. Source numerical data and unprocessed blots are available in source data. Source data
Extended Data Fig. 6
Extended Data Fig. 6. Cryo-EM data collection and processing of the GLMP-MFSD1apo and GLMP-MFSD1His-Ala data sets.
(a) Image data processing workflow with a representative micrograph and 2D classes of the GLMP-MFSD1apo data set. All data were processed in cryoSPARC. (b) Angular distribution plot, GSFSC plot, and cryoEM map of initial reconstruction before further refinement. White arrowheads denote densities corresponding to N-glycans. (c) Angular distribution plot, GSFSC plot, and cryo-EM map of the final GLMP-MFSD1apo reconstruction colored by local resolution. (d-f) Cryo-EM data collection and processing of the GLMP-MFSD1His-Ala data set. (d) Image data processing workflow with a representative micrograph and 2D classes of the GLMP-MFSD1His-Ala data set. All data were processed in cryoSPARC. (e) Angular distribution plot, GSFSC plot, and Cryo-EM map of initial reconstruction before further refinement. White arrowheads in 2D class references denote densities corresponding to N-glycans. (f) Angular distribution plot, GSFSC plot, and Cryo-EM map of the final GLMP-MFSD1His-Ala reconstruction colored by the local resolution.
Extended Data Fig. 7
Extended Data Fig. 7. Density map of the Cryo-EM structure of GLMP-MFSD1His-Ala.
(a) Cyro-EM map (grey mesh) is shown and depicts a density within a 2.5 Å radius of any modelled atom. Maps are shown for individual helices of MFSD1, with individual residues shown as sticks (yellow and orange). (b) Cryo-EM map (grey mesh) is shown and depicts a density within a 2.5 Å radius around the model of GLMP (blue). Individual residues of the transmembrane helix and the five NAG molecules (pink) are shown as sticks. (c) Overlay of the Cryo-EM structure of GLMP (blue) with the X-ray structure of GLMP (light blue, PDB-ID: 6NYQ). The RMSD of the superimposition is 1.12 Å over 271 residues of the luminal GLMP domain. Five of the NAG molecules (pink) identified in the Cryo-EM structure overlap with the six NAG molecules (light pink) found in the X-ray structure of GLMP (PDB-ID: 6NYQ). Additionally, the X-ray structure of GLMP contains three sodium ions (purple spheres). The zoom-in highlights the loop region, which is responsible for the interaction of GLMP with MFSD1, which has not been modeled in the crystal structure and is structured in the EM-derived model.
Extended Data Fig. 8
Extended Data Fig. 8. MD simulations of dipeptide-bound MFSD1 and Flexibility of dipeptide binding in MFSD1 during MD simulations.
(a) MD simulations were performed on MFSD1 in complex with the dipeptides Leu-Ala (rose), His-Ala in its neutral (His(0)-Ala, pale teal) and charged (His(+)-Ala, teal) state and Lys(+)-Ala, purple). The basis of the binding mode for each peptide was the initial non-protein density found in the GLMP-MFSD1His-Ala map. The dipeptide His-Ala was placed in two different binding poses, denoted peptide orientation 1 (pale blue background) and peptide orientation 2 (light orange background). Based on this pose, the remaining ligands were oriented. Shown and labeled are critical binding site residues for each starting structure and the same view for the binding site of each simulation run after 500 ns. Additional interacting residues appearing at the endpoint of the simulation are highlighted in the respective panels. (b-g) Flexibility of dipeptide binding in MFSD1 during MD simulations. (b) The binding site of MFSD1 represents the starting pose of Leu-Ala (grey) and the final pose of the peptide after 500 ns of MD simulation (light purple) for each of the two peptide orientations (1 and 2). Below are RMSD plots of distant changes of the N- and C-terminus of the peptide with respect to residues E150 and R181. Plots show the results for each peptide orientation (orientation 1-blue, orientation 2-orange). MD simulations were run in triplicates. (c) Illustration of the MFSD1 binding site of MFSD1 with the starting pose of Lys-Ala pose of the dipeptide His(0)-Ala (grey) and the final pose after 500 ns of triplicate MD simulation (pale teal) for each of the two peptide orientations (1&2). (d) Binding site of MFSD1 showing the starting pose of the dipeptide His(0)-Ala (grey) and the final pose after 500 ns of MD simulation (pale teal) for each of the two peptide orientations (1&2). Below are RMSD plots of distant changes of the N- and C-terminus of the substrate with respect to residues E150 and R181. RMSD plots highlight the results for each peptide orientation (orientation 1-blue, orientation 2-orange) run in triplicates. (e) The Starting pose of the dipeptide His(+)-Ala (grey) and the final pose in the MFSD1 binding site after 500 ns of MD simulation (dark teal) are shown for each of the two peptide orientations (1&2). MD simulations were run in triplicates for each peptide orientation (orientation 1-blue, orientation 2-orange). (f) Comparison of dipeptide binding sites of MFSD1 in the outward-open conformation (orange) either in complex with Leu-Ala (MD simulation run 3, peptide orientation 2) or His(+)-Ala (MD simulation run 1, peptide orientation 2), the Cryo-EM structure of PepT1 (PDB-ID: 7PMX) in the outward-open conformation (pale purple) in complex with Ala-Phe, and the X-ray structure of DtpB (PDB-ID: 8B1H) in the inward-open conformation (pale green) bound to the dipeptide Lys-Val. Critical residues important for the coordinating of the N-terminus of the substrate are framed in blue and the C-terminus in red. Hydrogen bonds are shown as black dashed lines. (g) Plots of the distance changes between the N- (LigNter), C-terminus (LigCter), and the sidechain of the 2nd amino acid (LigSC2) in the ligand and sixteen residues located in the MFSD1 binding site.
Extended Data Fig. 9
Extended Data Fig. 9. Analysis of MD simulations of GLMP-MFSD1apo and MFSD1apo.
(a) Superposition of MFSD1 starting model (in blue, derived from the cryoEM model) and the structure after 500 ns of MD simulations of the three replicates (shades of red). (b) Superposition of GLMP-MFSD1 starting models (in blue, representing the cryoEM structure) and the complex after 500 ns of MD simulations of the three replicates (shades of grey). (c) RMSD (MFSD1 in relation to the starting CryoEM model) changes over the course of the MD simulation. The change in RMSD of MFSD1 in the apo form is shown in red, and the RMSD change of MFSD1 in the apo form as part of the complex with GLMP is given in grey blue. Each model was run in triplicates (Sim 1-3). (d) Conformational dynamics of the gate open to the lysosomal lumen (luminal gate) of MFSD1 in the absence/presence of the substrates and GLMP+MFSD1apo. The width of the opening of the luminal gate is defined as the distance between the centre of mass of two TM groups (group 1: TM1, TM2, and TM5; group 2: TM7, TM8, and TM11) and is plotted against its probability density. (e) A POPE lipid molecule (green) is only found between TMs of MFSD1 during simulations (run1-3) of the GLMP-MFSD1apo complex but not when simulations are run on MFSD1 only.
Extended Data Fig. 10
Extended Data Fig. 10. The binding-site mutations in MFSD1 lose binding to peptides in the thermal stability assay.
(a) FSEC analysis of MFSD1WT and mutants normalized to the fluorescent signal at λex = 488 nm/λem = 510 nm of GFP (F488) of MFSD1WT. The supernatant of soluble fraction after whole-cell solubilization was loaded onto a Superose 6 5/150 column. (b) SDS-PAGE of purified MFSD1WT and binding site mutants. For each lane, 2 µg of protein were loaded. (c) Comparison of SEC traces of binding site mutants (colored) to MFSD1WT (grey) of each mutant. Each mutant was purified once for subsequent experiments. (d), (e) Melting temperatures derived from thermal stability experiments of each mutant in the absence (apo, grey) or presence of 5 mM of selected peptides. n = 3 independent experiments with data shown as mean ± SD. For mutants for which no bar graph is given, unfolding traces are given for the apo state to show that no TM value could be determined. Source numerical data and unprocessed blots are available in source data. Source data

References

    1. Ballabio A, Bonifacino JS. Lysosomes as dynamic regulators of cell and organismal homeostasis. Nat. Rev. Mol. Cell Biol. 2020;21:101–118. doi: 10.1038/s41580-019-0185-4. - DOI - PubMed
    1. Settembre C, Perera RM. Lysosomes as coordinators of cellular catabolism, metabolic signalling and organ physiology. Nat. Rev. Mol. Cell Biol. 2023;25:223–245. doi: 10.1038/s41580-023-00676-x. - DOI - PubMed
    1. Wolfson RL, Sabatini DM. The dawn of the age of amino acid sensors for the mTORC1 pathway. Cell Metab. 2017;26:301–309. doi: 10.1016/j.cmet.2017.07.001. - DOI - PMC - PubMed
    1. Lloyd JB. Metabolite efflux and influx across the lysosome membrane. Subcell. Biochem. 1996;27:361–386. doi: 10.1007/978-1-4615-5833-0_11. - DOI - PubMed
    1. Kalatzis V, Cherqui S, Antignac C, Gasnier B. Cystinosin, the protein defective in cystinosis, is a H(+)-driven lysosomal cystine transporter. EMBO J. 2001;20:5940–5949. doi: 10.1093/emboj/20.21.5940. - DOI - PMC - PubMed

Publication types

LinkOut - more resources