. 2024 Jul;43(14):2979-3008.
doi: 10.1038/s44318-024-00132-2. Epub 2024 Jun 5.

Functional diversity among cardiolipin binding sites on the mitochondrial ADP/ATP carrier

Affiliations

Functional diversity among cardiolipin binding sites on the mitochondrial ADP/ATP carrier

Nanami Senoo et al. EMBO J. 2024 Jul.

Abstract

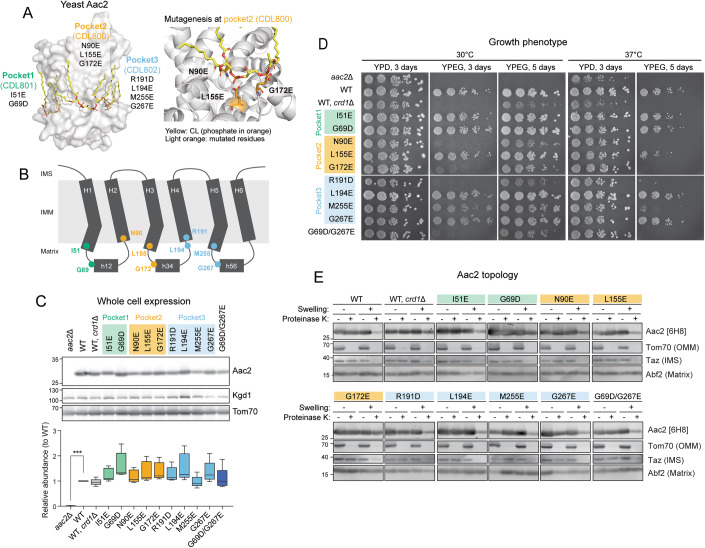
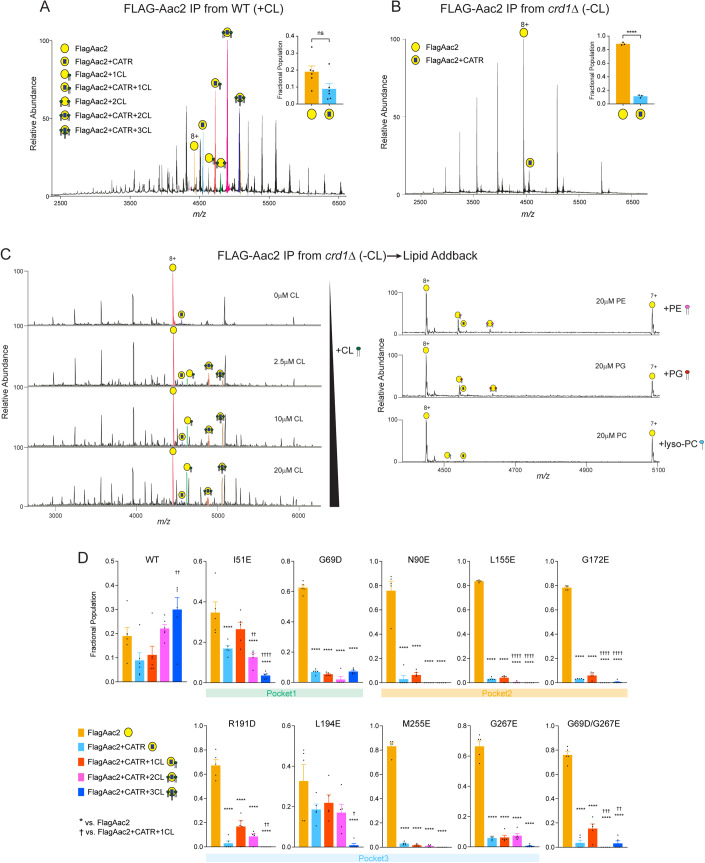
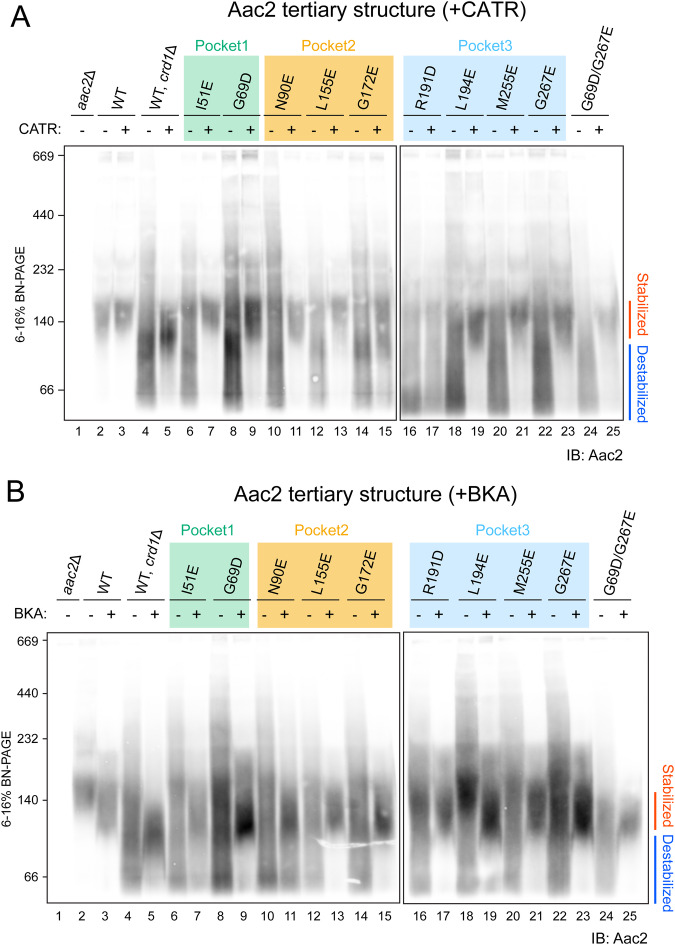
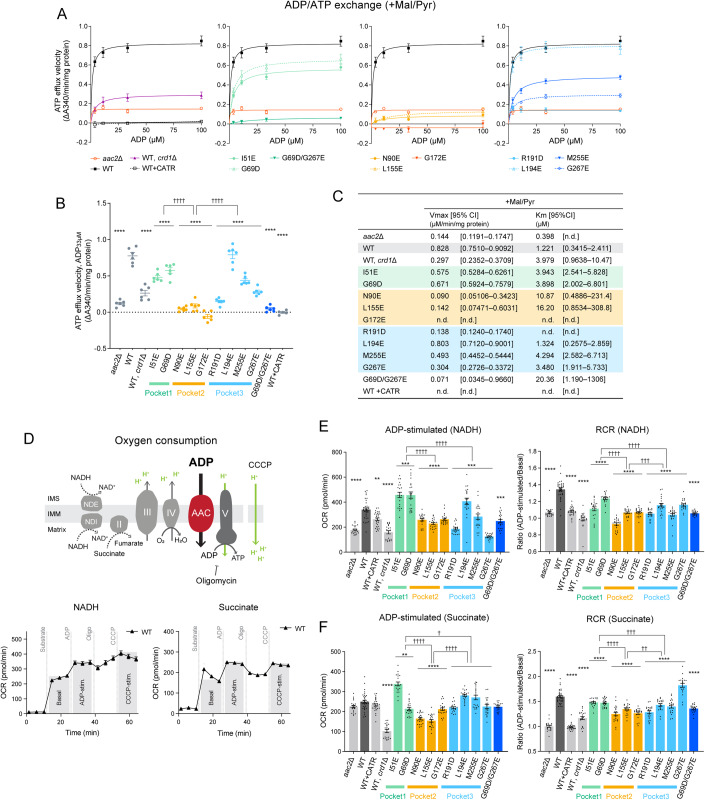
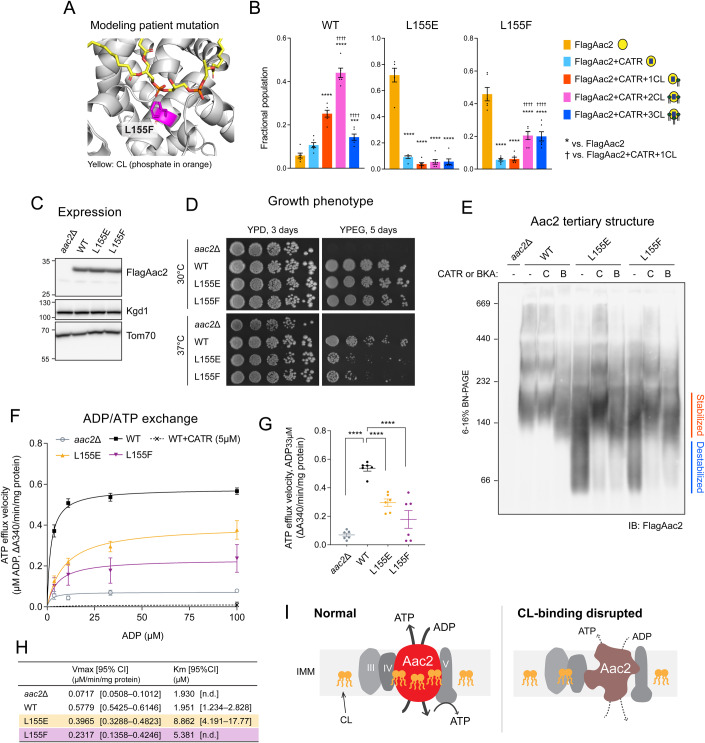
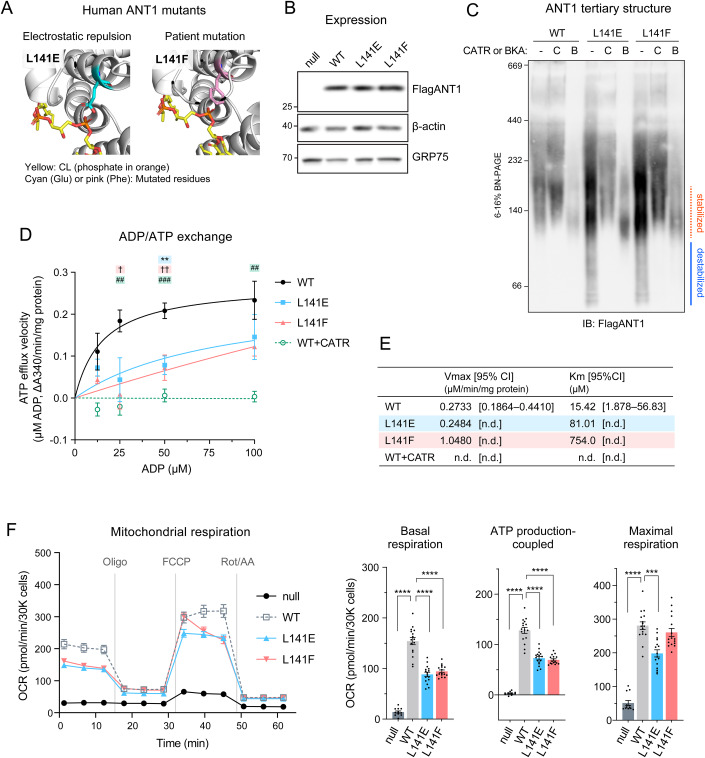
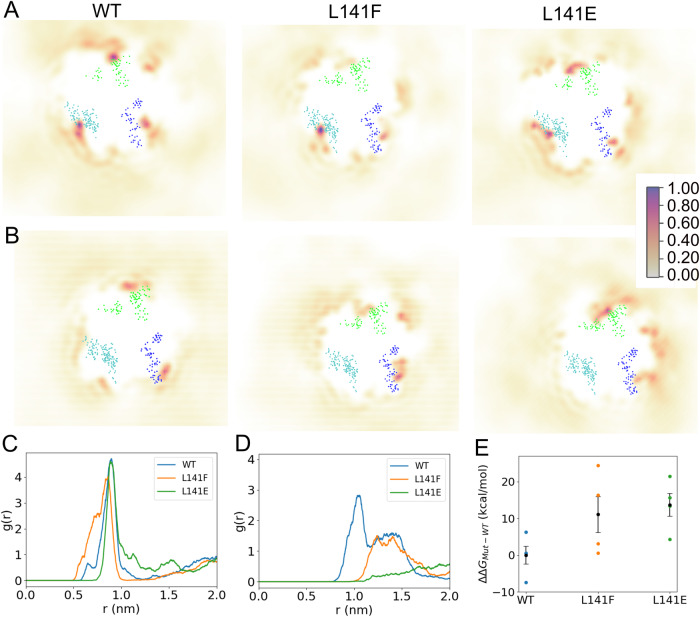
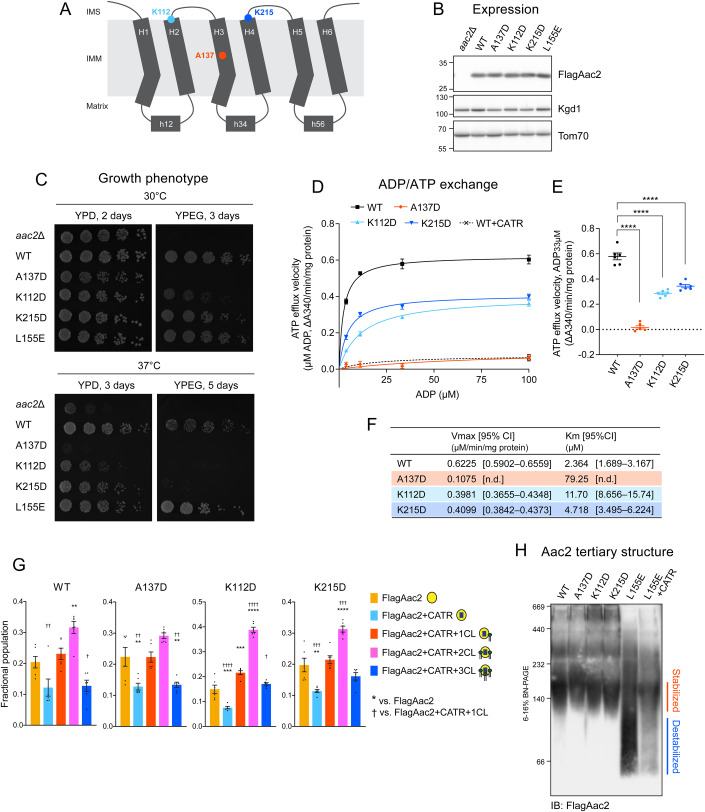
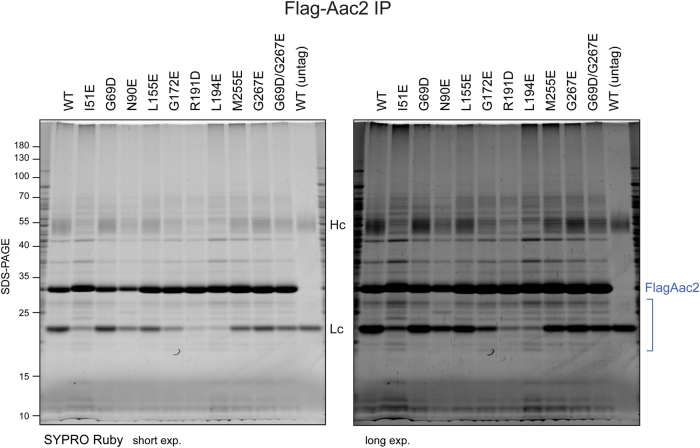
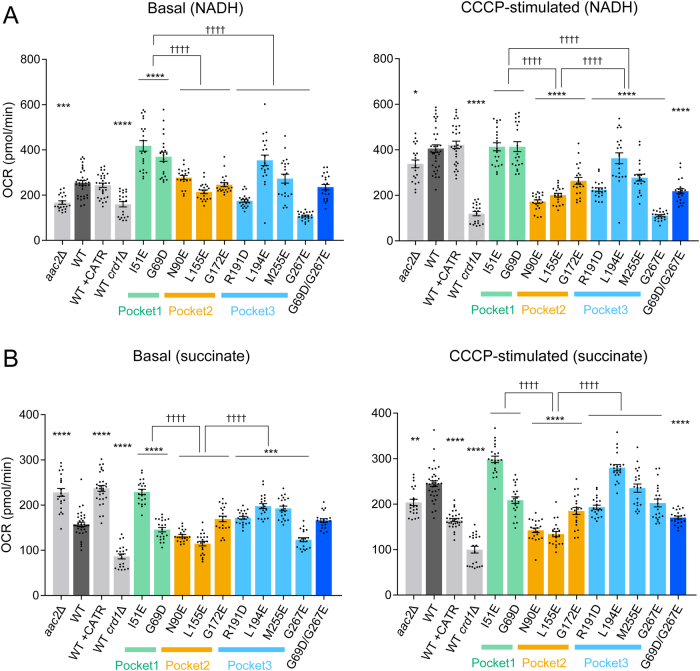
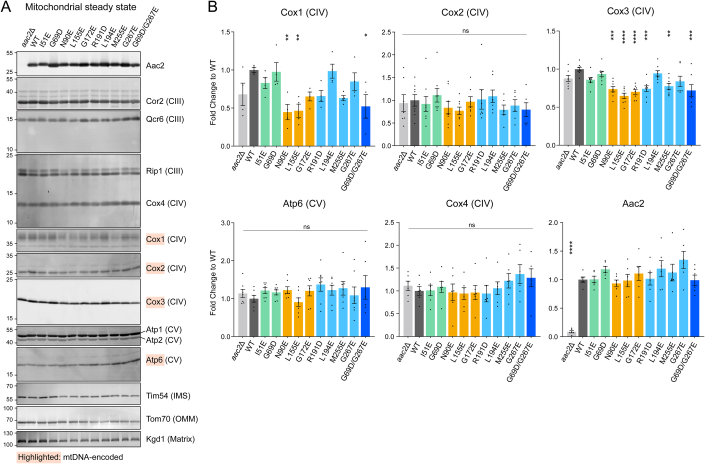
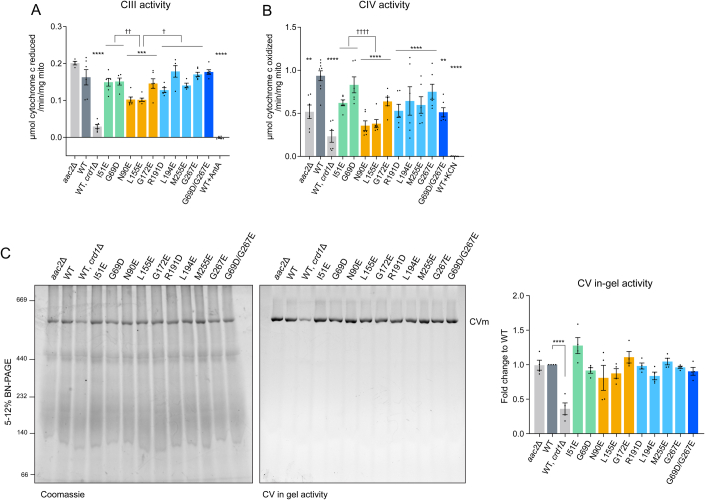
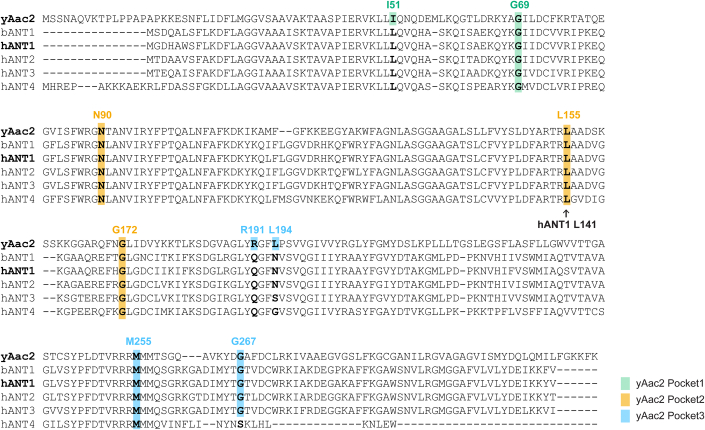
Lipid-protein interactions play a multitude of essential roles in membrane homeostasis. Mitochondrial membranes have a unique lipid-protein environment that ensures bioenergetic efficiency. Cardiolipin (CL), the signature mitochondrial lipid, plays multiple roles in promoting oxidative phosphorylation (OXPHOS). In the inner mitochondrial membrane, the ADP/ATP carrier (AAC in yeast; adenine nucleotide translocator, ANT in mammals) exchanges ADP and ATP, enabling OXPHOS. AAC/ANT contains three tightly bound CLs, and these interactions are evolutionarily conserved. Here, we investigated the role of these buried CLs in AAC/ANT using a combination of biochemical approaches, native mass spectrometry, and molecular dynamics simulations. We introduced negatively charged mutations into each CL-binding site of yeast Aac2 and established experimentally that the mutations disrupted the CL interactions. While all mutations destabilized Aac2 tertiary structure, transport activity was impaired in a binding site-specific manner. Additionally, we determined that a disease-associated missense mutation in one CL-binding site in human ANT1 compromised its structure and transport activity, resulting in OXPHOS defects. Our findings highlight the conserved significance of CL in AAC/ANT structure and function, directly tied to specific lipid-protein interactions.

Keywords: Cardiolipin; Lipid–Protein Interaction; Membrane Transport; Mitochondria; Oxidative Phosphorylation.


Conflict of interest statement

The authors declare no competing interests.

Figures

Figure 1
Figure 1. Generation and characterization of yeast Aac2 CL-binding mutants.
(A) Strategy to disrupt CL-binding sites in Aac2. Aac2 was modeled onto bovine ANT1 (PDB ID: 2C3E) using SWISS-MODEL. Negatively charged amino acids introduced (light orange) into Aac2 CL-binding motifs face toward the CL phosphate headgroup (orange). (B) Schematic representation showing the positions of designed mutations in Aac2. (C) Expression of WT and mutant Aac2 was detected in whole cell extracts by immunoblot; Kgd1 and Tom70 served as loading controls (n = 5, biological replicates). Data were shown as box-whisker plots with the box extended from 25th to 75th percentiles and the whiskers indicating the min to max range. Significant difference was obtained by one-way ANOVA with Dunnett’s multiple comparisons test (vs. WT) ***p < 0.001. (D) Growth phenotype of Aac2 CL-binding mutants. Serial dilutions of indicated cells were spotted onto fermentable (YPD) and respiratory (YPEG) media and incubated at 30 or 37 °C for 3–5 days (n = 3, biological replicates). (E) Membrane topology of WT and mutant Aac2. Isolated mitochondria were osmotically ruptured and treated with or without proteinase K as indicated. Aac2 N-terminus was detected by a monoclonal antibody 6H8 recognizing the first 13 amino acids MSSNAQVKTPLPP (n = 6, biological replicates). IMS intermembrane space, IMM inner mitochondrial membrane, OMM outer mitochondrial membrane. In (CE), representative images from the indicated replicates are shown. Source data are available online for this figure.
Figure 2
Figure 2. Native mass spectrometry analysis to detect lipid–protein interaction of Aac2.
(A) FlagAac2 affinity purified from WT mitochondria was associated with CATR and up to three CL molecules. (B) FlagAac2 affinity purified from crd1Δ mitochondria which lack CL did not co-purify other phospholipids. Insets in (A) and (B) show the fractional population of FlagAac2 relative to FlagAac2+CATR when immunoprecipitated from WT and crd1Δ mitochondria, respectively. Mean with SEM (n = 3–6: 3 biological replicates with 1–2 technical replicates). Significant differences as determined by Student’s t-test indicated (****p < 0.0001). (C) CL, PE, PG, or lyso-PC was added to FlagAac2 purified from crd1Δ mitochondria at the indicated concentrations. (D) Fractional population of FlagAac2, FlagAac2+CATR alone or associated with one to three CL molecules was determined for WT and Aac2 CL-binding mutants. Mean with SEM (n = 5–6: three biological replicates with 1–2 technical replicates). Significant differences were obtained by one-way ANOVA with Tukey’s multiple comparisons test (* vs. FlagAac2; † vs. FlagAac2+CATR + 1CL); */† p < 0.05, **/†† p < 0.01, ***/††† p < 0.001, ****/†††† p < 0.0001. Source data are available online for this figure.
Figure 3
Figure 3. CLs associated with Aac2 stabilize its tertiary structure.
Mitochondria (100 μg) from WT and Aac2 CL-binding mutants were mock-treated or instead incubated with either 40 μM CATR (A) or 10 μM BKA (B) and then solubilized with 1.5% (w/v) digitonin. The extracts were resolved by 6 to 16% blue native-PAGE and immunoblotted for Aac2 (n = 6, biological replicates). Representative images from the indicated replicates are shown. Source data are available online for this figure.
Figure 4
Figure 4. Distinct functional roles of the three tightly bound CLs.
(AC) ADP/ATP exchange: The efflux of matrix ATP was detected with isolated mitochondria as NADPH formation (A340; absorbance at 340 nm) occurring coupled with an in vitro glycolysis reaction which contained glucose, hexokinase, and glucose-6-phosphate dehydrogenase. The reaction was initiated by adding ADP. The measurement was performed in the presence of 5 mM malate and 5 mM pyruvate (+Mal/Pyr). Where indicated, WT mitochondria were treated with 5 μM CATR prior to the efflux reaction. (A) The linear part of the initial velocity for the ATP efflux was plotted and curve fitting performed by nonlinear regression (mean with SEM, n = 6, biological replicates). Plots of aac2Δ and WT are repeated in all panels. (B) The initial velocity following the addition of 33 μM ADP was presented as scatter plots (mean with SEM, n = 6, biological replicates). (C) Fitted Km and Vmax values were obtained using the Michaelis–Menten equation (mean). The range of determined values is shown in brackets (n.d., not detected). (D) Oxygen consumption rate (OCR) in isolated mitochondria with sequential injections of the respiratory substrate (NADH or succinate), ADP, oligomycin, and CCCP was measured using Seahorse XF96e FluxAnalyzer. (E, F) ADP-stimulated respiration and respiratory control ratio (RCR) of WT and Aac2 mutant mitochondria under NADH (E) and succinate (F) were plotted. RCR was obtained by dividing OCR of ADP-stimulated respiration by that of basal respiration (see also Fig. S5). WT mitochondria was treated with 50 μM CATR before the measurement. Mean with SEM, n = 21–35, 3–5 biological replicates with 5–7 technical replicates. Significant differences obtained by two-way ANOVA followed by Tukey’s multiple comparisons test are shown as * for comparison with WT and † for comparison between pocket mutants; *p < 0.05, **p < 0.01, ***p < 0.001, ****p < 0.0001. Source data are available online for this figure.
Figure 5
Figure 5. Disturbed Aac2–CL interaction is a pathological mechanism.
(A) Mitochondrial myopathy patient mutation L155F was introduced into yeast Aac2 as Fig. 1A. (B) Native MS analysis obtained the fractional population of WT and indicated FlagAac2 mutants associated with CATR and one to three CL molecules. Mean with SEM (n = 6: 2 biological replicates with 3 technical replicates). Significant differences were obtained by one-way ANOVA with Tukey’s multiple comparisons test (* vs. FlagAac2; † vs. FlagAac2 + CATR + 1CL); ***/††† p < 0.001, ****/†††† p < 0.0001. (C) Expression of WT and mutant Aac2 was detected in whole cell extract by immunoblot. Kgd1 and Tom70 served as loading controls (n = 4, biological replicates). (D) Growth phenotype of Aac2 CL-binding mutants. Serial dilutions of indicated cells were spotted onto fermentable (YPD) and respiratory (YPEG) media and incubated at 30 or 37 °C for 3–5 days (n = 4, biological replicates). (E) Aac2 tertiary structure: 100 μg of mitochondria from WT and Aac2-binding mutants were mock-treated or instead incubated with either 40 μM CATR (C) or 10 μM BKA (B) and then solubilized with 1.5% (w/v) digitonin. The extracts were resolved by 6 to 16% blue native-PAGE and immunoblotted for FlagAac2 (n = 6, biological replicates). (FH) ADP/ATP exchange: The efflux of matrix ATP was detected with isolated mitochondria as NADPH formation (A340; absorbance at 340 nm) occurring coupled with in vitro glycolysis reaction as in Fig. 4. The measurement was performed in the presence of 5 mM malate and 5 mM pyruvate (n = 6, biological replicates). (F) The linear part of the initial velocity following the addition of ADP at indicated concentrations was plotted (mean with SEM). Curve fitting was performed by nonlinear regression. (G) The linear part of velocity when 33 μM ADP was added shown as scatter plots (mean with SEM). (H) Fitted Km and Vmax values were obtained by the Michaelis–Menten equation from the replicated experiments (mean). Significant differences were obtained by one-way ANOVA with Tukey’s multiple comparisons test (vs. WT); ****p < 0.0001. (I) Predicted roles of the buried CLs within Aac2. If CLs are dissociated, the Aac2 tertiary structure is destabilized and ADP/ATP transport is compromised, which disrupts energy production via OXPHOS. In (CE), representative images from the indicated replicates are shown. Source data are available online for this figure.
Figure 6
Figure 6. Human ANT1 L141F are structurally and functionally compromised.
(A) Human ANT1 was modeled onto bovine ANT1 (PDB ID: 2C3E) using SWISS-MODEL. (BF) Flag-ANT1 and the indicated ANT1 mutants were induced by 0.25 μg/ml doxycycline in antnull T-REx-293 cells with three ANT isoforms (ANT1, 2, and 3) knocked out. (B) Expression of ANT1 was detected in whole cell extracts by immunoblot. β-actin and GRP75 were loading controls (n = 3, biological replicates). (C) ANT1 tertiary structure: 80 μg of mitochondria from WT and ANT1 mutants were mock-treated or instead incubated with either 40 μM CATR or 10 μM BKA and then solubilized with 1.5% (w/v) digitonin. The extracts were resolved by 6 to 16% blue native-PAGE and immunoblotted for Flag-ANT1 (n = 3, biological replicates). (D, E) ADP/ATP exchange: The efflux of matrix ATP was detected with isolated mitochondria as NADPH formation (A340; absorbance at 340 nm) as in Fig. 4. The measurement was performed in the presence of 5 mM malate and 5 mM pyruvate. 5 μM CATR was added to WT mitochondria prior to stimulating the efflux (n = 3, biological replicates). (D) The initial velocity following the addition of ADP at indicated concentrations was plotted (mean with SEM). Curve fitting was performed by nonlinear regression. Significant differences obtained by one-way ANOVA with Dunnett’s multiple comparisons test are shown as *, L141E; †, L141F; #, WT + CATR (vs. WT). *p < 0.05, **p < 0.01, ***p < 0.001. (E) Fitted Km and Vmax values from the Michaelis–Menten equation (mean). (F) Cellular oxygen consumption rate (OCR) was measured using a Seahorse XF96e FluxAnalyzer with the Mito Stress Test kit under indicated conditions. Basal and maximal OCR were obtained under glucose stimulation after FCCP treatment to uncouple mitochondria. ATP production-coupled respiration is defined as basal OCR subtracted by post-oligomycin OCR. Significant differences were determined by one-way ANOVA with Tukey’s multiple comparisons test (vs. WT), ***p < 0.001 ****p < 0.0001. Means with SEM (n = 16, 3 biological replicates with 4–8 technical replicates). In (B) and (C), representative images from the indicated replicates are shown. Source data are available online for this figure.
Figure 7
Figure 7. MD simulations predict reduced CL-ANT1 affinity at pocket 2 for L141 mutants.
(A, B) Time-averaged 2D density maps of CL lipids for the equilibrium prebound (A) and unbound (B) simulations. The CL binding pockets are defined by the blue (pocket 1), cyan (pocket 2), and green (pocket 3) dots, which represent the amino acids that comprise each binding site. The density surfaces were calculated using vmd volmap with 1 Å resolution. The occupancy scale bar on the right applies to all images. (C, D) Radial distribution function profile for the identification of CL lipids around residue 141 for prebound (C) and unbound (D) simulation. (E) The estimated relative free energy required to decouple CL from binding pocket 2 of ANT1 for WT and mutants L141F and L141E. Using the Wilcoxson rank-sum test between WT and L141E indicates statistical significance (p < 0.05), while the difference between WT and L141F is not significant. Mean with SEM (n = 4). Note: Binding site residues considered in the present study are based on the protein-CL lipid interactions and are the selected amino acid residues within 8 Å of the bound CL molecules: Pocket 1: 36, 53, 54, 55, 271, 272, 273, 274, 275, and 276; Pocket 2: 71, 72, 73, 74, 75, 141, 152, 155, 156, 157, and 158; Pocket 3: 251, 252, 253, 254, 255, 174, 175, 176, 177, and 178, respectively. Source data are available online for this figure.
Figure 8
Figure 8. CL binding is preserved in additional transport-defective Aac2 mutants.
(A) Schematic representation showing the positions of non-CL binding related mutations in Aac2. (B) Expression of WT and indicated FlagAac2 mutants. Kgd1 and Tom70 served as loading controls (n = 3, biological replicates). (C) Growth phenotype of Aac2 CL-binding mutants. Serial dilutions of indicated cells were spotted onto fermentable (YPD) and respiratory (YPEG) media and incubated at 30 or 37 °C for 3–5 days (n = 6, biological replicates). (DF) ADP/ATP exchange: The efflux of matrix ATP was detected as in Fig. 4. The measurement was performed in the presence of 5 mM malate and 5 mM pyruvate (n = 6, biological replicates). (D) The linear part of the initial velocity following the addition of ADP at indicated concentrations was plotted (mean with SEM). Curve fitting was performed by nonlinear regression. (E) The linear part of velocity when 33 μM ADP was added is shown as scatter plots (mean with SEM). (F) Fitted Km and Vmax values were obtained by the Michaelis–Menten equation from the replicated experiments (mean). Significant differences were obtained by one-way ANOVA with Tukey’s multiple comparisons test (vs. WT); ****p < 0.0001. (G) Native MS analysis obtained the fractional population of WT and indicated FlagAac2 mutants associated with CATR and one to three CL molecules. Mean with SEM (n = 6: 2 biological replicates with 3 technical replicates). Significant differences were obtained by one-way ANOVA with Tukey’s multiple comparisons test (* vs. FlagAac2; † vs. FlagAac2+CATR + 1CL); */† p < 0.05, **/†† p < 0.01, ***/††† p < 0.001, ****/†††† p < 0.0001. (H) Aac2 tertiary structure: 100 μg of mitochondria from WT and the indicated mutants were mock-treated or instead incubated with either 40 μM CATR and then solubilized with 1.5% (w/v) digitonin. The extracts were resolved by 6 to 16% blue native-PAGE and immunoblotted for FlagAac2 (n = 4, biological replicates). Source data are available online for this figure.
Figure EV1
Figure EV1. Aac2 CL-binding mutants do not engage in aberrant protein interactions.
Isolated mitochondria were solubilized with 1.5% digitonin and subjected to FLAG immunoprecipitation. Co-purified extracts were resolved by 10–16% SDS-PAGE and resolved proteins detected by SYPRO Ruby staining.
Figure EV2
Figure EV2. Mitochondrial respiration of Aac2 CL-binding mutants.
Related to Fig. 4D–F, basal and CCCP-stimulated respirations of WT and mutant mitochondria in the presence of NADH (A) and succinate (B) were plotted as oxygen consumption rate (OCR) (n = 21–35, 3–5 biological replicates with 5–7 technical replicates). Mean with SEM. Significant differences obtained by two-way ANOVA followed by Tukey’s multiple comparisons test are shown as * for comparison with WT and † for comparison between pockets; *p < 0.05, **p < 0.01, ***p < 0.001, ****p < 0.0001.
Figure EV3
Figure EV3. The expression of respiratory complex subunits encoded in mitochondrial DNA is attenuated in Aac2 CL-binding mutants.
(A) Mitochondrial extracts were resolved by SDS-PAGE and immunoblotted for indicated proteins, including subunits of respiratory complexes III, IV, and V. (B) The expression of indicated respiratory complex subunits was quantified. Mean with SEM. Statistical differences were analyzed by one-way ANOVA followed by Dunnett’s multiple comparison test; *p < 0.05, **p < 0.01, ***p < 0.001, ****p < 0.0001 (vs. WT). Representative images from the replicates (n = 4–8, biological replicates) are shown.
Figure EV4
Figure EV4. Activities of respiratory complexes III, IV, and V of CL-binding mutants.
(A) Complex III activity in 0.5% (w/v) DDM-solubilized mitochondria (n = 4–6, biological replicates). (B) Complex IV activity in 0.5% (w/v) DDM-solubilized mitochondria (n = 6–9, biological replicates). (C) Complex V in-gel activity assay. Mitochondria were solubilized in 1% (w/v) DDM, resolved by 5–12% blue native-PAGE, and incubated with the substrate (n = 5, biological replicates). Mean with SEM. Significant differences obtained by two-way ANOVA followed by Tukey’s multiple comparisons test are shown as * for comparison with WT and † for comparison between pockets; *p < 0.05, **p < 0.01, ***p < 0.001, ****p < 0.0001.
Figure EV5
Figure EV5. CL-binding sites are conserved across species.
Amino acid sequence alignment of yeast Aac2, bovine ANT1, and human ANT isoforms. The residues designed for the Aac2 CL-binding mutants are highlighted as indicated.

Update of

Similar articles

Cited by

References

    1. Abraham MJ, Murtola T, Schulz R, Páll S, Smith JC, Hess B, Lindahl E. GROMACS: high performance molecular simulations through multi-level parallelism from laptops to supercomputers. SoftwareX. 2015;1–2:19–25. doi: 10.1016/j.softx.2015.06.001. - DOI
    1. Acoba MG, Alpergin ESS, Renuse S, Fernández-del-Río L, Lu Y-W, Khalimonchuk O, Clarke CF, Pandey A, Wolfgang MJ, Claypool SM. The mitochondrial carrier SFXN1 is critical for complex III integrity and cellular metabolism. Cell Rep. 2021;34:108869. doi: 10.1016/j.celrep.2021.108869. - DOI - PMC - PubMed
    1. Acoba MG, Senoo N, Claypool SM. Phospholipid ebb and flow makes mitochondria go. J Cell Biol. 2020;219:e202003131. doi: 10.1083/jcb.202003131. - DOI - PMC - PubMed
    1. Aldeghi M, Heifetz A, Bodkin MJ, Knapp S, Biggin PC. Accurate calculation of the absolute free energy of binding for drug molecules. Chem Sci. 2016;7:207–218. doi: 10.1039/C5SC02678D. - DOI - PMC - PubMed
    1. Baile MG, Sathappa M, Lu Y-W, Pryce E, Whited K, McCaffery JM, Han X, Alder NN, Claypool SM. Unremodeled and remodeled cardiolipin are functionally indistinguishable in yeast. J Biol Chem. 2014;289:1768–1778. doi: 10.1074/jbc.M113.525733. - DOI - PMC - PubMed

MeSH terms

Substances

LinkOut - more resources