. 2024 Aug;43(15):3090-3115.
doi: 10.1038/s44318-024-00136-y. Epub 2024 Jun 5.

Whole-body replacement of larval myofibers generates permanent adult myofibers in zebrafish

Affiliations

Whole-body replacement of larval myofibers generates permanent adult myofibers in zebrafish

Uday Kumar et al. EMBO J. 2024 Aug.

Abstract

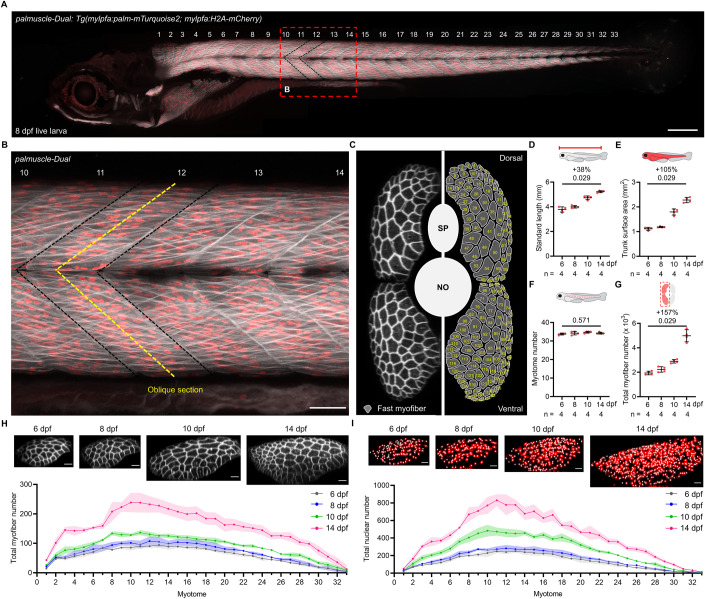
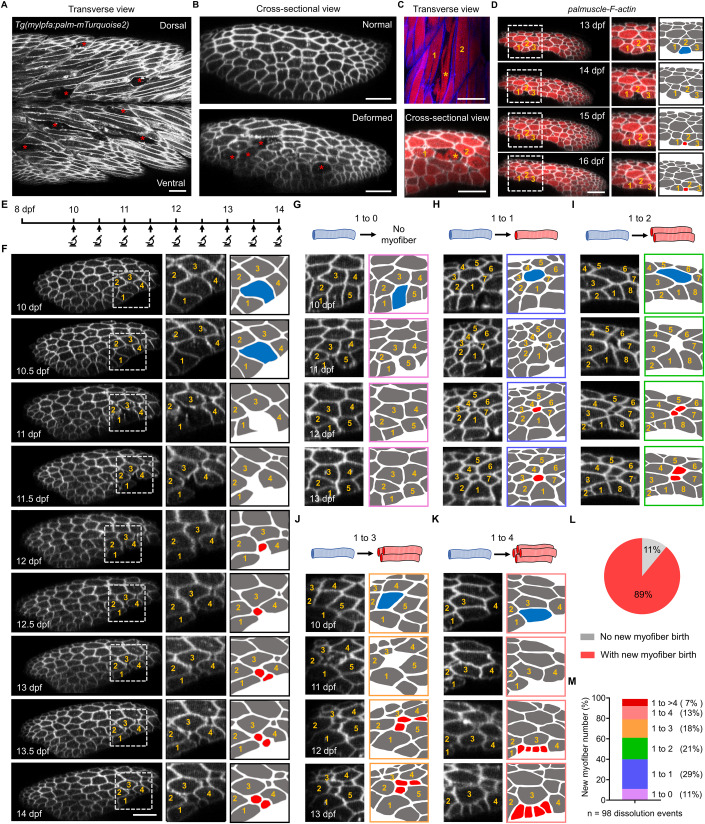
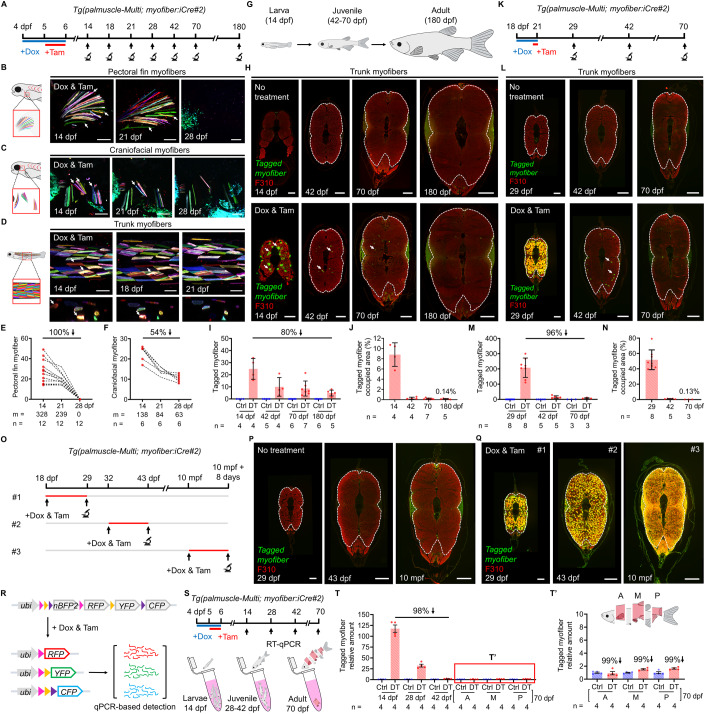
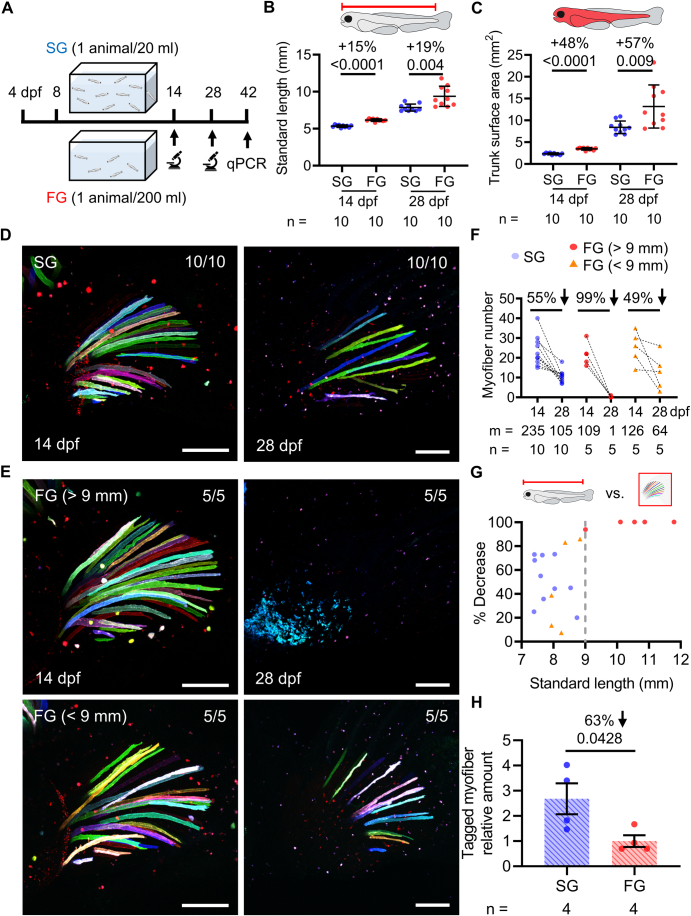
Drastic increases in myofiber number and size are essential to support vertebrate post-embryonic growth. However, the collective cellular behaviors that enable these increases have remained elusive. Here, we created the palmuscle myofiber tagging and tracking system for in toto monitoring of the growth and fates of ~5000 fast myofibers in developing zebrafish larvae. Through live tracking of individual myofibers within the same individuals over extended periods, we found that many larval myofibers readily dissolved during development, enabling the on-site addition of new and more myofibers. Remarkably, whole-body surveillance of multicolor-barcoded myofibers further unveiled a gradual yet extensive elimination of larval myofiber populations, resulting in near-total replacement by late juvenile stages. The subsequently emerging adult myofibers are not only long-lasting, but also morphologically and functionally distinct from the larval populations. Furthermore, we determined that the elimination-replacement process is dependent on and driven by the autophagy pathway. Altogether, we propose that the whole-body replacement of larval myofibers is an inherent yet previously unnoticed process driving organismic muscle growth during vertebrate post-embryonic development.

Keywords: Fast Myofiber; Live Imaging; Post-embryonic Growth; Zebrafish.


Conflict of interest statement

The authors declare no competing interests.

Figures

Figure 1
Figure 1. In toto monitoring of muscle growth in developing zebrafish.
(A) Whole-animal view of a live palmuscle-Dual zebrafish larva at 8 dpf (days post-fertilization). Every myotome is marked by a number. Black dashed lines highlight Myotome #12. (B) Magnified view of the body region indicated in (A) by a red dashed box. Yellow dashed lines mark the planes of optical sectioning used to create the displayed cross-sectional view. (C) Representative cross-sectional view of Myotome #12 (left). The schematic drawing on the right mirrors and marks every myofiber within the myotome. SP, spinal cord. NO, notochord. (DG) Larval growth as determined by standard length (D), trunk surface area (E), myotome number (F), and total myofiber number (G). (H, I) Total myofiber number and the total nuclear number in each myotome from live palmuscle-Dual at 6, 8, 10, and 14 dpf. Solid lines indicate mean and colored shadows highlight standard deviation. Representative ventral myotome images from each time point are shown above the graphs. Data from biological replicates are shown as mean ± standard deviation (DG). Significance was examined by two-tailed Mann–Whitney test. Percent differences and P values are shown above the horizontal lines for intergroup comparisons. n = number of animals (DG). Stitched image (A). Scale bars, 200 µm (A); 50 µm (B); 25 µm (H, I). dpf, days post-fertilization. Source data are available online for this figure.
Figure 2
Figure 2. Drastic increase in myofiber number and volume enables rapid organismic growth.
(A) Timeline of larval growth manipulation and tracking scheme. SG, slow growth. FG, fast growth. (B) Representative cross-sectional view of Myotome #12 under either the SG or the FG condition at 10 and 14 dpf. Yellow dashed lines mark the boundary of a myotome. (CG) Larval growth under either the SG and the FG condition as determined by standard length (C), trunk surface area (D), myotome number (E), total myofiber number (F), and myotome volume (G). (H) 3D surface rendering of all myofibers in Myotome #12. Pseudo-colored images highlighting myofiber volume were generated by Imaris. (IK) Quantitative changes in myofiber volume (I), myotome composition (J), and percentage of the hyper-nucleated myofibers (K). Data from biological replicates are shown as mean ± standard deviation (CG, K) or violin plots (solid lines, median; dashed lines, quartiles; (I). Significance was examined either by two-tailed Student’s t-test (C, D, F, G, K) or two-tailed Mann–Whitney test (E, I). Percent differences and P values are shown above the horizontal lines for intergroup comparisons. n = number of animals (CG, K) or myofibers (I, J). Scale bar, 50 µm (B). dpf, days post-fertilization. Source data are available online for this figure.
Figure 3
Figure 3. Same myofiber tracking in vivo identifies quid pro quo myofiber birth.
(A) Transverse view of the trunk region in the Tg(mylpfa:palm-mTurquoise2) line. Red asterisks mark deformed myofibers. (B) Cross-sectional view of a myotome with either ordinary myofibers (top) or deformed myofibers (bottom). Red asterisks mark deformed myofibers. (C) Transverse (top) and cross-sectional (bottom) views of normal and deformed myofibers in palmuscle-F-actin: Tg(mylpfa:palm-mTurquoise2; mylpfa:LifeAct-mScarlet), showing disorganized actin cytoskeleton in a deformed myofiber (yellow asterisk). Neighboring myofibers are labeled with respective numbers. (D) Time-lapse images of the same myotome over a 3-day period, showing a myofiber dissolution event. Magnified view of the region indicated on the left by a white dashed box (middle). Schematic drawing of the magnified region (right) highlights the deformed myofibers (blue) and the newborn myofibers (red). Neighboring myofibers are labeled with respective numbers. (E) Timeline of the tracking scheme. (F) Time-lapse images of the same myotome over a 4-day period at a 12-h interval (left). Magnified view of the region indicated on the left by a white dashed box (middle). Schematic drawing of the magnified region (right) highlights both the deformed myofibers (blue) and the newborn myofibers (red). Neighboring myofibers are labeled with respective numbers. (GK) Representative time-lapse images of the different dissolution-replacement events. The removal of a single deformed myofiber is spatiotemporally coupled with either no myofiber birth (G), or the birth of either one (H), two (I), three (J), or four myofibers (K). (L, M) All 98 captured dissolution events were categorized as being coupled with no or new myofiber birth (L), and by the number of new myofibers (M). Scale bar, 50 µm (AD, F). dpf, days post-fertilization. Source data are available online for this figure.
Figure 4
Figure 4. Multicolor barcoding of the entire myofiber population in palmuscle-Multi zebrafish.
(A) The palmuscle-Multi and myofiber:iCre#1 transgenic constructs. (B) Schematic drawing of individual myofibers before and after Cre activation. Addition of tamoxifen (Tam) activates Cre recombinase, which acts on Brainbow-based cassettes to convert label-free myofibers into color-barcoded myofibers. (C) Whole-animal view of a live palmuscle-Multi zebrafish larva at 10 dpf. (D) Magnified view of the pectoral fin, craniofacial, and trunk myofibers. (E) Representative cross-sectional view of a myotome (left). Schematic outlines of color-barcoded myofibers are shown on the right. (F) Color space analysis of 2057 individual myofibers from 32 myotomes captured from a single palmuscle-Multi. About 50 distinct hues were detected in live animals upon Cre activation. (G) The palmuscle-Multi and myofiber:iCre#2 transgenic constructs. (H) Timeline of the treatment and tracking scheme. (I) Schematic drawing of the Tg(palmuscle-Multi; myofiber:iCre#2) larva before and after Cre activation. (J) Whole-animal view of the Tg(palmuscle-Multi; myofiber:iCre#2) larva without Dox and Tam treatment. (K) The pectoral fin, craniofacial and trunk region displayed multicolor myofibers upon treatment with Dox and Tam. n = number of animals (J). Stitched image (C, D, J). Scale bars, 200 µm (C, J); 100 µm (D, K). dpf, days post-fertilization. Source data are available online for this figure.
Figure 5
Figure 5. Most larval myofibers are eliminated by adult stages.
(A) Timeline of the tracking scheme. (BD) Long-term time-lapse imaging of the same myofibers in different anatomical regions, including pectoral fin myofibers (B), craniofacial myofibers (C), and trunk myofibers (D). White arrows highlight myofibers that “disappear” from later time points. (E, F) Quantitative changes in the tagged myofiber number. Of note, the analyses include only larvae with standard length more than 9 mm at 28 dpf. (G) Schematic drawing of zebrafish at larval, juvenile and adult stages, reflecting their relative size difference. (H) Histological examinations of the tagged myofibers in the middle-trunk region of the animals at 14, 42, 70, and 180 dpf. White arrows point to remaining myofibers. White dashed line encircles the area containing fast muscle fibers (42, 70, and 180 dpf). F310 Ab stains fast myofibers. (I, J) Quantitative analysis of tagged myofiber number (I), and percent area occupied by the tagged myofibers (J). The tagged myofiber numbers from two to three consecutive cross-sections were counted and averaged for each individual. (K) Timeline of the tracking scheme. (L) Histological examinations of the tagged myofibers in the middle-trunk region of the animals at 29, 42, and 70 dpf. White arrows point to remaining myofibers at 42 dpf. White dashed line encircles the area containing fast muscle fibers. F310 Ab stains fast myofibers. (M, N) Quantitative analysis of tagged myofiber number (M), and percent area occupied by the tagged myofibers (N). The tagged myofiber numbers from two to four consecutive cross-sections were counted and averaged for each individual. (O) Timeline of the treatment and tracking scheme. (P, Q) Histological examinations of the tagged myofibers in the middle-trunk region of the animals at 29, 43 dpf, and 10 mpf showed no leaky Cre activity (P). A short pulse of Dox and Tam labeled most of the trunk fast myofibers (Q). White dashed line encircles the area containing fast muscle fibers. Number of animals examined—8, 6, 4 (29 dpf, 43 dpf, 10 mpf, P); 8, 5, 3 (29 dpf, 43 dpf, 10 mpf, Q). F310 Ab stains fast myofibers. (R) Schematic drawing of the palmuscle-Multi cassettes before and after Cre activation. qPCR primers were designed to detect transcripts from the recombined Brainbow cassettes, targeting the common sequences of mCherry, mYFP, and mCerulean. (S) Timeline of the sampling scheme. (T, T’) RT-qPCR analysis of the whole-animal myofiber loss at 14, 28, 42 and 70 dpf (T), and an enlarged view of the 70 dpf data (T’). Of note, three separate body compartments—Anterior (A), Middle (M), and Posterior (P)—were collected at 70 dpf, owing to the substantial size of the fish at this stage. Data from biological replicates are shown as mean ± standard deviation (I, J, M, N) or mean ± standard error (T, T’). m = myofibers (E, F). n = number of animals (E, F, I, J, M, N) or biological repeats (T, T’). Stitched image (H, L, P, Q). Scale bar, 100 µm (BD); 100 µm (H, 14 dpf) and (L, P, Q, 29 dpf); 300 µm (H, L, 42 dpf; P, Q, 43 dpf); 500 µm (H, L, 70 and 180 dpf; P, Q, 10 mpf). dpf, days post-fertilization. mpf, months post-fertilization. Source data are available online for this figure.
Figure 6
Figure 6. Larval myofibers are distinct from their adult counterparts.
(A) Illustrations of zebrafish at larval, juvenile and adult stages reflect relative size differences; dissociated myofibers were subjected to imaging analysis. (B) Representative confocal images of dissociated myofibers collected from palmuscle-Dual at 14 dpf, 70 dpf, and 1.7 years of age. (CE) Quantification of myofiber length (C), volume (D), and total nuclear number within each myofiber (E). (F) Real-time monitoring of oxygen consumption rate (OCR; percentage) from freshly dissociated larval and adult myofibers. Mitochondrial stress modulators: oligomycin (oligo), FCCP, and antimycin A/rotenone (AA/Rot). Solid lines indicate mean and colored shadows highlight standard error. (G, H) Quantitative changes in spare respiratory capacity (SRC; percentage) and extracellular acidification rate (ECAR; percentage). (I) Timeline of the treatment and tracking schemes. (J) Histological examinations of the tagged myofibers in the middle-trunk region of animals at 10 and 16 mpf. White dashed line encircles the area containing fast muscle fibers. Of note, Tg(myofiber:iCre#2) labeled both fast and slow myofiber populations at adult stages. White asterisks highlight the slow myofiber domains. F310 Ab stains fast myofibers. (K, L) Quantification of tagged myofiber number (K) and percent area occupied by the tagged myofibers (L). The tagged myofiber numbers from three consecutive cross-sections were counted and averaged for each individual. Of note, comparisons were made between animals with at least 10% of the labeled area per cross-section. Data from biological replicates are shown as violin plots (solid lines, median; dashed lines, quartiles; CE), mean ± standard error (G, H) and mean ± standard deviation (K, L). Significance was examined by Kruskal–Wallis test with Dunnett’s correction (CE); two-tailed Student’s t-test (G, H) or two-tailed Mann–Whitney test (K). Percent differences and P values are shown above the horizontal lines for intergroup comparisons. n = number of myofibers (CE) or animals (K, L). Stitched image (B, J). Scale bars, 100 µm (B); 1 mm (J). dpf, days post-fertilization. mpf, months post-fertilization. Source data are available online for this figure.
Figure 7
Figure 7. Autophagic cell death eliminates larval myofibers to promote local myofiber birth.
(A) The transgenic construct for live monitoring of apoptotic responses in the myofibers. (B) Treatment with cycloheximide activates apoptosis in the myofibers. White arrow points to an EGFP-positive myofiber. (C) Deformed myofibers show no EGFP signals. White arrow points to a deformed myofiber. (D) Quantification of the EGFP-positive myofibers either in the normal or the deformed populations. (E) The application of LysoTracker red for detecting autophagic activation in the myofibers. (F) Deformed myofibers contain the LysoTracker red signals. White arrow points to a deformed myofiber. (G) Quantification of the LysoTracker red-positive myofibers either in the normal or the deformed populations. (H) Timeline of the treatment and tracking schemes. (I) Treatment of chloroquine (CQ) attenuates myofiber elimination. White arrows point to persisting myofibers. (J, K) Standard length of the animals (J) and quantitative evaluation of tagged myofiber number (K). Since animal growth rates can affect the myofiber elimination, the analyses only include larvae with standard length more than 9 mm at 28 dpf. (L, M) CRISPR-Cas9-mediated deletion of the atg7 locus and evaluation of the deletion alleles by PCR amplification of genomic DNA (L) and Sanger sequencing (M). The sgRNA pair removes the ~36 kb genomic region between Exon 1 and Exon 19. (N) RT-qPCR analysis of CRISPR-Cas9-mediated knockdown of the atg7 expression. (O) Timeline of the treatment and tracking schemes. (P) Pectoral fin myofibers images from 14 dpf larvae injected with either control sgRNAs or atg7-targeting sgRNAs. White arrows point to persisting myofibers. (Q, R) Standard lengths of the animals (Q). Quantitative evaluation of tagged myofiber number (R). Of note, animals injected with sgRNAs targeting atg7 exhibited reduced growth by 28 dpf. (S) The transgenic constructs for inducible overexpression of ATG7. (T) Timeline of the Dox treatment and tracking schemes. (U) Time-lapse images of the same myotome over a 6-day period with overexpression of either EGFP (left) or EGFP/ATG7 (right). The EGFP and EGFP/ATG7-positive myofibers are marked with respective numbers. Orange dashed line highlights a myofiber cluster. (V) Quantification of the myofiber number within each cluster. Of note, concurrent births of five or more than five adjacent myofibers were defined as a myofiber cluster. OX, overexpression. (W) Quantitative myofiber cluster appearance in the EGFP- and EGFP/ATG7-overexpression groups. (X) Schematic drawing depicts the process of whole-body replacement of larval myofibers. Data from biological replicates are shown as mean ± standard deviation (J, Q, V) or mean ± standard error (N). Significance was examined by two-tailed Mann–Whitney test (J, Q) or two-tailed Student’s t-test (N). Percent differences and P values are shown above the horizontal lines for intergroup comparisons. m = number of myofibers (K, R). n = number of animals (J, K, Q, R), myofibers (D, G), clusters (V), or myotomes (W). Scale bar, 50 µm (B, C, F, U); 100 µm (I, P). dpf, days post-fertilization. Source data are available online for this figure.
Figure EV1
Figure EV1. Myofiber volume scales linearly with myofiber nuclear number regardless of the growth conditions.
(A) Schematic highlights the fast myofiber compartment. SP, spinal cord. NO, notochord. BV, blood vessels. I, intestine. (B) Histological examination of the labeled myofibers in the Tg(mylpfa:palm-mTurquoise2) transgenic line (left). White dashed box outlines the magnified region shown to the right. F310 Ab stains fast myofibers. (C) Schematic highlights the slow myofiber compartment. (D) Histological examination of the labeled myofibers in the palmuscle-Dual: Tg(mylpfa:palm-mTurquoise2; mylpfa:H2A-mCherry) double transgenic line (left). White dashed box marks the magnified region shown to the right. Orange dashed lines outline the entire trunk compartment. F59 Ab stains slow myofibers. White arrows point to slow myofibers. White asterisks mark the fast myofiber nuclei. (E, F) Linear regression coefficients analyses of myofiber number versus nuclear number across all 32 myotomes in individual animals at 10 dpf (E) and 14 dpf (F). (G) Timeline of the growth manipulation and tracking scheme. Representative images of fish grown under either slow growth (SG; 1 animal in 20 ml) or fast growth (FG; 1 animal in 200 ml) conditions at 14 dpf. White arrows point to the emergence of swim bladder, median fin fold, and caudal fin structures under the FG condition. White dashed lines mark the fin fold region. (HM) Quantification of anatomical traits under SG and FG: Standard length, SL (H); Snout-operculum length (I); Snout-vent length (J); Height at nape (K); Height at anterior of anal fin, HAA (L) and Eye diameter (M). (N) A cross-sectional image of a myotome, individual myofibers are depicted in pseudocolor by Cellpose. (OR) Quantitation of the myofiber cross-sectional area in either the dorsal or ventral compartment of Myotome #12 at 10 dpf (O, P) and 14 dpf (Q, R). (S) Quantification of individual myofiber volume at 10 dpf under either slow growth (SG) or fast growth (FG) conditions. (T) Linear regression coefficients were calculated for myofiber volume versus nuclear number (10 dpf). (U) Quantification of the individual myofiber volume at 14 dpf under either the SG or the FG conditions. (V) Linear regression coefficients were calculated for myofiber volume versus nuclear number (14 dpf). Data from biological replicates are shown as mean ± standard deviation (HM, S, U) or violin plots (solid lines, median; dashed lines, quartiles; OR). Significance was examined by examined by two-tailed Student’s t-test (HL) or two-tailed Mann–Whitney test (M, OR). P values are shown above the horizontal lines for intergroup comparisons. n = number of animals (HM, OR) and m = number of myofibers (OS, U). Four animals (E, F) and ten animals (S, U) were used in each condition. Scale bars, 50 µm (B, D); 1 mm (G).
Figure EV2
Figure EV2. Individual deformed myofibers are fully eliminated and replaced.
(AC) Time-lapse images of the same myotome over a 3-day period, showing the myofiber elimination and the replacement processes in a cross-sectional view (A) or as a 3D rendering (B, C). Blue dashed lines outline a deformed myofiber. Red dashed lines outline newborn myofibers. Neighboring myofibers are labeled with respective numbers. (D) Spatial distribution of deformed myofibers in the dorsal and ventral myotomes. A total of 98 dissolution events were captured and mapped. (E) Representative image of pax7b-positive muscle stem cells expressing mCherry. (F) Representative image showing pax7b-positive cells (yellow arrows) in close proximity to a deformed myofiber. (G) Cross-sectional view of a myotome showing pax7b-positive cells located either at the myotome’s periphery (white arrows) or within the interstitial space (yellow arrows). (H, I) Quantification of myofiber composition within a myotome (H) and the interstitial pax7b-positive cells closely associated with either normal or deformed myofibers (I). Data from biological replicates are shown as mean ± standard deviation (H, I). n = number of myotome (H) or cells (I). Scale bar, 50 µm (A, EG).
Figure EV3
Figure EV3. Pre-existing pectoral fin myofibers are eliminated and replaced by a de novo source.
(A) The palmuscle-Multi and the myofiber:iCre#2 transgenic constructs. (B) Timeline of the tracking scheme. (C, D) Long-term tracking of the Tg(palmuscle-Multi; myofiber:iCre#2) double transgenic line in different anatomical regions, including the pectoral fin region (C) and the craniofacial region (D). No leaky Cre activity was observed. (E) The mylpfa:Brainbow1.0L and myofiber:iCre#2 transgenic constructs. (F) Timeline of the treatment and tracking scheme. (G) Long-term tracking of the Tg(mylpfa:Brainbow1.0L; myofiber:iCre#2) double transgenic line showed no leaky Cre activity. (H) Long-term time-lapse imaging of the same myofibers at 14, 21, and 28 dpf. White arrows highlight “disappearing myofibers”. White dashed lines (bottom right, G and H) outline the bottom pectoral fin myofiber compartment, which becomes less visible at 28 dpf due to tissue thickening. (I) Quantification of tagged myofiber numbers. (J) Cross-sectional view of the pectoral fin myofibers showing both top and bottom layers at 14, 21 and 28 dpf. (K, L) Quantification of myofiber numbers (K) and myofiber areas (L). The entire top layer of fin myofibers were included in the quantification. Data from biological replicates are shown as mean ± standard deviation (K) or violin plots (solid lines, median; dashed lines, quartiles; L). Significance was examined by two-tailed Student’s t-test (K) or two-tailed Mann–Whitney test (L). Percent differences and P values are shown above the horizontal lines for intergroup comparisons. n = number of animals (C, D, G, H, K) or myofibers (I, L). Scale bars, 50 µm (J) and 100 µm (C, D, G, H). dpf, days post-fertilization.
Figure EV4
Figure EV4. Rapid growth condition promotes myofiber elimination.
(A) Timeline of larval growth manipulation and tracking scheme. SG, slow growth. FG, fast growth. (B, C) Larval growth under the SG and FG conditions as determined by standard length (B), and trunk surface area (C). (D, E) Long-term tracking of the Tg(palmuscle-Multi; myofiber:iCre#2) double transgenic line under SG (D) and FG (E) conditions. (F, G) Quantification of tagged myofiber numbers (F) and decreases in percentage (G). Gray dashed line highlights the standard length of 9 mm. (H) RT-qPCR analysis of whole-animal myofiber loss at 42 dpf under either SG or FG conditions. Data from biological replicates are shown as mean ± standard deviation (B, C) and mean ± standard error (H). Significance was examined by two-tailed Student’s t-test. Percent differences and P values are shown above the horizontal lines for intergroup comparisons. n = number of animals (BF) or biological replicates (H). m = number of myofibers (F). Scale bar, 100 µm (D, E). dpf, days post-fertilization.
Figure EV5
Figure EV5. Larval myofibers are functionally distinct from adult myofibers.
(A) Illustration of zebrafish at larval and adult stages, reflecting their relative size differences. (B, C) RT-qPCR analyses of expression of the intermediate filament desma (B), and sarcomere myosin myhc4 (C) in whole animals (14 dpf) or dissected muscle tissues (1.7 years of age). (D) Cross-sectional image of the middle-trunk region of the animal at 16 mpf with tagged myofibers. F310 Ab stains fast myofibers. (E) Magnified view of the trunk region indicated in (D) by red dashed box. (F) Individual tagged myofibers from cross-sectional images shown in pseudocolor (left) and with respective ROI numbers (right). (G) Timeline of the treatment and tracking scheme. (H) Schematic drawing of the progressive shift in hyperplastic growth zone across different developmental stages. (IK) Histological examinations of the tagged myofibers in the middle-trunk region from larvae to adult stage, showing growth zone shift from the periphery at 29 dpf (I), to the interstitial space at 43 dpf (J), and ultimately to the deep region of the myotome at 16 mpf (K). White dashed boxes outline the magnified regions shown to the right of each panel. F310 Ab stains fast myofibers. Data from biological replicates are shown as mean ± standard error (B, C). Significance was examined by two-tailed Student’s t-test. Percent differences and P values are shown above the horizontal lines for intergroup comparisons. n = the number of biological replicates. Scale bars, 1 mm (D); 200 µm (E, I); 300 µm (J); 500 µm (K). dpf, days post-fertilization; mpf, months post-fertilization.
Figure EV6
Figure EV6. Live monitoring of autophagic activation in deformed myofibers.
(A) The transgenic construct for live monitoring of autophagic activation in myofibers. (B) Treatment with rapamycin activates autophagic response in myofibers. White arrows point to activated, mCherry-positive myofibers. Of note, without the treatment of rapamycin, all 6 dpf myofibers were both EGFP- and mCherry-positive. (C) Deformed myofibers contain abundant red puncta. White arrow points to a deformed myofiber. (D) Percentages of red and yellow puncta in three individual deformed myofibers. (E, F) RT-qPCR was performed to analyze expression of the autophagic genes atg5 (E) and atg7 (F) in whole animals (14 dpf) or dissociated myofibers (70 dpf and 1.7 years of age). (G) Timeline and three different thyroxine hormone (T4) treatment schemes. (HJ) RT-qPCR analysis of the whole-animal myofiber loss for each of the schemes. Data from biological replicates are shown as mean ± standard error (E, F, H, I, J). Significance was examined by two-tailed Student’s t-test. Percent differences and P values are shown above the horizontal lines for intergroup comparisons. n = number of puncta (D) or biological replicates (E, F, H, I, J). Scale bars, 100 µm (B); 50 µm (C). dpf, days post-fertilization.

Similar articles

Cited by

References

    1. Abmayr SM, Pavlath GK (2012) Myoblast fusion: lessons from flies and mice. Development 139:641–656 - PMC - PubMed
    1. Allen EA, Baehrecke EH (2020) Autophagy in animal development. Cell Death Differ 27:903–918 - PMC - PubMed
    1. Berberoglu MA, Gallagher TL, Morrow ZT, Talbot JC, Hromowyk KJ, Tenente IM, Langenau DM, Amacher SL (2017) Satellite-like cells contribute to pax7-dependent skeletal muscle repair in adult zebrafish. Dev Biol 424:162–180 - PMC - PubMed
    1. Berry DL, Baehrecke EH (2007) Growth arrest and autophagy are required for salivary gland cell degradation in Drosophila. Cell 131:1137–1148 - PMC - PubMed
    1. Bindels DS, Haarbosch L, van Weeren L, Postma M, Wiese KE, Mastop M, Aumonier S, Gotthard G, Royant A, Hink MA, Gadella Jr TW (2017) mScarlet: a bright monomeric red fluorescent protein for cellular imaging. Nat Methods 14:53–56 - PubMed

LinkOut - more resources