

Consistent cord blood DNA methylation signatures of gestational age between South Asian and white European cohorts
- PMID: 38840168
- PMCID: PMC11155053
- DOI: 10.1186/s13148-024-01684-0
Consistent cord blood DNA methylation signatures of gestational age between South Asian and white European cohorts
Abstract
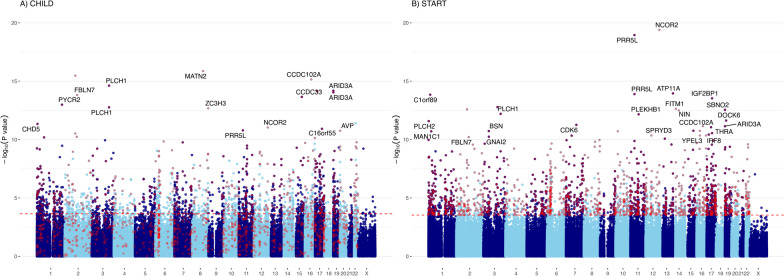
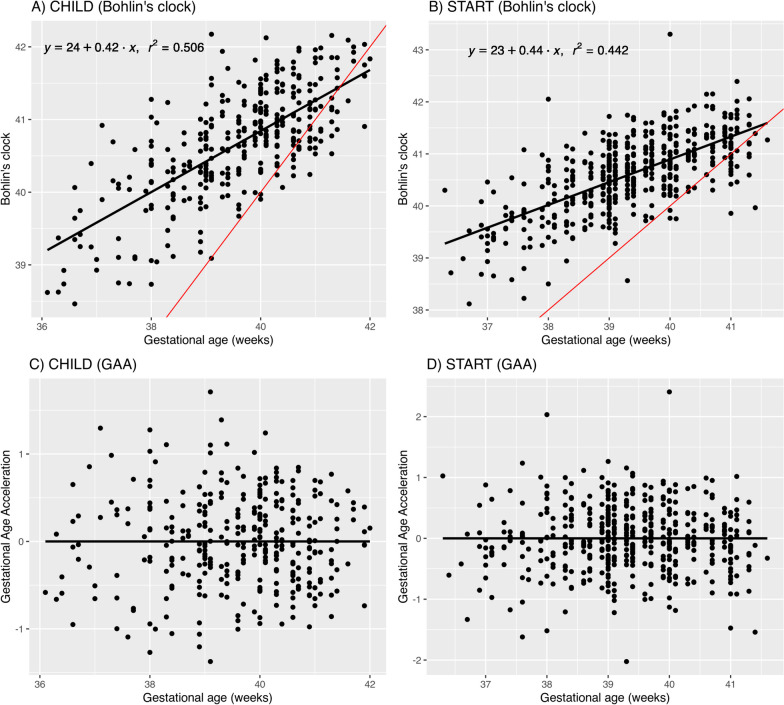
Background: Epigenetic modifications, particularly DNA methylation (DNAm) in cord blood, are an important biological marker of how external exposures during gestation can influence the in-utero environment and subsequent offspring development. Despite the recognized importance of DNAm during gestation, comparative studies to determine the consistency of these epigenetic signals across different ethnic groups are largely absent. To address this gap, we first performed epigenome-wide association studies (EWAS) of gestational age (GA) using newborn cord blood DNAm comparatively in a white European (n = 342) and a South Asian (n = 490) birth cohort living in Canada. Then, we capitalized on established cord blood epigenetic GA clocks to examine the associations between maternal exposures, offspring characteristics and epigenetic GA, as well as GA acceleration, defined as the residual difference between epigenetic and chronological GA at birth.
Results: Individual EWASs confirmed 1,211 and 1,543 differentially methylated CpGs previously reported to be associated with GA, in white European and South Asian cohorts, respectively, with a similar distribution of effects. We confirmed that Bohlin's cord blood GA clock was robustly correlated with GA in white Europeans (r = 0.71; p = 6.0 × 10-54) and South Asians (r = 0.66; p = 6.9 × 10-64). In both cohorts, Bohlin's clock was positively associated with newborn weight and length and negatively associated with parity, newborn female sex, and gestational diabetes. Exclusive to South Asians, the GA clock was positively associated with the newborn ponderal index, while pre-pregnancy weight and gestational weight gain were strongly predictive of increased epigenetic GA in white Europeans. Important predictors of GA acceleration included gestational diabetes mellitus, newborn sex, and parity in both cohorts.
Conclusions: These results demonstrate the consistent DNAm signatures of GA and the utility of Bohlin's GA clock across the two populations. Although the overall pattern of DNAm is similar, its connections with the mother's environment and the baby's anthropometrics can differ between the two groups. Further research is needed to understand these unique relationships.
Keywords: Accelerated gestational age; Cord blood DNA methylation; Epigenetic gestational age; Gestational age at birth.
© 2024. The Author(s).
Conflict of interest statement
The authors declare that they have no competing interests.
Figures
References
MeSH terms
Grants and funding
LinkOut - more resources
Full Text Sources
Miscellaneous
