. 2024 Jun 5;21(1):94.
doi: 10.1186/s12984-024-01390-1.

Evaluation of walking activity and gait to identify physical and mental fatigue in neurodegenerative and immune disorders: preliminary insights from the IDEA-FAST feasibility study

Affiliations

Evaluation of walking activity and gait to identify physical and mental fatigue in neurodegenerative and immune disorders: preliminary insights from the IDEA-FAST feasibility study

Chloe Hinchliffe et al. J Neuroeng Rehabil. .

Abstract

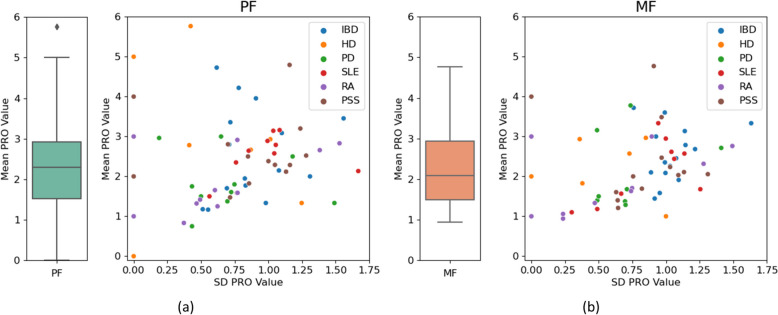
Background: Many individuals with neurodegenerative (NDD) and immune-mediated inflammatory disorders (IMID) experience debilitating fatigue. Currently, assessments of fatigue rely on patient reported outcomes (PROs), which are subjective and prone to recall biases. Wearable devices, however, provide objective and reliable estimates of gait, an essential component of health, and may present objective evidence of fatigue. This study explored the relationships between gait characteristics derived from an inertial measurement unit (IMU) and patient-reported fatigue in the IDEA-FAST feasibility study.

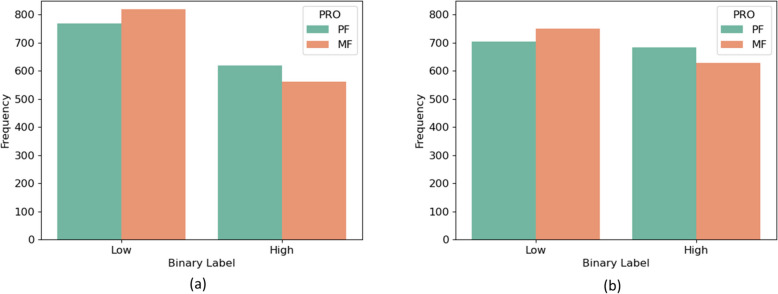
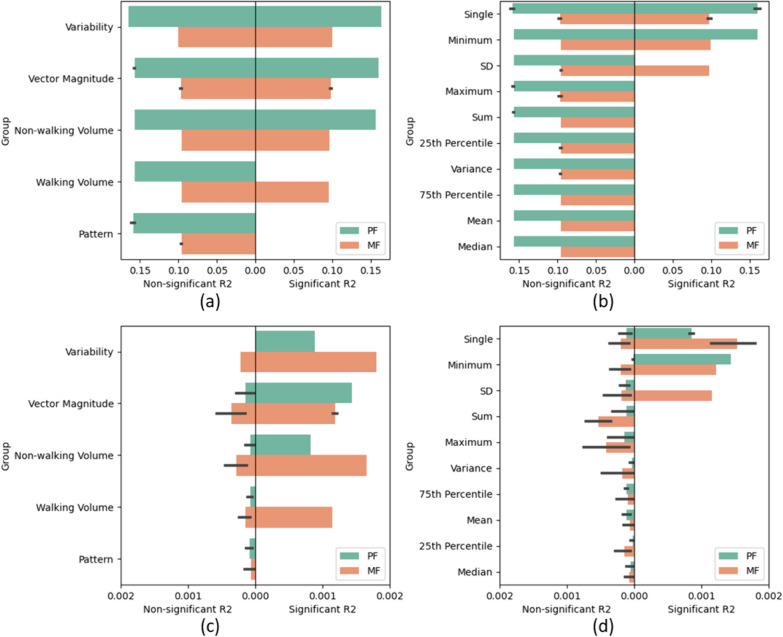
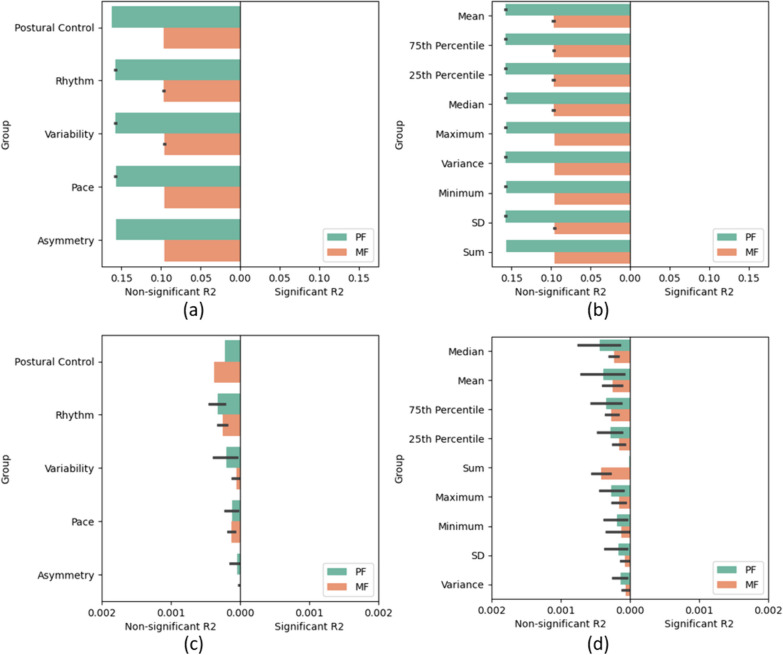
Methods: Participants with IMIDs and NDDs (Parkinson's disease (PD), Huntington's disease (HD), rheumatoid arthritis (RA), systemic lupus erythematosus (SLE), primary Sjogren's syndrome (PSS), and inflammatory bowel disease (IBD)) wore a lower-back IMU continuously for up to 10 days at home. Concurrently, participants completed PROs (physical fatigue (PF) and mental fatigue (MF)) up to four times a day. Macro (volume, variability, pattern, and acceleration vector magnitude) and micro (pace, rhythm, variability, asymmetry, and postural control) gait characteristics were extracted from the accelerometer data. The associations of these measures with the PROs were evaluated using a generalised linear mixed-effects model (GLMM) and binary classification with machine learning.

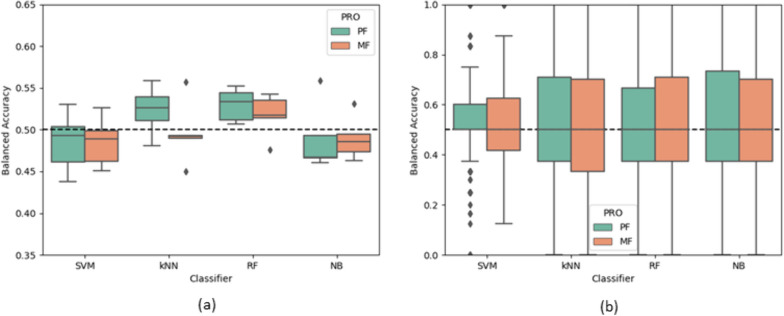
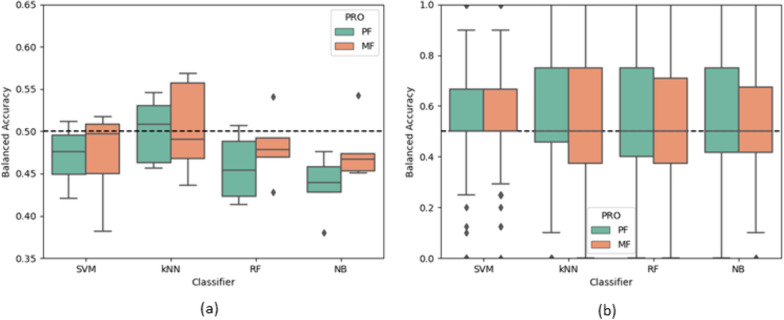
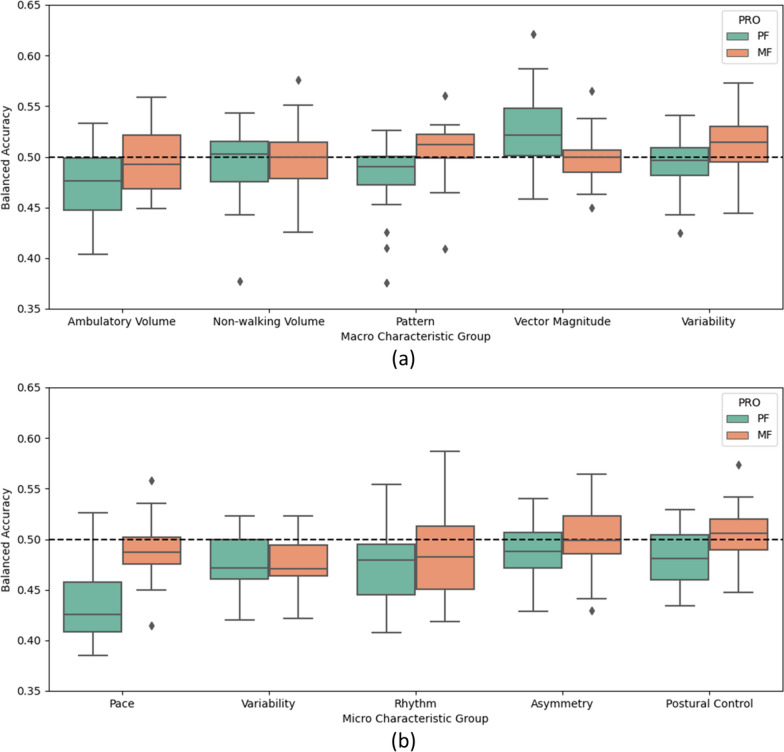
Results: Data were recorded from 72 participants: PD = 13, HD = 9, RA = 12, SLE = 9, PSS = 14, IBD = 15. For the GLMM, the variability of the non-walking bouts length (in seconds) with PF returned the highest conditional R2, 0.165, and with MF the highest marginal R2, 0.0018. For the machine learning classifiers, the highest accuracy of the current analysis was returned by the micro gait characteristics with an intrasubject cross validation method and MF as 56.90% (precision = 43.9%, recall = 51.4%). Overall, the acceleration vector magnitude, bout length variation, postural control, and gait rhythm were the most interesting characteristics for future analysis.

Conclusions: Counterintuitively, the outcomes indicate that there is a weak relationship between typical gait measures and abnormal fatigue. However, factors such as the COVID-19 pandemic may have impacted gait behaviours. Therefore, further investigations with a larger cohort are required to fully understand the relationship between gait and abnormal fatigue.

Trial registration: ClinicalTrials.gov DRKS00021693.

Keywords: Digital health; Fatigue; Machine learning; Real-world gait; Walking; Wearable devices.


Conflict of interest statement

S. Del Din reports consultancy activity with Hoffmann-La Roche Ltd. outside of this study. N. V. Manyakov, R. Z. U. Rehman and M. Chatterjee employees of Janssen Research & Development and may hold company stocks/stock options.

Figures

Fig. 1
Fig. 1
Summaries of the PRO scores (excluding healthy). a shows physical fatigue and b shows mental fatigue. Left: Box plots of the participants’ mean PRO scores. Right: Scatter plots of the mean against the SD for each participant’s PRO scores, colour represents cohort. Box plots show the median, interquartile range, 1.5 × interquartile range, and outliers of the data. PRO Patient reported outcome, PF Physical fatigue, MF Mental fatigue, SD Standard deviation
Fig. 2
Fig. 2
The number of low and high fatigue samples in each class (excluding healthy). a Binarisation threshold was two (intersubject method). b Binarisation threshold was the mean PRO value of each subject (intrasubject method). PRO Patient reported outcome, PF Physical fatigue, MF Mental fatigue
Fig. 3
Fig. 3
Bar plots of the R2 values from the GLMM of the macro characteristics with non-significant associations on the left and statistically significant associations on the right (p < 0.05). a, b show the conditional R2 and c, d show the marginal R2. a, c Gait characteristic group rank averaged across the statistical measures. b, d Statistic rank averaged across the gait characteristic groups. Features are ranked from highest to lowest mean R2 across the significant and insignificant measures, double weighted to the significant measures. Error bars show the 95% confidence interval. PRO Patient reported outcome, PF Physical fatigue, MF Mental fatigue, SD Standard deviation, GLMM Generalised linear mixed effects model
Fig. 4
Fig. 4
Bar plots of the R2 values from the GLMM of the micro characteristics with non-significant associations on the left and statistically significant associations on the right (p < 0.05). a, b show the conditional R2 and c, d show the marginal R2. a, c Gait characteristic group rank averaged across the statistical measures. b, d Statistic rank averaged across the gait characteristic groups. Features are ranked from highest to lowest mean R2 across the significant and insignificant measures, double weighted to the significant measures. Error bars show the 95% confidence interval. PRO Patient reported outcome, PF Physical fatigue, MF Mental fatigue, SD Standard deviation, GLMM Generalised linear mixed effects model
Fig. 5
Fig. 5
Boxplots of the balanced accuracies of the classifiers for all folds with the gait macro characteristics. a Cross validation across the subjects (Intersubject method). b Cross validation within each individual subject (Intrasubject method). The dashed line represents random chance (50%). PRO Patient reported outcome; PF Physical fatigue, MF Mental fatigue, SVM Support vector machine, kNN k-nearest neighbours, RF Random Forest, NB Naïve Bayesian
Fig. 6
Fig. 6
Boxplots of the balanced accuracies of the classifiers for all folds with the gait micro characteristics. a Cross validation across the subjects (Intersubject method). b Cross validation within each individual subject (Intrasubject method). The dashed line represents random chance (50%). PRO Patient reported outcome, PF Physical fatigue; MF Mental fatigue, SVM Support vector machine, kNN k-nearest neighbours, RF Random Forest, NB Naïve Bayesian
Fig. 7
Fig. 7
Boxplots of the balanced accuracies of the classifiers for all folds with each individual gait micro characteristic group and the intersubject method, across each fold and classifier. The dashed line represents random chance (50%). a Macro gait characteristics. b Micro gait characteristics. PRO Patient reported outcome, PF Physical fatigue, MF Mental fatigue

References

    1. Tench CM, McCurdie I, White PD, D’Cruz DP. The prevalence and associations of fatigue in systemic lupus erythematosus. Rheumatology (Oxford) 2000;39(11):1249–1254. doi: 10.1093/rheumatology/39.11.1249. - DOI - PubMed
    1. Dima A, Caraiola S, Delcea C, Ionescu RA, Jurcut C, Badea C. Self-reported disease severity in women with systemic lupus erythematosus. Rheumatol Int. 2019;39(3):533–539. doi: 10.1007/s00296-018-4203-1. - DOI - PubMed
    1. Friedman JH, Brown RG, Comella C, Garber CE, Krupp LB, Lou JS, et al. Fatigue in Parkinson’s disease: a review. Mov Disord. 2007;22(3):297–308. doi: 10.1002/mds.21240. - DOI - PubMed
    1. Segal B, Thomas W, Rogers T, Leon JM, Hughes P, Patel D, et al. Prevalence, severity, and predictors of fatigue in subjects with primary Sjögren’s syndrome. Arthritis Rheum. 2008;59(12):1780–1787. doi: 10.1002/art.24311. - DOI - PMC - PubMed
    1. Wolfe F, Hawley DJ, Wilson K. The prevalence and meaning of fatigue in rheumatic disease. J Rheumatol. 1996;23(8):1407–1417. - PubMed

Publication types

MeSH terms

Associated data