

Sex-dependent effects of carbohydrate source and quantity on caspase-1 activity in the mouse central nervous system
- PMID: 38840215
- PMCID: PMC11155082
- DOI: 10.1186/s12974-024-03140-5
Sex-dependent effects of carbohydrate source and quantity on caspase-1 activity in the mouse central nervous system
Abstract
Background: Mounting evidence links glucose intolerance and diabetes as aspects of metabolic dysregulation that are associated with an increased risk of developing dementia. Inflammation and inflammasome activation have emerged as a potential link between these disparate pathologies. As diet is a key factor in both the development of metabolic disorders and inflammation, we hypothesize that long term changes in dietary factors can influence nervous system function by regulating inflammasome activity and that this phenotype would be sex-dependent, as sex hormones are known to regulate metabolism and immune processes.
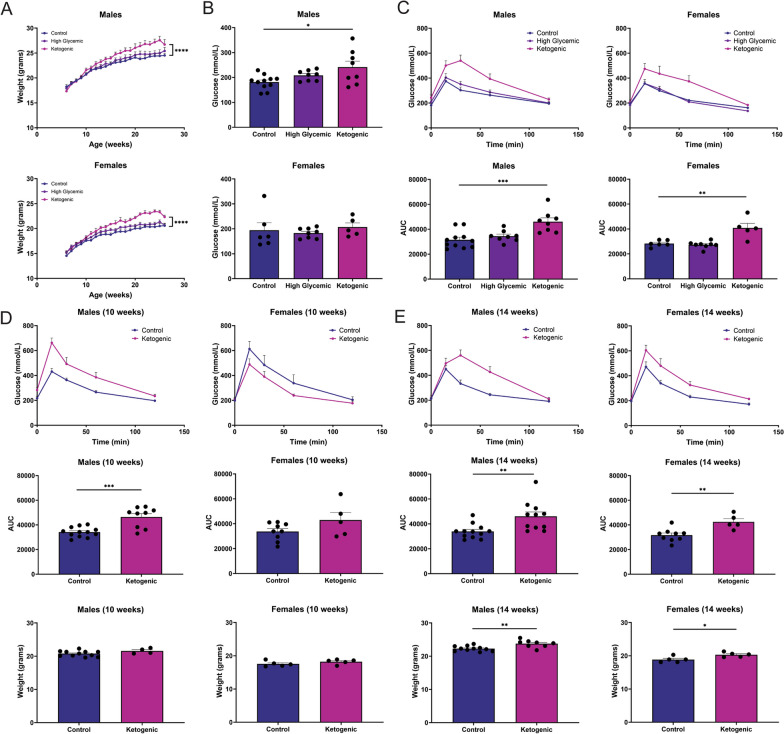
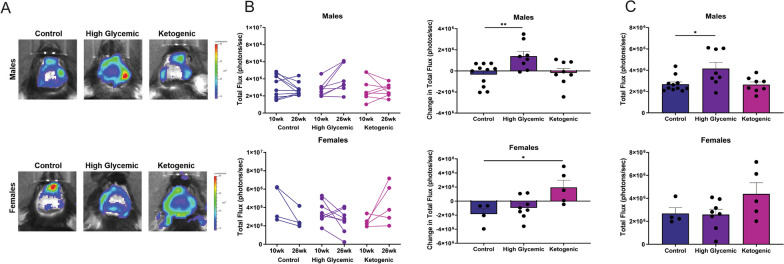
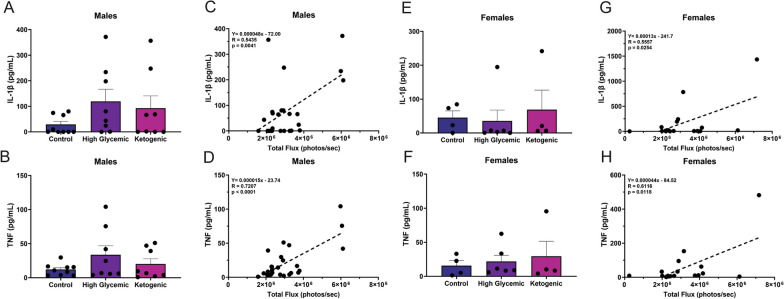
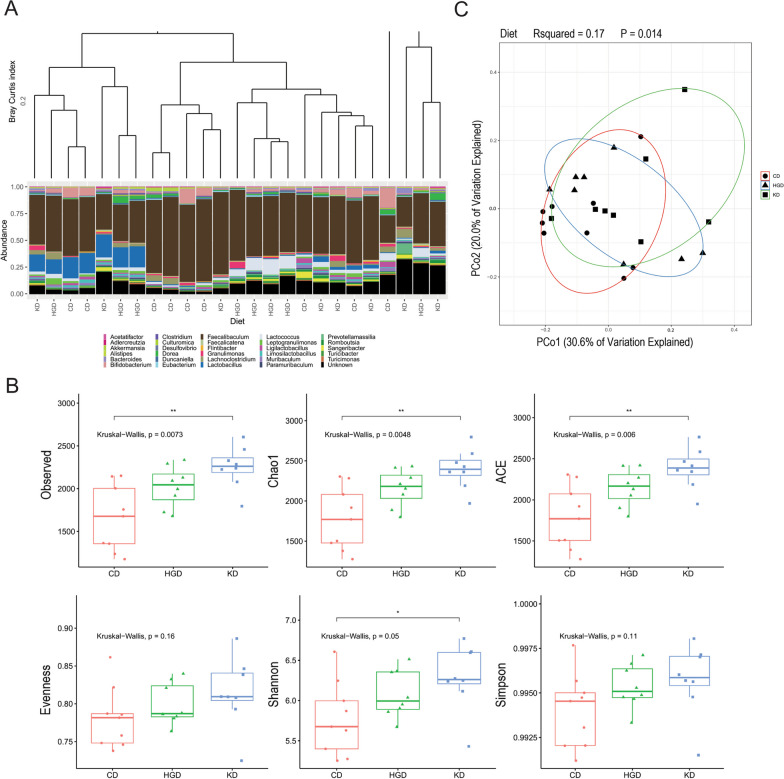
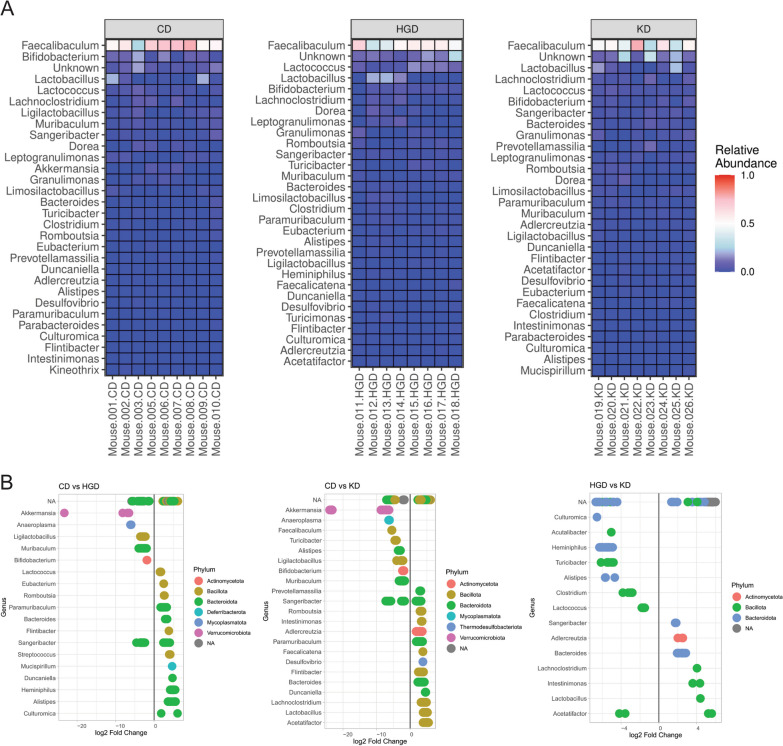
Methods: 5-week-old male and female transgenic mice expressing a caspase-1 bioluminescent reporter underwent cranial window surgeries and were fed control (65% complex carbohydrates, 15% fat), high glycemic index (65% carbohydrates from sucrose, 15% fat), or ketogenic (1% complex carbohydrates, 79% fat) diet from 6 to 26 weeks of age. Glucose regulation was assessed with a glucose tolerance test following a 4-h morning fast. Bioluminescence in the brain was quantified using IVIS in vivo imaging. Blood cytokine levels were measured using cytokine bead array. 16S ribosomal RNA gene amplicon sequencing of mouse feces was performed to assess alterations in the gut microbiome. Behavior associated with these dietary changes was also evaluated.
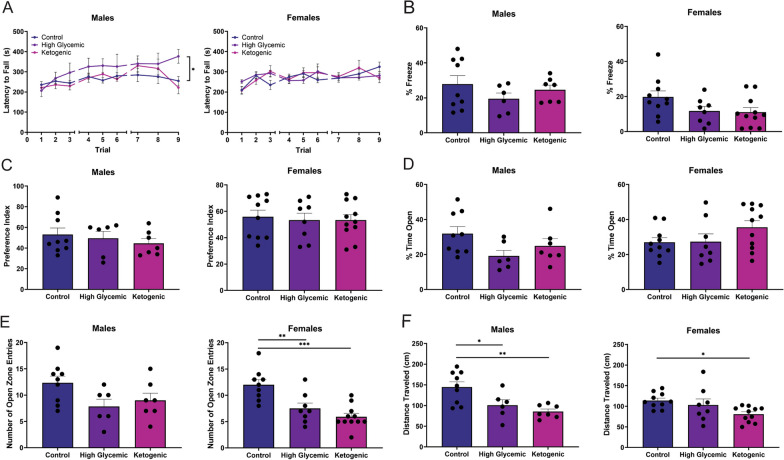
Results: The ketogenic diet caused weight gain and glucose intolerance in both male and female mice. In male mice, the high glycemic diet led to increased caspase-1 biosensor activation over the course of the study, while in females the ketogenic diet drove an increase in biosensor activation compared to their respective controls. These changes correlated with an increase in inflammatory cytokines present in the serum of test mice and the emergence of anxiety-like behavior. The microbiome composition differed significantly between diets; however no significant link between diet, glucose tolerance, or caspase-1 signal was established.
Conclusions: Our findings suggest that diet composition, specifically the source and quantity of carbohydrates, has sex-specific effects on inflammasome activation in the central nervous system and behavior. This phenotype manifested as increased anxiety in male mice, and future studies are needed to determine if this phenotype is linked to alterations in microbiome composition.
Keywords: Behavior; Caspase-1; Glucose intolerance; High glycemic index diet; Inflammasome; Inflammation; Ketogenic diet; Microbiome; Neuroinflammation; Sex.
© 2024. The Author(s).
Conflict of interest statement
The authors declare that they have no competing interests.
Figures
Similar articles
-
Ketogenic Diets Induced Glucose Intolerance and Lipid Accumulation in Mice with Alterations in Gut Microbiota and Metabolites.mBio. 2021 Mar 30;12(2):e03601-20. doi: 10.1128/mBio.03601-20. mBio. 2021. PMID: 33785628 Free PMC article.
-
An isoproteic cocoa butter-based ketogenic diet fails to improve glucose homeostasis and promote weight loss in obese mice.Am J Physiol Endocrinol Metab. 2022 Jul 1;323(1):E8-E20. doi: 10.1152/ajpendo.00435.2021. Epub 2022 May 16. Am J Physiol Endocrinol Metab. 2022. PMID: 35575232
-
Resistant Starch Alters the Microbiota-Gut Brain Axis: Implications for Dietary Modulation of Behavior.PLoS One. 2016 Jan 8;11(1):e0146406. doi: 10.1371/journal.pone.0146406. eCollection 2016. PLoS One. 2016. PMID: 26745269 Free PMC article.
-
A gut feeling about the ketogenic diet in epilepsy.Epilepsy Res. 2020 Oct;166:106409. doi: 10.1016/j.eplepsyres.2020.106409. Epub 2020 Jun 29. Epilepsy Res. 2020. PMID: 32673970 Review.
-
Low-carbohydrate and ketogenic diets: a scoping review of neurological and inflammatory outcomes in human studies and their relevance to chronic pain.Nutr Res Rev. 2023 Dec;36(2):295-319. doi: 10.1017/S0954422422000087. Epub 2022 Apr 19. Nutr Res Rev. 2023. PMID: 35438071
References
-
- Sheppard O, Coleman M. Alzheimer’s disease: etiology, neuropathology and pathogenesis. Brisbane: Exon Publications; 2020. pp. 1–22. - PubMed
-
- Javaid SF, et al. Epidemiology of Alzheimer’s disease and other dementias: rising global burden and forecasted trends. F1000Research. 2021;10:425. doi: 10.12688/f1000research.50786.1. - DOI
MeSH terms
Substances
LinkOut - more resources
Full Text Sources
Research Materials
