Characterizing the gut phageome and phage-borne antimicrobial resistance genes in pigs
- PMID: 38840247
- PMCID: PMC11151549
- DOI: 10.1186/s40168-024-01818-9
Characterizing the gut phageome and phage-borne antimicrobial resistance genes in pigs
Abstract
Background: Mammalian intestine harbors a mass of phages that play important roles in maintaining gut microbial ecosystem and host health. Pig has become a common model for biomedical research and provides a large amount of meat for human consumption. However, the knowledge of gut phages in pigs is still limited.
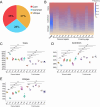
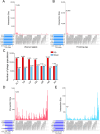
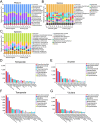
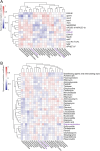
Results: Here, we investigated the gut phageome in 112 pigs from seven pig breeds using PhaBOX strategy based on the metagenomic data. A total of 174,897 non-redundant gut phage genomes were assembled from 112 metagenomes. A total of 33,487 gut phage genomes were classified and these phages mainly belonged to phage families such as Ackermannviridae, Straboviridae, Peduoviridae, Zierdtviridae, Drexlerviridae, and Herelleviridae. The gut phages in seven pig breeds exhibited distinct communities and the gut phage communities changed with the age of pig. These gut phages were predicted to infect a broad range of 212 genera of prokaryotes, such as Candidatus Hamiltonella, Mycoplasma, Colwellia, and Lactobacillus. The data indicated that broad KEGG and CAZy functions were also enriched in gut phages of pigs. The gut phages also carried the antimicrobial resistance genes (ARGs) and the most abundant antimicrobial resistance genotype was diaminopyrimidine resistance.
Conclusions: Our research delineates a landscape for gut phages in seven pig breeds and reveals that gut phages serve as a key reservoir of ARGs in pigs. Video Abstract.
Keywords: Antimicrobial resistance genes; Gut phageome; Metagenomic; PhaBOX; Pig.
© 2024. The Author(s).
Conflict of interest statement
The authors declare no competing interests.
Figures


Similar articles
-
Thousands of previously unknown phages discovered in whole-community human gut metagenomes.Microbiome. 2021 Mar 29;9(1):78. doi: 10.1186/s40168-021-01017-w. Microbiome. 2021. PMID: 33781338 Free PMC article.
-
Fecal microbiota transplantation alters gut phage communities in a clinical trial for obesity.Microbiome. 2024 Jul 6;12(1):122. doi: 10.1186/s40168-024-01833-w. Microbiome. 2024. PMID: 38970126 Free PMC article. Clinical Trial.
-
The pig intestinal phageome is an important reservoir and transfer vector for virulence genes.Sci Total Environ. 2024 Mar 15;916:170076. doi: 10.1016/j.scitotenv.2024.170076. Epub 2024 Jan 12. Sci Total Environ. 2024. PMID: 38220020
-
Fishing for phages in metagenomes: what do we catch, what do we miss?Curr Opin Virol. 2021 Aug;49:142-150. doi: 10.1016/j.coviro.2021.05.008. Epub 2021 Jun 15. Curr Opin Virol. 2021. PMID: 34139668 Review.
-
Does over a century of aerobic phage work provide a solid framework for the study of phages in the gut?Anaerobe. 2021 Apr;68:102319. doi: 10.1016/j.anaerobe.2021.102319. Epub 2021 Jan 16. Anaerobe. 2021. PMID: 33465423 Review.
Cited by
-
Alterations of the Enteric Virome in Vogt-Koyanagi-Harada Disease.Invest Ophthalmol Vis Sci. 2025 Jun 2;66(6):15. doi: 10.1167/iovs.66.6.15. Invest Ophthalmol Vis Sci. 2025. PMID: 40465264 Free PMC article.
-
Virome characteristics of small mammals and their associated environments in pastoral areas on the Qinghai-Tibet Plateau.NPJ Biofilms Microbiomes. 2025 Aug 22;11(1):168. doi: 10.1038/s41522-025-00814-7. NPJ Biofilms Microbiomes. 2025. PMID: 40841544 Free PMC article.
-
Massive expansion of the pig gut virome based on global metagenomic mining.NPJ Biofilms Microbiomes. 2024 Aug 29;10(1):76. doi: 10.1038/s41522-024-00554-0. NPJ Biofilms Microbiomes. 2024. PMID: 39209853 Free PMC article.
-
Unveiling the role of phages in shaping the periodontal microbial ecosystem.mSystems. 2025 Apr 22;10(4):e0020125. doi: 10.1128/msystems.00201-25. Epub 2025 Mar 28. mSystems. 2025. PMID: 40152610 Free PMC article.
-
Unraveling the composition and function of pig gut microbiome from metagenomics.Anim Microbiome. 2025 Jun 4;7(1):60. doi: 10.1186/s42523-025-00419-7. Anim Microbiome. 2025. PMID: 40468444 Free PMC article. Review.
References
MeSH terms
Grants and funding
LinkOut - more resources
Full Text Sources

