. 2024 Jul 3;138(13):797-815.
doi: 10.1042/CS20240179.

IGFBP7 promotes endothelial cell repair in the recovery phase of acute lung injury

Affiliations

IGFBP7 promotes endothelial cell repair in the recovery phase of acute lung injury

Rui He et al. Clin Sci (Lond). .

Abstract

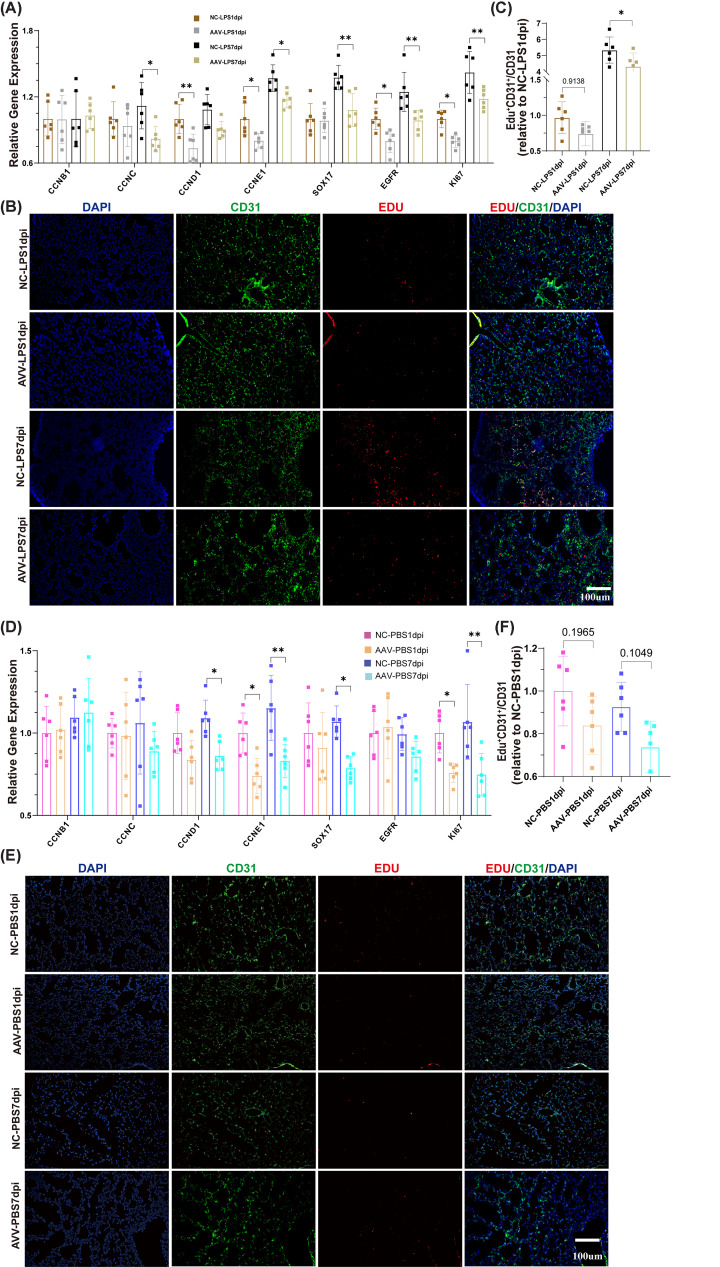
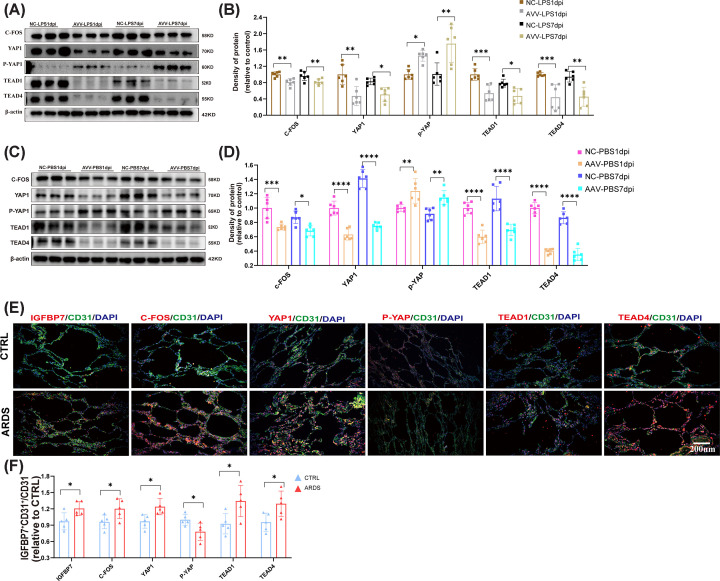
IGFBP7 has been found to play an important role in inflammatory diseases, such as acute lung injury (ALI). However, the role of IGFBP7 in different stages of inflammation remains unclear. Transcriptome sequencing was used to identify the regulatory genes of IGFBP7, and endothelial IGFBP7 expression was knocked down using Aplnr-Dre mice to evaluate the endothelial proliferation capacity. The expression of proliferation-related genes was detected by Western blotting and RT-PCR assays. In the present study, we found that knockdown of IGFBP7 in endothelial cells significantly decreases the expression of endothelial cell proliferation-related genes and cell number in the recovery phase but not in the acute phase of ALI. Mechanistically, using bulk-RNA sequencing and CO-IP, we found that IGFBP7 promotes phosphorylation of FOS and subsequently up-regulates YAP1 molecules, thereby promoting endothelial cell proliferation. This study indicated that IGFBP7 has diverse roles in different stages of ALI, which extends the understanding of IGFBP7 in different stages of ALI and suggests that IGFBP7 as a potential therapeutic target in ALI needs to take into account the period specificity of ALI.

Keywords: ALI; c-fos; cell proliferation; igfbp7; yap.


Conflict of interest statement

The authors declare that there are no competing interests associated with the manuscript.

Figures

Figure 1
Figure 1. IGFBP7 promotes HUVECs proliferation
(A,B) Representative images of EDU-AF488 and DAPI co-staining in HUVECs transfected with IGFBP7 siRNA (48 h) and treated with LPS (5 µg/ml) for 24 h. Scale bars: 50 μm (40×). (C) Determined by the CCK-8 assay, the cell viability of HUVECs transfected with IGFBP7 siRNA for 48 h and treated with LPS (5 µg/ml) for 24 h. (D) Assessed by qRT-PCR, the mRNA expression of CCNB1, CCNC, CCND1, CCNE1, SOX17, EGFR, and KI67 in HUVECs transfected with IGFBP7 siRNA for 48 h and treated with LPS (5 µg/ml) for 24 h. (E,F) Confocal microscopy images depicting EDU-AF488 staining alongside DAPI staining in healthy HUVECs intervened with rhIGFBP7 (1 μg/ml) for 48 h. Scale bars: 50 μm (40×). (G) Determined by the CCK-8 assay, the cell viability of HUVECs intervened with rhIGFBP7 (1 μg/ml) for 48 h. (H) Assessed by qRT-PCR, the mRNA expression of CCNB1, CCNC, CCND1, CCNE1, SOX17, EGFR, and KI67 in HUVECs intervened with rhIGFBP7 (1 μg/ml) for 48 h. Data represented as means ± SDs. *P<0.05, **P<0.01, ***P<0.005 [one-way ANOVA, Tukey’s test (B–D) and t-test (FH)].
Figure 2
Figure 2. The knockdown of IGFBP7 reduced vascular endothelial cell proliferation in healthy and ALI mice
(A) Assessed by qRT-PCR, the mRNA expression of CCNB1, CCNC, CCND1, CCNE1, SOX17, EGFR, and KI67 in mouse lung tissues from mice subjected to intratracheal injection with LPS (5 mg/kg) treatment and collecting lung tissues after 24 h or 7 days. (B,C) Representative images of EDU-AF555, CD31-AF488, and DAPI co-staining in mouse lung tissues from mice subjected to intratracheal injection with saline or LPS (5 mg/kg) treatment and collecting lung tissues after 24 h or 7 days. Scale bars: 100 μm (20×). (D) Assessed by qRT-PCR, the mRNA expression of CCNB1, CCNC, CCND1, CCNE1, SOX17, EGFR, and KI67 in mouse lung tissues from mice subjected to intratracheal injection with saline treatment and Collecting lung tissues after 24 h or 7 days. (E,F) Representative images of EDU-AF555, CD31-AF488, and DAPI co-staining in mouse lung tissues from mice subjected to intratracheal injection with saline treatment and Collecting lung tissues after 24 h or 7 days. Scale bars: 100 μm (20×). Data represented as means ± SDs. *P<0.05, **P<0.01 [one-way ANOVA, Tukey’s test (A,C,D,F)]. AAV, Adeno-associated virus; NC, Negative Control.
Figure 3
Figure 3. IGFBP7 regulates cell proliferation in association with YAP1
(A) Volcano map of differentially expressed genes between LPS+siRNA vs. LPS+NC groups. (B) Functional enrichment map of differentially expressed genes between LPS+siRNA vs. LPS+NC groups. (C) Functional enrichment map of differentially expressed genes between CON+siRNA vs. CON+NC groups. (D), The common gene in different proliferation-related clusters (27 in the LPS+siIGFBP7 vs. LPS group and 22 in the CON+siIGFBP7 vs. CON group). (E) Knockdown of IGFBP7 significantly reduced YAP1 mRNA levels: The TPM value was expressed as the mean ± S.E.M., n=3. (F) YAP1 was predicted as a potential interacting protein for IGFBP7 by the HitPredict database. CON, Control group; TPM, Transcript per Kilobase per Million mapped reads. ** represents the significance of Treat versus NC in the Control mouse model, and ## represents the significance of Treat versus NC in the LPS-treated mouse model. **P<0.01,##P<0.01.
Figure 4
Figure 4. Activation of the YAP/TEAD1/TEAD4 signaling pathway in HUVECs by IGFBP7
(A,B) Detected by Western blotting, the protein expression of YAP1, P-YAP, TEAD1, and TEAD4 in HUVECs intervened with rhIGFBP7 (0, 200, 500, 1000, and 2000 ng/ml) for 48 h, internal control for normalization: β-Actin. (C,D) Detected by Western blotting, the protein expression of IGFBP7, YAP1, P-YAP, TEAD1, and TEAD4 in HUVECs transfected with IGFBP7 siRNA for 48 h and treated with LPS (5 µg/ml) for 24 h, internal control for normalization: β-Actin. (E–L) Representative images of YAP, P-YAP, TEAD1, TEAD4-AF555, and DAPI co-staining in HUVECs transfected with IGFBP7 siRNA for 48 h. Scale bars: 50 μm (40×). (MT) Representative images of YAP, P-YAP, TEAD1, TEAD4-AF555, and DAPI co-staining in HUVECs intervened with rhIGFBP7 (1 μg/ml) for 48 h. Scale bars: 50 μm (40×). Data represented as means ± SDs. *P<0.05, **P<0.01, ***P<0.005,****P<0.001 [one-way ANOVA, Tukey’s test (B,D) and t-test (F,H,J,L,N,P,R,T)]. CTRL, Control group. * represents the significance of Treat versus NC in the Control mouse model, and # represents the significance of Treat versus NC in the LPS-treated mouse model. #P<0.05".Please add " ##P<0.01, ####P<0.001.
Figure 5
Figure 5. YAP1 inhibitors suppress cell proliferation by alleviating the activation of the YAP/TEAD1/TEAD4 signaling pathway mediated by IGFBP7 in HUVECs
(A,B) Detected by Western blotting, the protein expression of YAP1, P-YAP, TEAD1, and TEAD4 in HUVECs treated with Verteporfin (1 μM, a YAP1 inhibitor) for 48 h, simultaneously with a 24 h LPS treatment, internal control for normalization: β-Actin. (C) Assessed by qRT-PCR, the mRNA expression of CCNB1, CCNC, CCND1, CCNE1, SOX17, EGFR, and KI67 in HUVECs intervened with Verteporfin (1 μM) for 48 h, concurrently treated with LPS (5 μg/ml) for 24 h. (D) Determined by the CCK-8 assay, the cell viability of HUVECs intervened with Verteporfin (1 μM) for 48 h, concurrently treated with LPS (5 μg/ml) for 24 h. (E,F) Representative images of EDU-AF488 and DAPI co-staining in HUVECs intervened with Verteporfin (1 μM) for 48 h, concurrently treated with LPS (5 μg/ml) for 24 h. Scale bars: 50 μm (40×). (G,H) Detected by Western blotting, the protein expression of YAP1, P-YAP, TEAD1, and TEAD4 in HUVECs treated with rhIGFBP7 (1 μg/ml) for 48 h, simultaneously intervened with Verteporfin (1 μM) for 48 h, internal control for normalization: β-Actin. (I) Assessed by qRT-PCR, the mRNA expression of CCNB1, CCNC, CCND1, CCNE1, SOX17, EGFR, and KI67 in HUVECs treated with rhIGFBP7(1 μg/ml) for 48 h, simultaneously intervened with Verteporfin (1 μM) for 48 h. (J) Determined by the CCK-8 assay, the cell viability of HUVECs treated with rhIGFBP7 (1 μg/ml) for 48 h simultaneously intervened with Verteporfin (1 μM) for 48 h. (K,L) Representative images of EDU-AF488 and DAPI co-staining in HUVECs treated with rhIGFBP7 for 48 h, simultaneously intervened with Verteporfin (1 μM) for 48 h. Scale bars: 50 μm (40×). Data represented as means ± SDs. *P<0.05, **P<0.01, ***P<0.005,****P<0.001 [one-way ANOVA, Tukey’s test (B,C,D,F,H,I,J,L)]. CTRL, Control group. * represents the significance of Treat versus NC in the Control mouse model, and # represents the significance of Treat versus NC in the LPS-treated mouse model. #P<0.05".Please add " ##P<0.01.
Figure 6
Figure 6. The C-FOS inhibitors suppress cell proliferation by relieving the IGFBP7-mediated activation of the C-FOS/YAP/TEAD 1-TEAD 4 signaling pathway in the HUVECs
(A,B) String and Genemania databases were used to predict the potential regulatory molecules of IGFBP7. (C,D) Detected by Western blotting, the protein expression of c-FOS in HUVECs intervened with rhIGFBP7 (0, 200, 500, 1000, and 2000 ng/ml) for 48 h, internal control for normalization: β-Actin. (E,F) Detected by Western blotting, the protein expression of c-FOS in HUVECs transfected with IGFBP7 siRNA for 48 h and treated with LPS (5 µg/ml) for 24 h, internal control for normalization: β-Actin. (G,H) Representative images of c-FOS-AF555 and DAPI co-staining in HUVECs transfected with IGFBP7 siRNA for 48 h. Scale bars: 50 μm (40×). (I,J) Representative images of c-FOS-AF555 and DAPI co-staining in HUVECs intervened with rhIGFBP7 (1 μg/ml) for 48 h. Scale bars: 50 μm (40×). (K–L) Detected by Western blotting, the protein expression of c-FOS in HUVECs treated with Verteporfin (1 μM, a YAP1 inhibitor) for 48 h, simultaneously with a 24 h LPS treatment, internal control for normalization: β-Actin. (M,N) Detected by Western blotting, the protein expression of c-FOS in HUVECs treated with rhIGFBP7 (1 μg/ml) for 48 h, simultaneously intervened with Verteporfin (1 μM) for 48 h, internal control for normalization: β-Actin. (O,P) Detected by Western blotting, the protein expression of C-FOS, YAP1, P-YAP, TEAD1, and TEAD4 in HUVECs treated with T5224 (40 μM, a C-FOS inhibitor) for 48 h, simultaneously with a 24 h LPS treatment, internal control for normalization: β-Actin. (Q,R) Detected by Western blotting, the protein expression of C-FOS, YAP1, P-YAP, TEAD1, and TEAD4 in HUVECs treated with rhIGFBP7 (1 μg/ml) for 48 h, simultaneously intervened with T5224 (40 μM, a C-FOS inhibitor) for 48 h, internal control for normalization: β-Actin. (S,T) Representative images of EDU-AF488 and DAPI co-staining in HUVECs intervened with T5224 (40 μM) for 48 h, concurrently treated with LPS (5 μg/ml) for 24 h. Scale bars: 50 μm (20×). (U) Assessed by qRT-PCR, the mRNA expression of CCNB1, CCNC, CCND1, CCNE1, SOX17, EGFR, and KI67 in HUVECs intervened with T5224 (40 μM) for 48 h, concurrently treated with LPS (5 μg/ml) for 24 h. (V) Determined by the CCK-8 assay, the cell viability of HUVECs intervened with T5224 (40 μM) for 48 h, concurrently treated with LPS (5 μg/ml) for 24 h. (W,X) Representative images of EDU-AF488 and DAPI co-staining in HUVECs treated with rhIGFBP7 (1 μg/ml) for 48 h and simultaneously intervened with T5224 (40 μM) for 48 h. Scale bars: 50 μm (40×). (Y) Assessed by qRT-PCR, the mRNA expression of CCNB1, CCNC, CCND1, CCNE1, SOX17, EGFR, and KI67 in HUVECs treated with rhIGFBP7 (1 μg/ml) for 48 h and simultaneously intervened with T5224 (40 μM) for 48 h. (Z) Determined by the CCK-8 assay, the cell viability of HUVECs treated with rhIGFBP7 (1 μg/ml) for 48 h and simultaneously intervened with T5224 (40 μM) for 48 h. Data represented as means ± SDs. *P<0.05, **P<0.01, ***P<0.005,****P<0.001 [one-way ANOVA, Tukey’s test (D,F,L,N,P,R,T,U,V,X,Y,Z)] and t-test (H,J). CTRL, Control group.
Figure 7
Figure 7. Up-regulation of C-FOS expression by IGFBP7 inhibiting ubiquitination and promoting phosphorylation of C-FOS
(A) Assessed by qRT-PCR, the mRNA expression of c-FOS in HUVECs transfected with IGFBP7 siRNA for 48 h. (B) Assessed by qRT-PCR, the mRNA expression of c-FOS in HUVECs intervened with rhIGFBP7 (1 μg/ml). (C–F) Detected by Western blotting, the protein expression of Ubiquitin, pan Phospho-Serine in HUVECs transfected with the HA-Tag-C-FOS plasmid for 48 h, simultaneously intervened with rhIGFBP7 (1 μg/ml) for an additional 48 h, internal control for normalization: HA. Extraction of C-FOS protein using Anti-HA Magnetic Beads. Data represented as means ± SDs. *P<0.05, ****P<0.001 [t-test (A,B,D,F)]. CTRL, Control group.
Figure 8
Figure 8. Down-regulation of IGFBP7 inhibits the activation of the C-FOS/YAP/TEAD1-TEAD4 signaling pathway in vivo
(A,B) Detected by Western blotting, the protein expression of C-FOS, YAP1, P-YAP, TEAD1, and TEAD4 in mouse lung tissues from ordinary and IGFBP7-KO mice (obtained by endothelial cell-specific knockdown of IGFBP7 in Aplnr-2A-DreERt2 mice) subjected to intratracheal injection with saline treatment (Collecting lung tissues after 24 h or 7 days), internal control for normalization: β-Actin. (C,D) Detected by Western blotting, the protein expression of C-FOS, YAP, P-YAP, TEAD1, and TEAD4 in mouse lung tissues from ordinary and IGFBP7-KO mice subjected to intratracheal injection with LPS (5 mg/kg) treatment (Collecting lung tissues after 24 hours or 7 days), internal control for normalization: β-Actin. (E,F) Representative images of IGFBP7, C-FOS, YAP, P-YAP, TEAD1, TEAD4-AF555, CD31-AF488, and DAPI co-staining in ARDS human lung tissue. Data represented as means ± SDs. *P<0.05, **P<0.01, ***P<0.005,****P<0.001 [one-way ANOVA, Tukey’s test (B,D)] and t-test (F). CTRL, Control group.

Similar articles

Cited by

References

    1. Ware L.B. and Matthay M.A. (2000) The acute respiratory distress syndrome. N. Engl. J. Med. 342, 1334–1349 10.1056/NEJM200005043421806 - DOI - PubMed
    1. Zimmerman J.L. (2002) Respiratory failure. Blood. Purif. 20, 235–238 10.1159/000047014 - DOI - PubMed
    1. Joffre J., Hellman J., Ince C. and Ait-Oufella H. (2020) Endothelial responses in sepsis. Am. J. Respir. Crit. Care Med. 202, 361–370 10.1164/rccm.201910-1911TR - DOI - PubMed
    1. Maniatis N.A. and Orfanos S.E. (2008) The endothelium in acute lung injury/acute respiratory distress syndrome. Curr. Opin. Crit. Care 14, 22–30 10.1097/MCC.0b013e3282f269b9 - DOI - PubMed
    1. Usui T., Murai T., Tanaka T., Yamaguchi K., Nagakubo D., Lee C.M.et al. . (2002) Characterization of mac25/angiomodulin expression by high endothelial venule cells in lymphoid tissues and its identification as an inducible marker for activated endothelial cells. Int. Immunol. 14, 1273–1282 10.1093/intimm/dxf102 - DOI - PubMed

MeSH terms

Substances