. 2024 Jun 4;14(6):e11489.
doi: 10.1002/ece3.11489. eCollection 2024 Jun.

Evolutionary adaptations generally reverse phenotypic plasticity to restore ancestral phenotypes during new environment adaptation in cattle

Affiliations

Evolutionary adaptations generally reverse phenotypic plasticity to restore ancestral phenotypes during new environment adaptation in cattle

Qiang Jiang et al. Ecol Evol. .

Abstract

Phenotype plasticity and evolution adaptations are the two main ways in which allow populations to deal with environmental changes, but the potential relationship between them remains controversial. Using a reciprocal transplant approach with cattle adapted to the Tibetan Plateau and adjacent lowlands, we aim to investigate the relative contributions of evolutionary processes and phenotypic plasticity in driving both phenotypic and transcriptomic changes under natural conditions. We observed that while numerous genetic transcriptomic changes were evident during the forward adaptation to highland environments, plastic changes predominantly facilitate the transformation of transcriptomes into a preferred state when Tibetan cattle are reintroduced to lowland habitats. Genes with ancestral plasticity are generally reversed by evolutionary adaptations and show a closer expression level to the ancestral stage in evolved Tibetan cattle. A similar trend was also observed at the phenotypes level, with a majority of biochemical and hemorheology phenotypes showing a tendency to revert to their ancestral patterns, suggesting the restoration of ancestral expression levels is a widespread evolutionary trend during adaptation. The findings of our study contribute to the debate regarding the relative contributions of plasticity and genetic changes in mammal environment adaptation. Furthermore, we highlight that the restoration of ancestral phenotypes represents a general pattern in cattle new environment adaptation.

Keywords: cattle; environment adaptation; gene expression; phenotypic plasticity.


Conflict of interest statement

The authors declare that the research was conducted in the absence of any commercial or financial relationships that could be construed as a potential conflict of interest.

Figures

FIGURE 1
FIGURE 1
The patterns of evolutionary changes in phenotypic plasticity. (a) Genetic assimilation. The fitness function for the trait under consideration exhibits variation between the ancestral lowland habitat and the recently colonized highland environment. The plastic response induced by hypoxia is advantageous (as depicted by a solid line representing reaction norm) and subsequently becomes stabilized through selection, leading to diminished plasticity. (b) Genetic compensation with canalization. The fitness function remains consistent for the trait in both lowland and highland environments. The plastic response induced by hypoxia causes a deviation from the optimal trait value. In highland natives, selection acts on genetically determined trait variation to counterbalance the plastic alteration, thereby reinstating the ancestral phenotype (i.e., the same phenotype exhibited by lowland natives in their original environment). (c) Same scenario as in b, but the highland population evolves a new reaction to reach the optimum by changing mean expression, that is, shift in the intercept of the reaction norm without a concomitant loss of plasticity (change in Y‐intercept, but no change in slope). (d) Combination of genetic assimilation of favorable plastic responses and genetic compensation of detrimental. Highland population reached the optimum by both changing mean expression, that is, shift in the intercept and change in the plasticity, that is, the slope of the reaction norm (both change in Y‐intercept and in slope).
FIGURE 2
FIGURE 2
Reciprocal transplant experiment analysis the plastic and genetic changes between Tibetan and lowland cattle. (a) The experimental design involves conducting reciprocal transplant experiments, two cattle breeds were phenotyped and RNA‐sequenced in its native environment as well as the native environment of the other breed. Red blood cell number (b) and hemoglobin (c) are presented as indicators of blood physiology, plasma viscosity (d), and fibrinogen (e) are presented as indicators of blood hemorheology. Breeds are indicated by different symbols, while environments are indicated by different colors. Error bars show one standard error based on the binomial distribution. p values are determined by a G test of independence. ns, P > 0.06; *, 0.01 < P < 0.05; ***, P < 0.001.
FIGURE 3
FIGURE 3
Reciprocal transplant experiments reveal plastic and genetic differences in gene expression levels between Tibetan and lowland cattle. (a) Samples 1 represent the lowland cattle in original lowland environment; samples 3 represent the lowland cattle in “foreign” highland environment; samples 4 represent the Tibetan cattle in “home” highland environment; samples 4 represent the Tibetan cattle in ancestral lowland environment. (b) Samples 1, 3, and 4, respectively, represent the original (O), plastic (P), and adapted (A) stages during the forward adaptation from the lowland to highland. (c) Samples 3, 1, and 2, respectively, represent the O, P, and A stages during the reverse adaptation from the highland to the lowland. (d) The numbers of differentially expressed genes (DEGs) in each tissue that undergo plastic changes (PC) and evolutionary changes (EC) during forward (F) or reverse (R) adaptation. (e) The ratio of the number of DEGs is PC divided by EC in F or R adaptation is calculated for each tissue and all tissues combined. p Values are determined using a G test of independence.
FIGURE 4
FIGURE 4
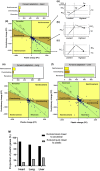
Impact of evolutionary responses to ancestral plasticity. (a–c) Cartoon representations of three categories of evolutionary response to ancestral plasticity. Dashed line represents transition from ancestral lowland environment to novel highland environment and associated trait shift. When an ancestral lowland population encounters to highland environment, an immediate phenotypic change occurs, shifting the trait from its initial value of Lo in the lowland environment to Lp in the highland environment. As populations undergo adaptation over time, a subsequent evolutionary change takes place, further shifting Lp to a new value of La. The evolutionary response to ancestral plasticity can be categorized into three distinct groups based on the values of PC and EC. (a) Reinforcement: The subsequent evolutionary change (EC) aligns with the direction of phenotypic change (PC). (b) Overshooting: PC has brought the trait value closer to the new optimum, where La is now closer to Lp than Lo. (c) Reversion: The optimal trait value in the new habitat is closer to the unstressed ancestor's value in its original environment (Lo), rather than its response (Lp). (d–f) The proportion of evolutionary responses to ancestral plasticity in heart, lung, and liver, respectively. Top bar plots showing numbers of genes displaying reversion, overshooting, and reinforcement. (g) Proportion of genes with expression levels after evolution (adapted stage La) are closer to ancestral levels (Lo), or closer to plastic levels (Lp).

References

    1. Ajmone‐Marsan, P. , Garcia, J. F. , & Lenstra, J. A. (2010). On the origin of cattle: How aurochs became cattle and colonized the world. Evolutionary Anthropology, 19(4), 148–157.
    1. Baythavong, B. S. (2011). Linking the spatial scale of environmental variation and the evolution of phenotypic plasticity: Selection favors adaptive plasticity in fine‐grained environments. The American Naturalist, 178, 75–87. - PubMed
    1. Chen, F. H. , Dong, G. H. , Zhang, D. J. , Liu, X. Y. , Jia, X. , An, C. B. , Ma, M. M. , Xie, Y. W. , Barton, L. , Ren, X. Y. , Zhao, Z. J. , Wu, X. H. , & Jones, M. K. (2015). Agriculture facilitated permanent human occupation of the Tibetan Plateau after 3600 B.P. Science, 347(6219), 248–250. - PubMed
    1. Forsman, A. (2015). Rethinking phenotypic plasticity and its consequences for individuals, populations, and species. Heredity, 115(4), 276–284. - PMC - PubMed
    1. Gao, Y. H. , Gautier, M. , Ding, X. D. , Zhang, H. , Wang, Y. , Wang, X. , Faruque, M. D. O. , Li, J. , Ye, S. , Gou, X. , Han, J. , Lenstra, J. A. , & Zhang, Y. (2017). Species composition and environmental adaptation of indigenous Chinese cattle. Scientific Reports, 7, 16196. - PMC - PubMed

LinkOut - more resources