

Identifying hub genes in response to ustekinumab and the impact of ustekinumab treatment on fibrosis in Crohn's disease
- PMID: 38840917
- PMCID: PMC11150586
- DOI: 10.3389/fimmu.2024.1401733
Identifying hub genes in response to ustekinumab and the impact of ustekinumab treatment on fibrosis in Crohn's disease
Abstract
Introduction: Crohn's disease (CD) is a chronic inflammatory disease. Approximately 50% of patients with CD progressed from inflammation to fibrosis. Currently, there are no effective drugs for treating intestinal fibrosis. Biologic therapies for CD such as ustekinumab have benefited patients; however, up to 30% of patients with CD have no response to initial treatment, and the effect of ustekinumab on intestinal fibrosis is still uncertain. Therefore, it is of great significance to explore the predictive factors of ustekinumab treatment response and the effect of ustekinumab on intestinal fibrosis.
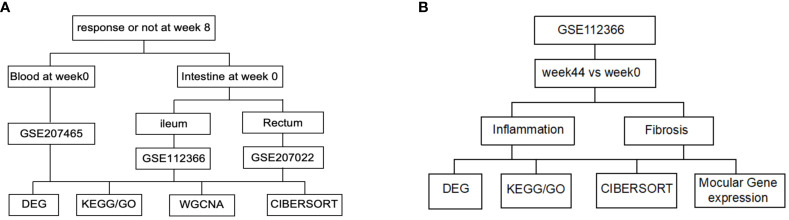
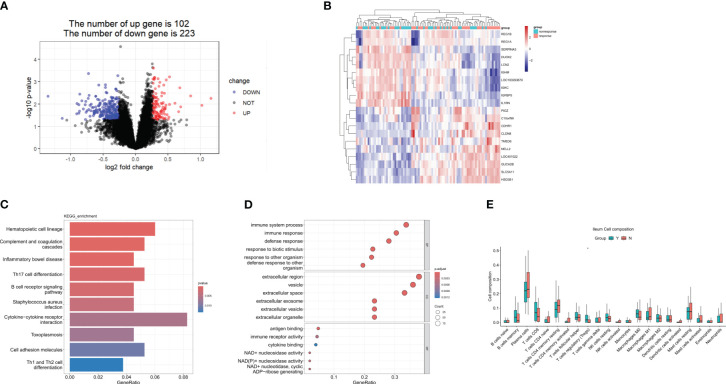
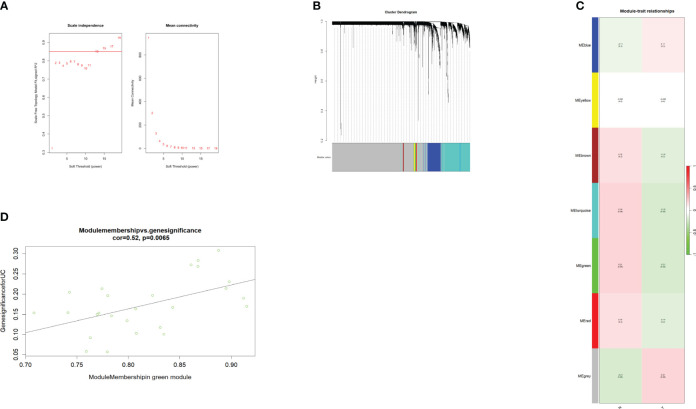
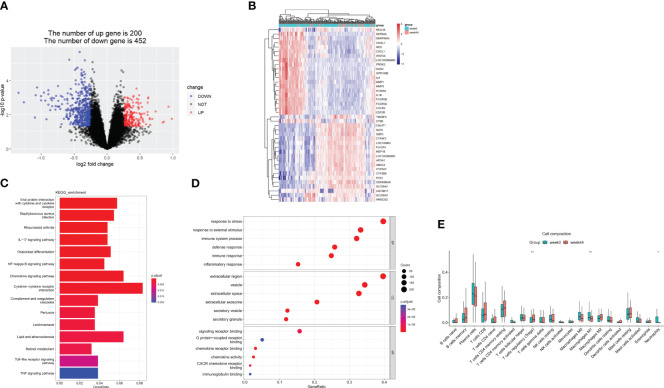
Materials and methods: Public datasets-GSE207465 (blood samples) and GSE112366 and GSE207022 (intestinal samples)-were downloaded and analyzed individually (unmerged) based on the treatment response. Differentially expressed genes (DEGs) were identified by the "limma" R package and changes in immune cell infiltration were determined by the "CIBERSORT" R package in both blood and intestinal samples at week 0 (before treatment). To find predictive factors of ustekinumab treatment response, the weighted gene co-expression network analysis (WGCNA) R package was used to identify hub genes in GSE112366. Hub genes were then verified in GSE207022, and a prediction model was built by random forest algorithm. Furthermore, fibrosis-related gene changes were analyzed in ileal samples before and after treatment with ustekinumab.
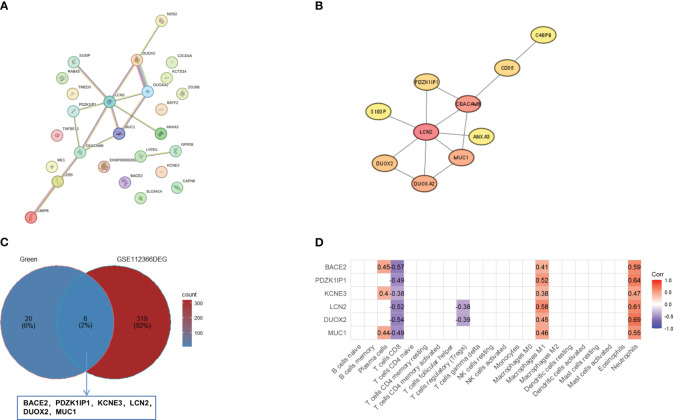
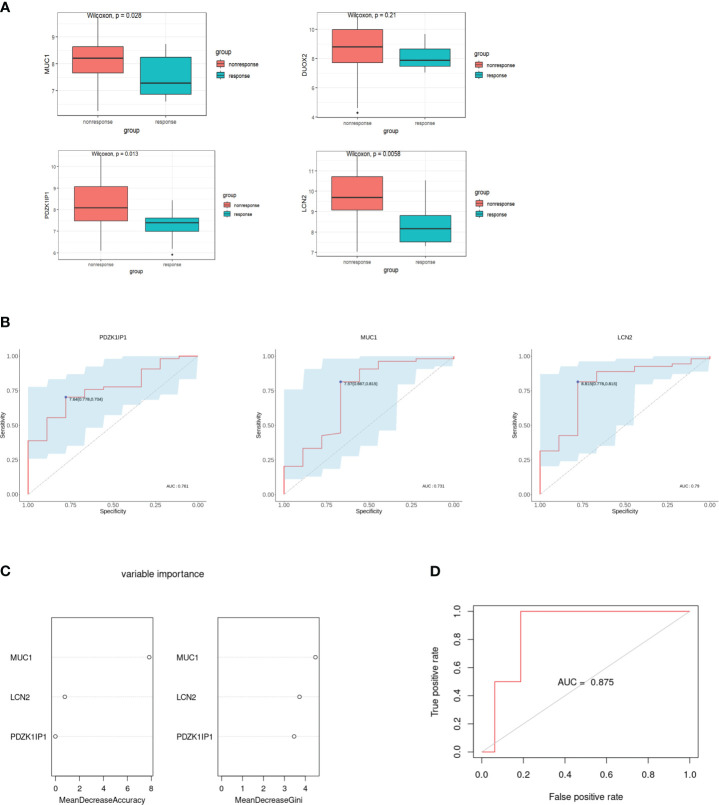
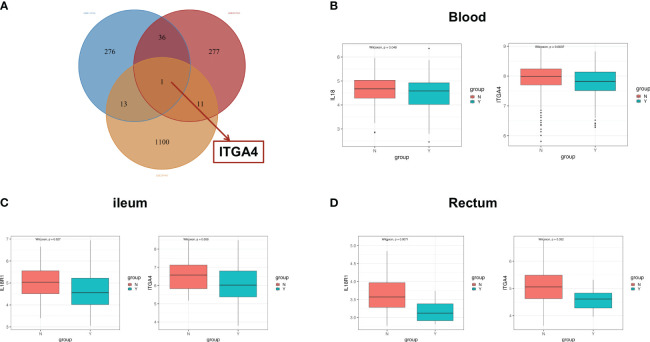
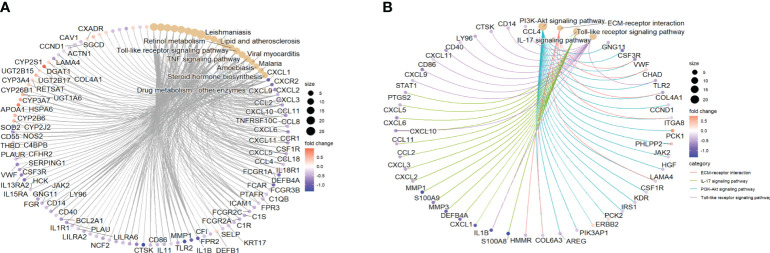
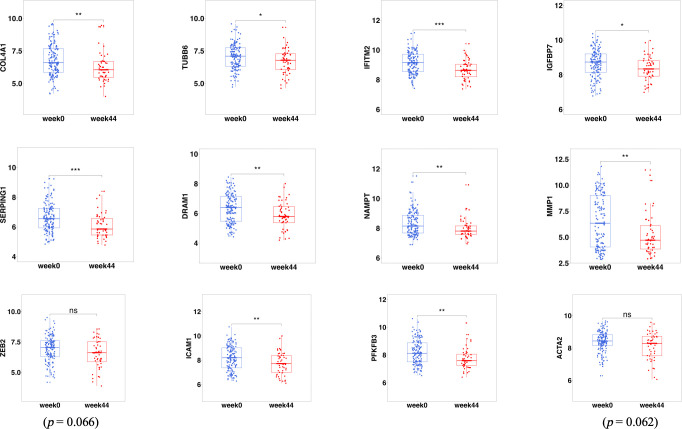
Results: (1) Our analysis found that MUC1, DUOX2, LCN2, and PDZK1IP1 were hub genes in GSE112366. GSE207022 revealed that MUC1 (AUC:0.761), LCN2 (AUC:0.79), and PDZK1IP1 (AUC:0.731) were also lower in the response group. Moreover, the random forest model was shown to have strong predictive capabilities in identifying responders (AUC = 0.875). To explore the relationship between intestinal tissue and blood, we found that ITGA4 had lower expression in the intestinal and blood samples of responders. The expression of IL18R1 is also lower in responders' intestines. IL18, the ligand of IL18R1, was also found to have lower expression in the blood samples from responders vs. non-responders. (2) GSE112366 revealed a significant decrease in fibrosis-related module genes (COL4A1, TUBB6, IFITM2, SERPING1, DRAM1, NAMPT, MMP1, ZEB2, ICAM1, PFKFB3, and ACTA2) and fibrosis-related pathways (ECM-receptor interaction and PI3K-AKT pathways) after ustekinumab treatment.
Conclusion: MUC1, LCN2, and PDZK1IP1 were identified as hub genes in intestinal samples, with lower expression indicating a positive prediction of ustekinumab treatment response. Moreover, ITGA4 and IL18/IL18R1 may be involved in the treatment response in blood and intestinal samples. Finally, ustekinumab treatment was shown to significantly alter fibrotic genes and pathways.
Keywords: Crohn’s disease; intestinal fibrosis; transcriptomics; treatment response; ustekinumab.
Copyright © 2024 Xu, Wang, Ye and Zhang.
Conflict of interest statement
The authors declare that the research was conducted in the absence of any commercial or financial relationships that could be construed as a potential conflict of interest.
Figures
Similar articles
-
Machine learning gene expression predicting model for ustekinumab response in patients with Crohn's disease.Immun Inflamm Dis. 2021 Dec;9(4):1529-1540. doi: 10.1002/iid3.506. Epub 2021 Sep 1. Immun Inflamm Dis. 2021. PMID: 34469062 Free PMC article.
-
Ustekinumab affects myofibroblast metabolism to alleviate intestinal fibrosis by targeting KDELC1 in Crohn's disease through multi-machine learning combined with single-cell sequencing analysis.Front Med (Lausanne). 2024 Oct 22;11:1476592. doi: 10.3389/fmed.2024.1476592. eCollection 2024. Front Med (Lausanne). 2024. PMID: 39502647 Free PMC article.
-
Single-cell analysis of Crohn's disease: Unveiling heterogeneity and evaluating ustekinumab outcomes.J Gene Med. 2024 Jul;26(7):e3715. doi: 10.1002/jgm.3715. J Gene Med. 2024. PMID: 38962887
-
Anti-IL-12/23p40 antibodies for maintenance of remission in Crohn's disease.Cochrane Database Syst Rev. 2019 Dec 12;12(12):CD012804. doi: 10.1002/14651858.CD012804.pub2. Cochrane Database Syst Rev. 2019. PMID: 31828765 Free PMC article.
-
Pre-operative Exposure to Ustekinumab: A Risk Factor for Postoperative Complications in Crohn's Disease (CD)?Curr Drug Targets. 2019;20(13):1369-1372. doi: 10.2174/1389450120666190515094435. Curr Drug Targets. 2019. PMID: 31113343 Review.
Cited by
-
Integrative bioinformatics analysis of high-throughput sequencing and in vitro functional analysis leads to uncovering key hub genes in esophageal squamous cell carcinoma.Hereditas. 2025 Mar 14;162(1):38. doi: 10.1186/s41065-025-00398-4. Hereditas. 2025. PMID: 40087784 Free PMC article.
References
MeSH terms
Substances
LinkOut - more resources
Full Text Sources
Medical
Research Materials
Miscellaneous