. 2024 Jun;29(Suppl 3):S33303.
doi: 10.1117/1.JBO.29.S3.S33303. Epub 2024 Jun 5.

Distribution-informed and wavelength-flexible data-driven photoacoustic oximetry

Affiliations

Distribution-informed and wavelength-flexible data-driven photoacoustic oximetry

Janek Gröhl et al. J Biomed Opt. 2024 Jun.

Abstract

Significance: Photoacoustic imaging (PAI) promises to measure spatially resolved blood oxygen saturation but suffers from a lack of accurate and robust spectral unmixing methods to deliver on this promise. Accurate blood oxygenation estimation could have important clinical applications from cancer detection to quantifying inflammation.

Aim: We address the inflexibility of existing data-driven methods for estimating blood oxygenation in PAI by introducing a recurrent neural network architecture.

Approach: We created 25 simulated training dataset variations to assess neural network performance. We used a long short-term memory network to implement a wavelength-flexible network architecture and proposed the Jensen-Shannon divergence to predict the most suitable training dataset.

Results: The network architecture can flexibly handle the input wavelengths and outperforms linear unmixing and the previously proposed learned spectral decoloring method. Small changes in the training data significantly affect the accuracy of our method, but we find that the Jensen-Shannon divergence correlates with the estimation error and is thus suitable for predicting the most appropriate training datasets for any given application.

Conclusions: A flexible data-driven network architecture combined with the Jensen-Shannon divergence to predict the best training data set provides a promising direction that might enable robust data-driven photoacoustic oximetry for clinical use cases.

Keywords: deep learning; image processing; oximetry; quantitative imaging; simulation.


Figures

Fig. 1
Fig. 1
Overview of the methods used. (a) Photon transport was simulated with a Monte Carlo light model for each of the 24 distinct datasets adapted from a baseline tissue assumption (BASE). Wavelength-dependent initial pressure spectra (right) were extracted from the vessels simulated in the leftmost panel. (b) A deep learning network based on an LSTM network was introduced to enable greater flexibility regarding input wavelengths for analysis. The hidden state of the LSTM was passed to fully connected layers, which output the estimated blood oxygenation sO2. (d) The performance of the LSTM-based method when trained on datasets with different tissue simulation parameters was tested across different datasets, ranging from in silico simulations and in gello phantom measurements, to in vivo measurements. This figure was created with Inkscape using BioRender assets.
Fig. 2
Fig. 2
LSTM-based method shows wavelength flexibility. (a) LSTMs were trained with varying numbers of wavelengths (Nλ) to show that with an increasing number of wavelengths, the accuracy of the predictions increases. (b) LSTM trained at a given Nλ can be applied to data with different Nλ but yields the best results when Nλ of the test spectra matches that of the training spectra (indicated by the green vertical line).
Fig. 3
Fig. 3
Dimensionality reduction and cross-validation reveal systematic differences among training datasets. (a) An LSTM-based network trained on each dataset is then applied to every other dataset, and all ϵsO2 (median absolute error in percentage points) can be visualized as a performance matrix. Dataset names are shortened for visibility but are detailed in Table 1. (b) UMAP projections of the four representative example datasets onto an embedding of all training data. (c) Mapping the ground truth sO2 onto the same projection reveals a correlation along the first UMAP axis.
Fig. 4
Fig. 4
Jensen–Shannon divergence (DJS) can predict estimation performance. (a) DJS correlates with the median absolute sO2 estimation error ϵsO2 when applying all networks, each trained on a distinct training dataset, to the BASE dataset. (b) DJS for the D2O flow phantom data, which shows a similar correlation with ϵsO2. (c) After removing two outliers, DJS shows the same degree of correlation with ϵsO2 for the H2O flow phantom data.
Fig. 5
Fig. 5
Estimation of flow phantom data highlights performance dependence on the training dataset. Three example images of the D2O flow phantom are shown at different time points (0, 22, 44 min) displaying (a) the photoacoustic signal intensity at 700 nm with a red contour marking the blood-carrying tube and (b) the sO2 estimations from different methods. We visually compare the performance of LU (c), LSD (d), and the LSTM-based method (e) by plotting the sO2 estimations over the same image section and time points shown in panel (a).
Fig. 6
Fig. 6
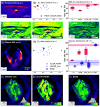
Jensen–Shannon divergence (DJS) proves valuable for in vivo data. LU and LSTM applied to measurements of the human forearm (a)–(f) and mice abdomens (g)–(l). Panels (a) and (g) show the photoacoustic signal at 800 nm, and panels (b) and (h) show the spread of DJS estimates for the training datasets. Panels (c) and (i) show boxplots of the highlighted regions of interest over all N=7 subjects. The horizontal lines show expected sO2 values for arterial blood (red) and mixed blood (blue). sO2 images are shown for models trained on a good fit [(d), (j)], a bad fit [(e), (k)], and the BASE dataset [(f), (l)] as predicted by DJS. On the bottom right of these images, the value distribution is shown as a grey histogram with the mean values of the regions of interest highlighted in their respective color.
Fig. 7
Fig. 7
Data-driven methods estimate an increased sO2 dynamic range during CO2 delivery compared to LU. A single representative mouse is shown here. Panels (a)–(d) show the photoacoustic image (a) and sO2 estimation results (b)–(d) 3 min before asphyxiation, and panels (e)–(h) show the photoacoustic image (e) and sO2 estimation results (f)–(h) 10 min after asphyxiation. We show sO2 estimates for LU [(b), (f)], the BASE [(c), (g)], and the best dataset as predicted by the Jensen–Shannon divergence [WATER_4cm (d), (h)]. Panels (a) and (e) show the outlines of the full-organ segmentations, and all other panels (b)–(d) and (f)–(h) show outlines of the segmented regions used in Table 2.

References

    1. Fawzy A., et al. , “Racial and ethnic discrepancy in pulse oximetry and delayed identification of treatment eligibility among patients with COVID-19,” JAMA Internal Med. 182(7), 730–738 (2022).10.1001/jamainternmed.2022.1906 - DOI - PMC - PubMed
    1. Beard P., “Biomedical photoacoustic imaging,” Interface Focus 1(4), 602–631 (2011).10.1098/rsfs.2011.0028 - DOI - PMC - PubMed
    1. Li M., Tang Y., Yao J., “Photoacoustic tomography of blood oxygenation: a mini review,” Photoacoustics 10, 65–73 (2018).10.1016/j.pacs.2018.05.001 - DOI - PMC - PubMed
    1. Knieling F., et al. , “Multispectral optoacoustic tomography for assessment of Crohn’s disease activity,” New Engl. J. Med. 376(13), 1292–1294 (2017).NEJMBH10.1056/NEJMc1612455 - DOI - PubMed
    1. Karlas A., et al. , “Cardiovascular optoacoustics: from mice to men—a review,” Photoacoustics 14, 19–30 (2019).10.1016/j.pacs.2019.03.001 - DOI - PMC - PubMed

Publication types