. 2024 Jun 4;10(3):e200162.
doi: 10.1212/NXG.0000000000200162. eCollection 2024 Jun.

Disease Progression and Multiparametric Imaging Characteristics of Spinocerebellar Ataxia Type 3 With Spastic Paraplegia

Affiliations

Disease Progression and Multiparametric Imaging Characteristics of Spinocerebellar Ataxia Type 3 With Spastic Paraplegia

Zhi-Xian Ye et al. Neurol Genet. .

Abstract

Background and objectives: Spinocerebellar ataxia type 3 (SCA3) is a hereditary ataxia that occurs worldwide. Clinical patterns were observed, including the one characterized by marked spastic paraplegia. This study investigated the clinical features, disease progression, and multiparametric imaging aspects of patients with SCA3.

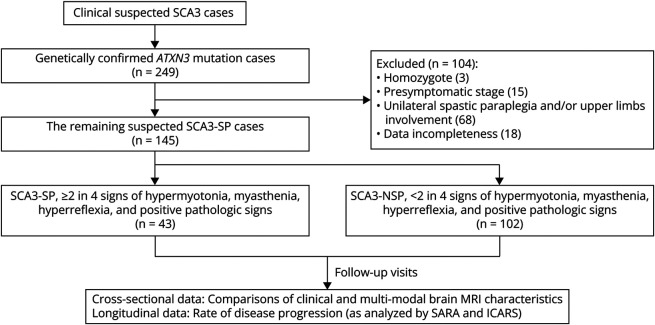
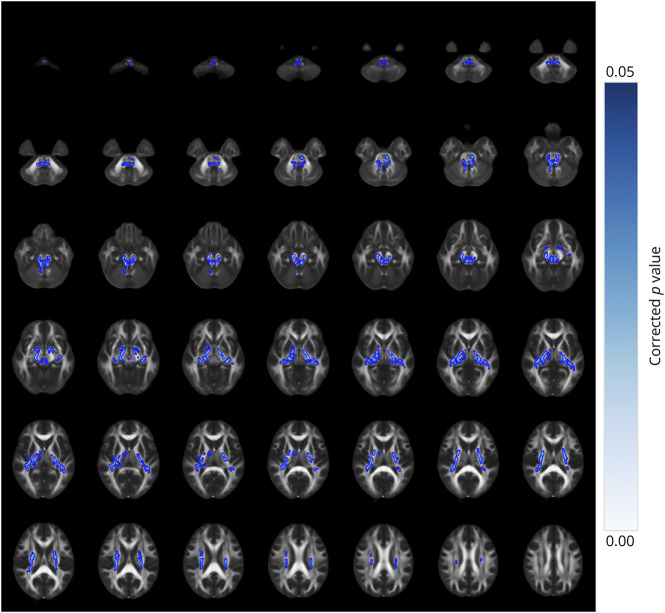
Methods: We retrospectively analyzed 249 patients with SCA3 recruited from the Organization for Southeast China for cerebellar ataxia research between October 2014 and December 2020. Of the 249 patients, 145 were selected and assigned to 2 groups based on neurologic examination: SCA3 patients with spastic paraplegia (SCA3-SP) and SCA3 patients with nonspastic paraplegia (SCA3-NSP). Participants underwent 3.0-T brain MRI examinations, and voxel-wise and volume-of-interest-based approaches were used for the resulting images. A tract-based spatial statistical approach was used to investigate the white matter (WM) alterations using diffusion tensor imaging, neurite orientation dispersion, and density imaging metrics. Multiple linear regression analyses were performed to compare the clinical and imaging parameters between the 2 groups. The longitudinal data were evaluated using a linear mixed-effects model.

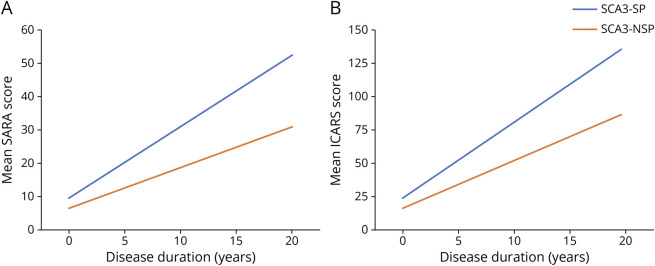
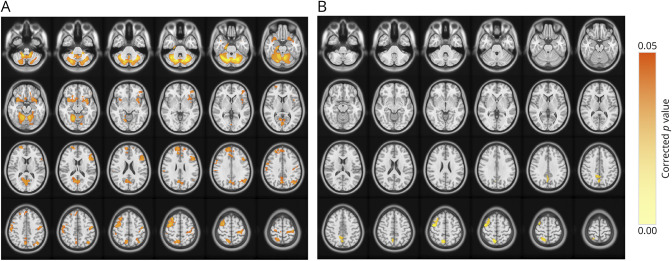
Results: Forty-three patients with SCA3-SP (mean age, 37.58years ± 11.72 [SD]; 18 women) and 102 patients with SCA3-NSP (mean age, 47.42years ± 12.50 [SD]; 39 women) were analyzed. Patients with SCA3-SP were younger and had a lower onset age but a larger cytosine-adenine-guanine repeat number, as well as higher clinical severity scores (all corrected p < 0.05). The estimated progression rates of the Scale for the Assessment and Rating of Ataxia (SARA) and International Cooperative Ataxia Rating Scale scores were higher in the SCA3-SP subgroup than in the SCA3-NSP subgroup (SARA, 2.136 vs 1.218 points; ICARS, 5.576 vs 3.480 points; both p < 0.001). In addition, patients with SCA3-SP showed gray matter volume loss in the precentral gyrus with a decreased neurite density index in the WM of the corticospinal tract and cerebellar peduncles compared with patients with SCA3-NSP.

Discussion: SCA3-SP differs from SCA3-NSP in clinical features, multiparametric brain imaging findings, and longitudinal follow-up progression.


Conflict of interest statement

The authors report no relevant disclosures. Go to Neurology.org/NG for full disclosures.

Figures

Figure 1
Figure 1. Flowchart on the Recruitment and Inclusion of the Participants in This Study
SCA3 = spinocerebellar ataxias type 3; SCA3-SP = SCA3 patients with spastic paraplegia; SCA3-NSP = SCA3 patients with nonspastic paraplegia.
Figure 2
Figure 2. Longitudinal Trajectories of Mean Scale for the Assessment and Rating of Ataxia (SARA) and International Cooperative Ataxia Rating Scale (ICARS) Scores for SCA3 Patients With Spastic Paraplegia (SCA3-SP) and SCA3 Patients With Nonspastic Paraplegia (SCA3-NSP) Using a Linear Mixed-Effects Model
(A–B) Longitudinal trajectories of mean SARA and ICARS scores showed lower progression for SCA3-SP than for SCA3-NSP. This observation included individuals sampled at different time points in the course of disease. Individuals were followed up for 0–5 visits. No individual was followed up for the full duration described on the x-axis. The graphs demonstrated the mean SARA and ICARS scores changes in the SCA3-SP and SCA3-NSP subgroups with covariates fixed at the following values: baseline age = 45 years, sex = male, baseline duration = 0 years, and the number of expanded CAG repeats = 75. Spaghetti plots demonstrating the change for individual participants are shown in eFigure 1.
Figure 3
Figure 3. Voxel-Based Morphometry Analyses of Brain GM Across Different Subgroups
(A) Regions showcasing reductions in brain GM volume among the SCA3 patients with spastic paraplegia (SCA3-SP) compared with healthy controls. (B) Regions showcasing reductions in brain GM volume among the patients with SCA3-SP when compared with the patients with nonspastic paraplegia (SCA3-NSP). A post hoc test, p < 0.05, FDR-corrected.
Figure 4
Figure 4. TBSS Analysis of Neurite Density Index (NDI) Metrics Across Different Subgroups
Depicted are brain regions characterized by reduced NDI values of the SCA3 patients with spastic paraplegia (SCA3-SP) when compared with SCA3 patients with nonspastic paraplegia (SCA3-NSP). A post hoc test, p < 0.05, FWE-corrected.

References

    1. Klockgether T, Mariotti C, Paulson HL. Spinocerebellar ataxia. Nat Rev Dis Primers. 2019;5(1):24. doi:10.1038/s41572-019-0074-3 - DOI - PubMed
    1. Da Silva J, Teixeira-Castro A, Maciel P. From pathogenesis to novel therapeutics for spinocerebellar ataxia type 3: evading potholes on the way to translation. Neurotherapeutics. 2019;16(4):1009-1031. doi:10.1007/s13311-019-00798-1 - DOI - PMC - PubMed
    1. Rüb U, Schöls L, Paulson H, et al. . Clinical features, neurogenetics and neuropathology of the polyglutamine spinocerebellar ataxias type 1, 2, 3, 6 and 7. Prog Neurobiol. 2013;104:38-66. doi:10.1016/j.pneurobio.2013.01.001 - DOI - PubMed
    1. Pedroso JL, Franca MC Jr., Braga-Neto P, et al. . Nonmotor and extracerebellar features in Machado-Joseph disease: a review. Mov Disord. 2013;28(9):1200-1208. doi:10.1002/mds.25513 - DOI - PubMed
    1. Durr A. Autosomal dominant cerebellar ataxias: polyglutamine expansions and beyond. Lancet Neurol. 2010;9:885-894. doi:10.1016/S1474-4422(10)70183-6 - DOI - PubMed