. 2024 Dec 1;109(12):3904-3917.
doi: 10.3324/haematol.2023.284357.

IKZF1 gene deletions drive resistance to cytarabine in B-cell precursor acute lymphoblastic leukemia

Affiliations

IKZF1 gene deletions drive resistance to cytarabine in B-cell precursor acute lymphoblastic leukemia

Britt M T Vervoort et al. Haematologica. .

Abstract

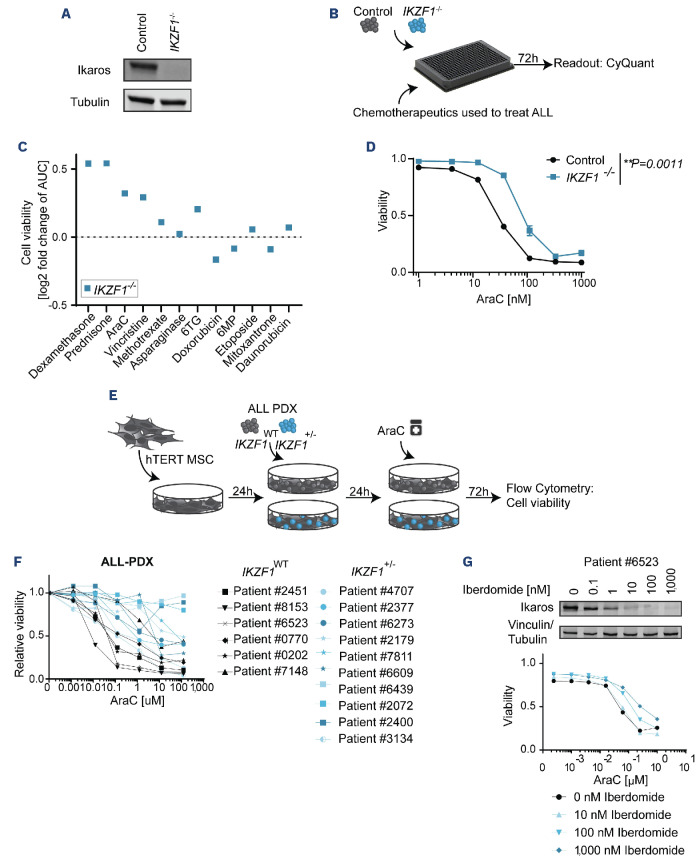
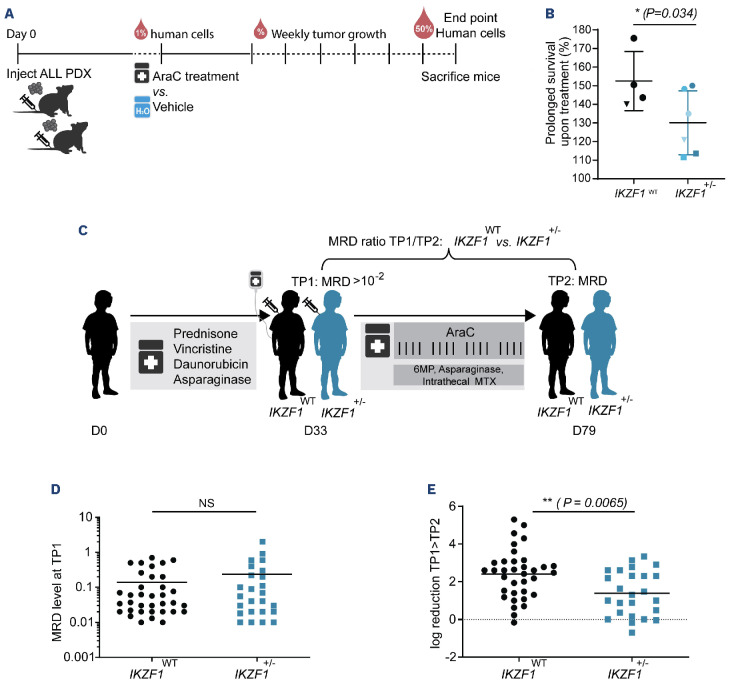
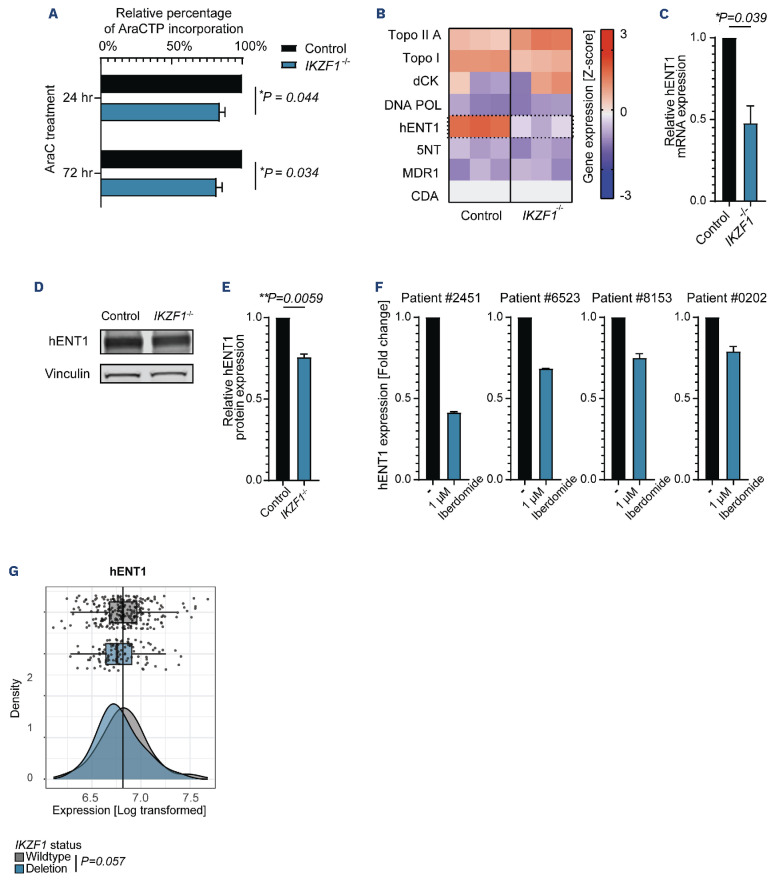
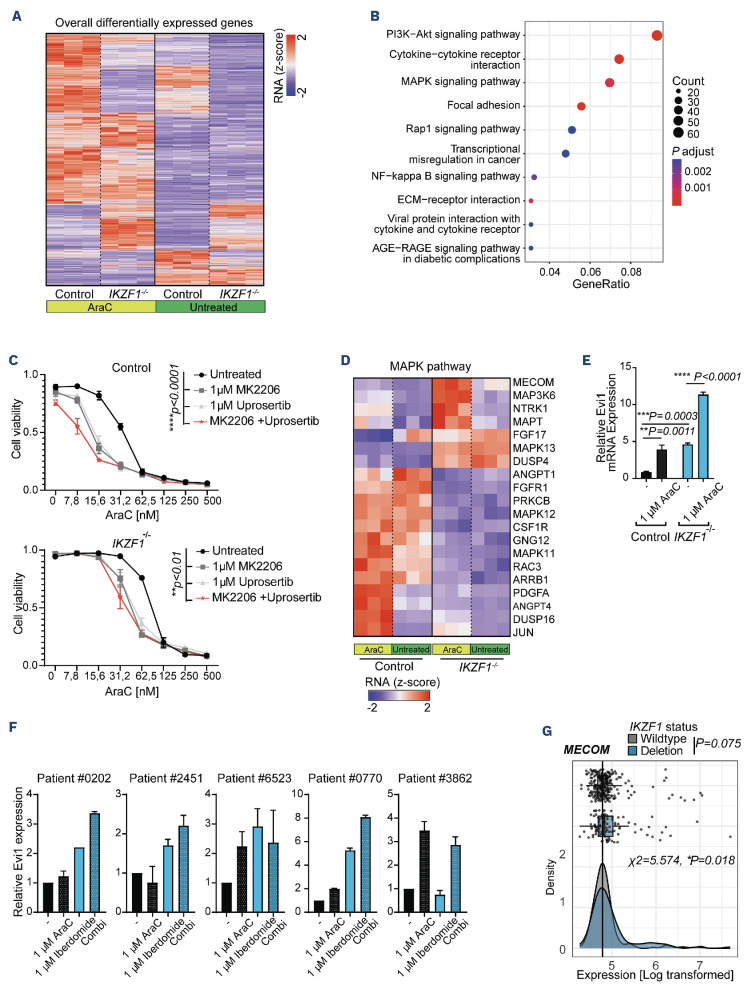
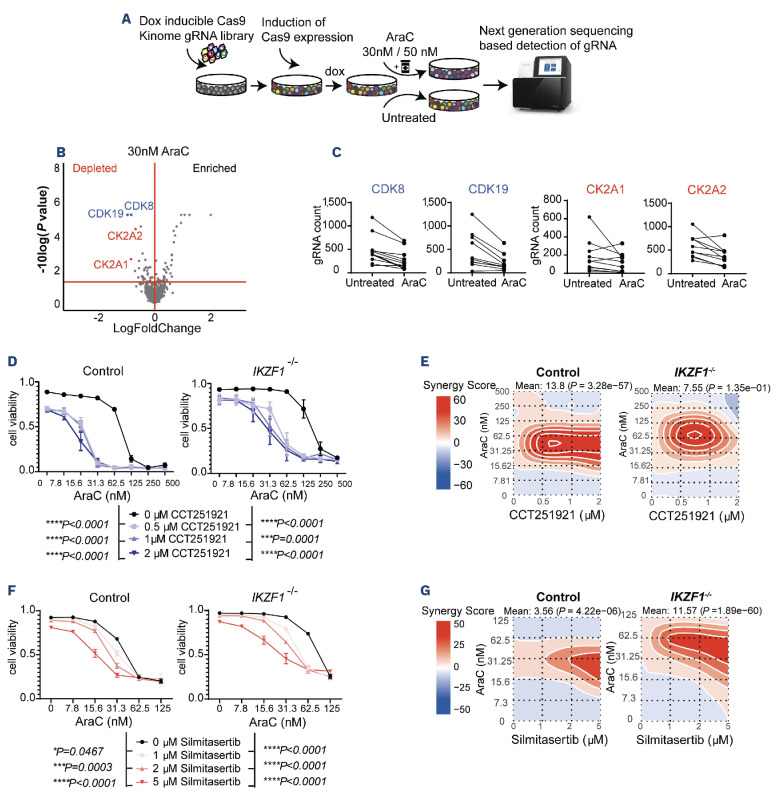
IKZF1 deletions occur in 10-15% of patients with B-cell precursor acute lymphoblastic leukemia (BCP-ALL) and predict a poor outcome. However, the impact of IKZF1 loss on sensitivity to drugs used in contemporary treatment protocols has remained underexplored. Here we show in experimental models and in patients that loss of IKZF1 promotes resistance to cytarabine (AraC), a key component of both upfront and relapsed treatment protocols. We attribute this resistance, in part, to diminished import and incorporation of AraC due to reduced expression of the solute carrier hENT1. Moreover, we found elevated mRNA expression of Evi1, a known driver of therapy resistance in myeloid malignancies. Finally, a kinase directed CRISPR/Cas9-screen identified that inhibition of either mediator kinases CDK8/19 or casein kinase 2 can restore response to AraC. We conclude that this high-risk group of patients could benefit from alternative antimetabolites, or targeted therapies that re-sensitize leukemic cells to AraC.


Figures

Figure 1.
Figure 1.
Deletion of IKZF1 drives resistance to AraC in vitro. (A) Immunoblot analysis of IKZF1 protein expression in single cell clones upon CRISPR/Cas9-based targeting of IKZF1. Representative blot of three independent experiments. (B) Schematic overview representing the workflow used to determine drug responses. Sem wild-type (WT) and Sem IKZF1-deleted (IKZF1-/-) cells were seeded into 384-well plates and treated with drugs used in contemporary treatment protocols for pediatric B-cell precursor acute lymphoblastic leukemia (BCP-ALL) patients. After 3 days of incubation, cell death was analyzed by fluorescence intensity using the live cell staining CyQuant. (C) Fold change in cell viability relative to cells wild-type for IKZF1 upon drug exposure. Corresponding dose response curves can be found in Online Supplementary Figure S1. (D) Cytarabine (AraC)-induced cell death as determined by quantification of cells positive for amine-reactive dyes using flow cytometry in Sem WT and Sem IKZF1-/- cells after 3 days of treatment with increasing concentrations of AraC (mean ± standard error of the mean [SEM], N=3, **P=0.0011, two-sided t test based on area under curve values). (E) Schematic overview representing the workflow used to determine ex-vivo drug responses in patient-derived xenograft (PDX) samples. BCP-ALL PDX, either WT or carrying a heterozygous clonal deletion of IKZF1 (IKZF1+/-), were seeded on hTERT immortalized mesenchymal stem cells, allowed to settle for 24 hr and then treated with increasing concentrations of AraC. After 3 days of incubation cell death was determined by quantification of cells positive for amine-reactive dyes using flow cytometry. (F) Cell viability determined by amine staining in PDX either WT (black, n=6) or IKZF1+/- (blue, n=10) as dose response curves. Of note, the least responsive WT sample, Patient #7148, harbors a t(17::19), a chromosomal translocation known to induce multiagent drug resistance; such patients have an extremely poor prognosis. (G) Representative PDX sample for pharmacological targeting of the Ikaros protein using Iberdomide. Immunoblot analysis of IKZF1 protein expression showing degradation of IKZF1 protein in response to Iberdomide treatment after 24 hours. in different PDX samples. AraC induced cell death was determined by quantification of cells positive for amine-reactive dyes using flow cytometry after 3 days of treatment with increasing concentrations of AraC in the presence or absence of the indicated doses of iberdomide. Results for other tested PDX samples (N=6) can be found in Online Supplementary Figure S2D. ALL: acute lymphoblastic leukemia; AUC: area under the curve; 6TG: 6-thioguanine; MSC: mesenchymal stem cells.
Figure 2.
Figure 2.
IKZF1-deleted leukemias show resistance to AraC in vivo. (A) Timeline of the in vivo mouse trial. Each B-cell precursor acute lymphoblastic leukemia (BCP-ALL) patient-derived xenograft (PDX) was injected into two mice at day 0 and leukemia growth was measured weekly by flow cytometry. At 1% of human cells in the blood, mice were treated twice for 5 days with a break of 2 days in between, one of the pair receiving cytarabine (AraC) and the other vehicle. Leukemia growth was tracked weekly by flow cytometry and mice were sacrificed when there were >50% human cells in the blood. (B) In vivo delay of leukemia growth upon AraC treatment in PDX wildtype (WT) for IKZF1 and samples with heterozygous clonal deletion of IKZF1 (IKZF1+/-) (mean ± standard error of the mean, *P=0.034, two-sided t test). (C) Schematic overview representing the workflow used to determine minimal residual disease (MRD) response in BCP-ALL patients in relation to IKZF1. Cases were selected that showed MRD levels >10-2 at timepoint 1 (TP1, day 33) and the response at timepoint 2 (TP2, day 79) was followed. (D) MRD levels at TP1 of patients WT for IKZF1 (N=35) or patients carrying a heterozygous deletion of IKZF1 (N=25). P=0.7867, Mann-Whitney, two-tailed test. (E) Ratio of MRD between TP1 and TP2 log10-transformed (TP1>TP2) of patients WT for IKZF1 or carrying a heterozygous deletion of IKZF1 after receiving a therapy block including AraC and 6-mercaptopurine **P=0.0065, Mann-Whitney, two-tailed test. 6-MP: 6-mercaptopurine; MTX: methotrexate; NS: not statistically significant.
Figure 3.
Figure 3.
Decreased expression of solute carrier ENT1 observed upon loss of IKZF1. (A) Mass spectrometry was used to measure the AraC incorporated into DNA in Sem wild-type versus Sem IKZF1-/- cells after treatment with AraC. The measurement of incorporation is expressed as ng AraC per mg 2dC after 24 hr and 72 hr of treatment with AraC. After 24 hr there were 0.654 ng in wild-type cells versus 0.552 ng in IKZF1-/- cells, the ratio being comparable to that found after 72 hr (1.78 ng and 1.47 ng in wild-type vs. IKZF1-/- cells) (mean ± standard error of mean [SEM], N=3, *P=0.044 and *P=0.034 unpaired t test, two-tailed). (B) Gene expression levels from an RNA-sequencing dataset, shown as Z-score, of genes associated with cytarabine (AraC) resistance in either B-cell precursor acute lymphoblastic leukemia (BCP-ALL) or acute myeloid leukemia show decreased expression of hENT1 in Sem IKZF1-/- cells versus control cells. (C) Validation of mRNA expression of hENT1 by real-time quantitative polymerase chain reaction (RT-qPCR) in Sem IKZF1-/- cells versus control cells (mean ± SEM, N=3, *P=0.034, unpaired t test two-tailed). (D) Representative western blot showing protein expression of hENT1 in Sem IKZF1-/- cells versus control cells. (E) Quantification of hENT1 protein expression (mean ± SEM, N=3, **P=0.0059, unpaired t test two-tailed). (F) mRNA expression of hENT1 by RT-qPCR in four different BCP-ALL patient-derived xenograft samples, pretreated with iberdomide for 24 hr to break down the Ikaros protein (mean ± SEM, N=2 technical duplicate). (G) hENT1 expression in patients harboring an IKZF1 deletion (N=100) versus patients wild-type for IKZF1 (N=252), extracted from the Gene Expression Omnibus database of patients (Ref: GSE87070). We included the BCP-ALL subtypes that have ≥3 IKZF1del patients in this database, combining B-other group, high hyperdiploid and BCR-ABL1-like cases.
Figure 4.
Figure 4.
Gene expression changes in the MAPK pathway reveal upregulated expression of Evi1 (MECOM) in IKZF1-/- cells. (A) Compiled heatmap created by unsupervised clustering of genes differentially expressed in response to cytarabine (AraC) treatment or as a result of IKZF1 loss from bulk RNA-sequencing data on Sem IKZF1-/- and control cells. Cells were treated with 1 mM AraC for 16 hr and samples were harvested in triplicate. (B) KEGG pathway overrepresentation analysis was performed on the compiled list of differentially expressed genes from (A), with the ten highest scoring pathways shown here. (C) Cell viability determined in Sem IKZF1+/- and control cells by amine staining as dose-response curves for AraC treatment in combination with the AKT inhibitor MK2206 and the ERK inhibitor uprosertib (mean ± standard error of mean [SEM], N=3, **P=0.0011, analysis of variance [ANOVA] followed by the Tukey multiple comparisons test). (D) Heatmap created by unsupervised clustering of the MAPK pathway, only showing genes differentially expressed between control and IKZF1-/- cells upon AraC treatment. The heatmap was created using the FPKM (fragments per kilobase of transcript per million mapped reads) values transformed into Z-scores. (E) Validation of Evi1 (MECOM) mRNA expression by real-time quantitative polymerase chain reaction (RT-qPCR) in Sem IKZF1-/- cells versus control cells upon treatment with 1 mM AraC for 16 hr (mean ± SEM, N=3, ANOVA followed by the Tukey multiple comparisons test). (F) mRNA expression of MECOM by RT-qPCR in five different B-cell precursor acute lymphoblastic leukemia (BCP-ALL) patient-derived xenograft samples, pretreated with iberdomide for 24 hr (mean ± SEM, N=2 technical duplicate). (G) MECOM expression in patients harboring an IKZF1 deletion (N=100) versus patients wild-type for IKZF1 (N=352), extracted from the Gene Expression Omnibus database (GSE87070). Here we included those BCP-ALL subtypes that had ≥3 IKZF1del patients in this database, combining here the B-other, BCR-ABL1-like and high hyperdiploid subgroups. A c test was performed to calculate the correlation between IKZF1 mutations and elevated Evi1 expression (χ=5.574, *P=0.018).
Figure 5.
Figure 5.
CRISPR/Cas9 kinome screen revealed targetable genes to sensitize cells to AraC treatment. (A) Schematic representation of our CRISPR screening strategy. Sem IKZF1-/- cells were transduced with a kinome sgRNA library and cultured for 2 weeks in the presence of 1 mg/mL doxycyclin to induce Cas9 expression. Cells were then split into three pools and treated for 22 days with either 0 nM, 30 nM or 50 nM cytarabine (AraC). DNA was isolated and subjected to Illumina next-generation sequencing. (B) Vulcano-plot of sgRNA targets that significantly modulate response to AraC, based on P value and log-fold change as analyzed using the MaGeCK test algorithm. The top depleted genes overlap between the 30 nM and 50 nM AraC (Online Supplementary Figure S6C) screens, as marked in red. (C) Counts of individual sgRNA targeting CDK8, CDK19, CK2A1 and CK2A2 between the untreated cells and cells treated with 30 nM AraC after screening for 22 days. (D) Combination therapy-induced cell death as determined by quantification of cells positive for amine-reactive dyes using flow cytometry in Sem control and Sem IKZF1-/- cells after 5 days of treatment with increasing concentrations of AraC and the CDK8/19 inhibitor CCT251921. Each data point represents a mean (± standard error of mean [SEM]) of three independent experiments. Two-way analysis of variance (ANOVA) was performed on the area under the curve (AUC) values of the inhibitor in combination with AraC versus AraC as a single treatment, for both genotypes (***P<0.001, ****P<0.0001). Absolute half-maximal inhibitory concentration (IC50) values in wild-type cells were 80.8 nM for AraC only versus 14.9 nM in combination with 2 mM CCT251921 and 155.8 nM for only AraC and 30.9 nM for the combination in IKZF1-/- cells. (E) Synergy scores generated by Synergy finder software, using the values from Figure 5D. (F) Combination therapy-induced cell death as determined by quantification of cells positive for amine-reactive dyes using flow cytometry in Sem control and Sem IKZF1-/- cells after 5 days of treatment with increasing concentrations of AraC and the CK2 inhibitor sil-mitasertib. Each data point represents a mean (± SEM) of three independent experiments. Two-way ANOVA is performed on the AUC values of the inhibitor in combination with AraC versus AraC as a single treatment, for both genotypes (*P<0.05, **P<0.01, ***P<0.001, ****P<0.0001). Absolute IC50 values in wild-type cells were 35.9 nM for AraC only versus 15.7 nM in combination with 2 mM CCT251921 and 69.2 nM for only AraC and 19.6 nM for the combination in IKZF1-/- cells. (G) Synergy scores generated by Synergy finder software, using the values from Figure 5F.

References

    1. Reedijk AM, Coebergh JWW, de Groot-Kruseman HA, et al. . Progress against childhood and adolescent acute lymphoblastic leukaemia in the Netherlands, 1990-2015. Leukemia. 2021;35(4):1001-1011. - PMC - PubMed
    1. Dixon SB, Chen Y, Yasui Y, et al. . Reduced morbidity and mortality in survivors of childhood acute lymphoblastic leukemia: a report from the childhood cancer survivor study. J Clin Oncol. 2020;38(29):3418-3429. - PMC - PubMed
    1. Pieters R, de Groot-Kruseman H, Van der Velden V, et al. . Successful therapy reduction and intensification for childhood acute lymphoblastic leukemia based on minimal residual disease monitoring: study ALL10 from the Dutch Childhood Oncology Group. J Clin Oncol. 2016;34(22):2591-2601. - PubMed
    1. Mullighan CG, Su X, Zhang J, et al. . Deletion of IKZF1 and prognosis in acute lymphoblastic leukemia. N Engl J Med. 2009;360(5):470-480. - PMC - PubMed
    1. Kuiper R, Waanders E, Van Der Velden V, et al. . IKZF1 deletions predict relapse in uniformly treated pediatric precursor B-ALL. Leukemia. 2010;24(7):1258-1264. - PubMed

MeSH terms

LinkOut - more resources