. 2024 Oct;20(10):2238-2254.
doi: 10.1080/15548627.2024.2361580. Epub 2024 Jun 11.

ATG10S promotes IFNL1 expression and autophagic degradation of multiple viral proteins mediated by IFNL1

Affiliations

ATG10S promotes IFNL1 expression and autophagic degradation of multiple viral proteins mediated by IFNL1

Miao-Qing Zhang et al. Autophagy. 2024 Oct.

Abstract

ATG10S is a newly discovered subtype of the autophagy protein ATG10. It promotes complete macroautophagy/autophagy, degrades multiple viral proteins, and increases the expression of type III interferons. Here, we aimed to investigate the mechanism of ATG10S cooperation with IFNL1 to degrade viral proteins from different viruses. Using western blot, immunoprecipitation (IP), tandem sensor RFP-GFP-LC3B and in situ proximity ligation assays, we showed that exogenous recombinant ATG10S protein (rHsATG10S) could enter into cells through clathrin, and ATG10S combined with ATG7 with IFNL1 assistance to facilitate ATG12-ATG5 conjugation, thereby contributing to the autophagosome formation in multiple cell lines containing different virions or viral proteins. The results of DNA IP and luciferase assays also showed that ATG10S was able to directly bind to a core motif (CAAGGG) within a binding site of transcription factor ZNF460 on the IFNL1 promoter, by which IFNL1 transcription was activated. These results clarified that ATG10S promoted autophagosome formation with the assistance of IFNL1 to ensure autophagy flux and autophagic degradation of multiple viral proteins and that ATG10S could also act as a novel transcription factor to promote IFNL1 gene expression. Importantly, this study further explored the antiviral mechanism of ATG10S interaction with type III interferon and provided a theoretical basis for the development of ATG10S into a new broad-spectrum antiviral protein drug.Abbreviation: ATG: autophagy related; ATG10S: the shorter isoform of autophagy-related 10; CC50: half cytotoxicity concentration; CCV: clathrin-coated transport vesicle; CLTC: clathrin heavy chain; CM: core motif; co-IP: co-immunoprecipitation; CPZ: chlorpromazine; ER: endoplasmic reticulum; HCV: hepatitis C virus; HBV: hepatitis B virus; HsCoV-OC43: Human coronavirus OC43; IFN: interferon; PLA: proximity ligation assay; rHsATG10S: recombinant human ATG10S protein; RLU: relative light unit; SQSTM1: sequestosome 1; ZNF: zinc finger protein.

Keywords: ATG10S; IFNL1 expression; ZNF460; autophagic degradation; core motif; viral proteins.


Conflict of interest statement

No potential conflict of interest was reported by the author(s).

Figures

Figure 1.
Figure 1.
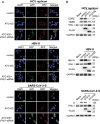
rHsATG10S decreases various viral protein levels and increases autophagy flux. (A) the levels of viral proteins (HCV-CORE/NS5B, HBV-X, and HsCoV-OC43-S), autophagy proteins (LC3B and SQSTM1), and IFNL1 protein were detected by western blot analysis in HCV, HBV, and HsCoV-OC43 virion cells exposed to rHsATG10S at concentrations of 1.25, 2.5, and 5 μM. GAPDH was used as a loading control. One representative example of five independent experiments is shown. (B) the levels of viral proteins (HCV-CORE/NS5B, HBV-X, and SARS-CoV-2-S), autophagy proteins (LC3B and SQSTM1), and IFNL1 protein were determined by western blot in HepG2-(HCV replicon), HepG2-(HBV-X), and A549-(SARS-CoV-2-S) cells treated with rHsATG10S at concentrations of 1.25, 2.5, and 5 μM. ctrl indicates the non-transfection control group. GAPDH was used as a loading control. One representative example of five independent experiments is shown.
Figure 2.
Figure 2.
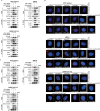
rHsATG10S enhances autophagy flux to degrade viral proteins with the assistance of IFNL1. (A) HepG2-(HCV replicon), HepG2-(HBV-X), and A549-(SARS-CoV-2-S) cells were exposed to 5 μM rHsATG10S. The interactions among autophagy proteins (LC3B, LAMP2, SQSTM1), viral proteins (HCV-CORE/NS5B, HBV-X, and SARS-CoV-2-S), and IFNL1 were detected by co-IP with anti-LC3B and anti-LAMP2 antibodies. The levels of autophagy proteins (LC3B, LAMP2, SQSTM1), viral proteins (HCV-CORE/NS5B, HBV-X, and SARS-CoV-2-S), and IFNL1 were determined by western blotting (input). One representative example of three independent experiments is shown. (B) Autophagy tandem sensor RFP-GFP-LC3B assay was employed to assess the autophagy flux in HepG2-(HCV replicon), HepG2-(HBV-X), and A549-(SARS-CoV-2-S) cells treated with 5 μM rHsATG10S, either alone or in combination with IFNL1-siRNA. One representative cell of n = 7 cells. Scar bar: 15 μm. (C) Western blot analysis was carried out to determine the levels of viral proteins (HCV-CORE/NS5B, HBV-X, and SARS-CoV-2-S) and autophagy proteins (LC3B and SQSTM1) after IFNL1 knockdown in HepG2-(HCV replicon), HepG2-(HBV-X), and A549-(SARS-CoV-2-S) cells treated with 5 μM rHsATG10S. GAPDH was used as a loading control. One representative example of five independent experiments is shown.
Figure 3.
Figure 3.
Endogenous ATG10S overexpression enhances autophagic flux and suppresses the viral protein levels. (A) Assessment of autophagic flux using autophagy tandem sensor RFP-GFP-LC3B in cells of HepG2 with HCV replicon, HepG2 with HBV-X, and A549 with SARS-CoV-2-S. The cells were transfected with ATG10S mRNA with a FLAG-tagging alone or co-transfected with ATG10S mRNA and IFNL1-siRNA. The controls indicate groups without the transfection but with the designated viral proteins. Arepresentative viewing field of seven observation fields is shown for each group. Scar bar: 15 μm. (B) Western blot analysis of viral proteins (HCV-CORE/NS5B, HBV-X and SARS-COV-2-S) and IFNL1 levels in HepG2 with HCV replicon, HepG2 with HBV-X, and A549 with SARS-CoV-2-S cells transfected with ATG10S and ATG10 mRNAs. The FLAG blots indicate the expression level of FLAG-ATG10 or FLAG-ATG10S. The blanks indicate the non-transfection controls, and the controls indicate the groups without the FLAG-ATG10S/-ATG10 transfection but with the designated viral proteins. GAPDH was used as a loading control. One representative example of five independent experiments is shown.
Figure 4.
Figure 4.
ATG10S facilitates ATG7-dependent ATG12–ATG5 conjugation with IFNL1 assistance. (A) in HepG2-(HCV replicon), HepG2-(HBV-X), and A549-(SARS-CoV-2-S) cells, transfection with ATG10S mRNA tagged with FLAG alone or co-transfection with ATG10S mRNA and IFNL1-siRNA/control-siRNA was performed. The interactions among ATG10S, ATG12–ATG5 conjugate, ATG7, and IFNL1 were assessed via co-IP with anti-FLAG antibody. The levels of ATG12–ATG5 conjugate, ATG7, IFNL1, and FLAG-ATG10S were determined by western blotting (input). One representative example of three independent experiments is shown. (B) HepG2-(HCV replicon), HepG2-(HBV-X), and A549-(SARS-CoV-2-S) cells transfected with ATG10S mRNA tagged with FLAG alone or co-transfected with ATG10S mRNA and IFNL1-siRNA/ATG7-siRNA were examined for endogenous physical interactions among ATG5, ATG12, ATG7, ATG10S, and IFNL1 using in situ PLA (red fluorescent puncta) and visualized by fluorescence microscopy. The ATG5, ATG12, ATG7, FLAG, and IFNL1 antibodies labeled only were used as antibody specificity controls for the ATG12–ATG5, ATG7-FLAG (ATG10S), IFNL1-ATG7, ATG5-FLAG (ATG10S), and FLAG (ATG10S)-IFNL1 PLA assays. Nuclei were counterstained blue by DAPI. One representative cell of n = 7 cells. Scale bars: 5 μm. (C) the viral protein-containing cells were transfected with FLAG-ATG10S mRNA alone or co-transfected with FLAG-ATG10S mRNA and ATG7-siRNA/control-siRNA, co-IP with anti-FLAG antibody was conducted to analyze the interaction among ATG10S, ATG12–ATG5 conjugate, and IFNL1, while the levels of ATG12–ATG5 conjugate, IFNL1, ATG7, and FLAG-ATG10S were assessed using western blotting (input). One representative example of three independent experiments is shown.
Figure 5.
Figure 5.
ATG10S acts as a transcription factor to promote the IFNL1 gene expression. (A and B) IFNL1 mRNA levels were assessed by qRT-PCR in virion cells (HCV, HBV and HsCoV-OC43) (A) or viral proteins-containing cells (HCV replicon, HBV-X, and SARS-CoV-2-S) (B) exposed to rHsATG10S at concentrations of 1.25, 2.5, and 5 μM. *p < 0.05, **p < 0.01, ***p < 0.001 vs rHsATG10S at 0 μM treatment group. The statistics data are expressed as the mean ± standard deviation (SD) (n = 3). (C) Induction of IFNL1 expression was detected by qRT-PCR in HepG2-(HCV replicon), HepG2-(HBV-X), and A549-(SARS-CoV-2-S) cells transfected with ATG10 or ATG10S mRNAs. *** p < 0.001 vs control group. The statistics data are expressed as the mean ± SD (n = 3). (D) the nucleus (N)-cytoplasm (C) distribution of rHsATG10S and rHsATG10 in HepG2-(HCV replicon), HepG2-(HBV-X), and A549-(SARS-CoV-2-S) cells exposed to rHsATG10S protein by nuclear – cytoplasmic fractionation analysis. The protein levels of rHsATG10S and rHsATG10 in the nucleus and cytoplasm were detected by western blotting with anti-His antibody. LMNB1 was used as a nuclear marker, and HSP90 was used as a cytoplasmic marker. One representative example of three independent experiments is shown. (E) Subcellular co-localization of CLTC and His-rHsATG10S in HepG2-(HCV replicon), HepG2-(HBV-X), and A549-(SARS-CoV-2-S) cells treated with rHsATG10S protein (5 μM, 30 min). The cells were immunostained with anti-CLTC (green) and anti-His (red). One representative cell of 7 cells. Scale bars: 12 μm. (F) Quantification of the colocalization of rHsATG10S with CLTC described in E, using Pearson’s colocalization coefficients. Mean ± SD of 7 cells. (G) Clathrin-coated transport vesicle (CCV) fractions from HepG2-(HCV replicon), HepG2-(HBV-X), and A549-(SARS-CoV-2-S) cells treated with His-tagged rHsATG10S for 30 min were analyzed by western blot. CLTC was used as a loading control. One representative example of three independent experiments is shown. (H) DNA IP analysis demonstrates ATG10S binding to the IFNL1 gene promoter sequence in A549 cells transfected with FLAG-ATG10S mRNA. Cell lysates were immunoprecipitated with an anti-FLAG antibody, and the IFNL1 gene promoter sequence was detected by qRT-PCR. *** p < 0.001. The statistics data are expressed as the mean ± SD (n = 8). (I) IFNL1 promoter-driven luciferase activity was measured by luciferase assay under ATG10S and ATG10 overexpression in A549 cells. RLU, relative light unit. *** p < 0.001 vs. control group. The statistics data are expressed as the mean ± SD (n = 6).
Figure 6.
Figure 6.
ATG10S cooperates with ZNF460 to enhance IFNL1 gene transcription. (A) Schematic diagram of the L1P, L1P1, and L1P2 regions of the IFNL1 gene promoter. The luciferase reporter vectors were constructed by cloning the L1P and L1P1 fragments into the pGL3.0-basic (top). Transcription activity driven by L1P and L1P1 constructs under ATG10S overexpression was detected by luciferase assay in A549 cells (bottom). RLU, relative light unit. *** p < 0.001 vs control group. The statistics data are expressed as the mean ± SD (n = 3). (B) HepG2-(HCV replicon), HepG2-(HBV-X), and A549-(SARS-CoV-2-S) cells were transfected with ATG10S mRNA (FLAG tagging). Co-IP with anti-FLAG antibody was used to validate the interaction between ATG10S and ZNF460 or MEF2A. One representative example of three independent experiments is shown. (C and D) qRT-PCR assay determined the mRNA levels of ZNF460 (C) and MEF2A (D). The statistics data are expressed as the mean ± SD (n = 6). (E) Transcription activity driven by L1P under ATG10S, ZNF460, and MEF2A overexpression was detected by luciferase assay in A549 cells. RLU, relative light unit. *** p < 0.001 vs control group. The statistics data are expressed as the mean ± SD (n = 6). (F) DNA IP analysis of ZNF460 or MEF2A binding to the IFNL1 gene promoter DNA in A549 cells. The cell lysates were immunoprecipitated with anti-FLAG antibody, and IFNL1 gene promoter DNA was detected by qRT-PCR. *** p < 0.001 vs control. The statistics data are expressed as the mean ± SD (n = 8). (G) Luciferase activity assay shows the action of ATG10S on L1P transcription activity in A549 cells after the knockdown of endogenous ZNF460 or MEF2A. RLU, relative light unit. *** p < 0.001 vs non-treated group, ### p < 0.001 vs ATG10S overexpression plus control-siRNA group. The statistics data are expressed as the mean ± SD (n = 6). (H) DNA IP assay shows the binding activity of ATG10S to IFNL1 promoter DNA in A549 cells after knocking down endogenous ZNF460. The cell lysates were immunoprecipitated with anti-FLAG antibody, and IFNL1 gene promoter DNA was detected by qRT-PCR. *** p < 0.001 vs. non-treated group, ### p < 0.001 vs. ATG10S overexpression plus control-siRNA group. The statistics data are expressed as the mean ± SD (n = 8).
Figure 7.
Figure 7.
ATG10S binds to a core motif within a ZNF460 binding site to activate IFNL1 transcription. (A) Luciferase activity driven by L1P under co-transfected with ZNF460 mRNA in A549 cells after the knockdown of endogenous ATG10S was examined by luciferase assay. RLU, relative light unit. *** p < 0.001 vs. non-treated group, ## p < 0.01 vs. ZNF460 overexpression plus control-siRNA group. The statistics data are expressed as the mean ± SD (n = 6). (B) Diagram of a series of sequence deletions, including three predicted ZNF460-binding sites (Z1, Z2 and Z3), three oligodeoxynucleotides in Z1 and six nucleotide-point mutations within the core motif of the IFNL1 L1P2 sequence. These mutants as promoters were separately cloned into pGL3-basic vectors. (C) Luciferase assay examining transcriptional activity driven by three predicted ZNF460 binding sites deletion mutants (ΔZ1, ΔZ2, and ΔZ3) under ZNF460 overexpression in A549 cells. RLU, relative light unit. *** p < 0.001 vs non-ZNF460 overexpression group, ### p < 0.001 vs L1P group. The statistics data are expressed as the mean ± SD (n = 4). (D-F) Transcription activity driven by the deletion mutants of three predicted ZNF460 binding sites (ΔZ1, ΔZ2, and ΔZ3) (D), three oligodeoxynucleotide-deleted mutants (ΔΔ1, ΔΔ2, and ΔΔ3) (E), and six point mutants (CM1[C>T], CM2[C>T], CM3[A>C], CM4[G>T], CM5[G>T], and CM6[G>T]) (F) under ATG10S overexpression was examined by luciferase assay in A549 cells. RLU, relative light unit. *** p < 0.001 vs. non-ATG10S overexpression group, ### p < 0.001 vs. L1P group. The statistics data of D and E are expressed as the mean ± SD (n = 4). The statistics data of F are expressed as the mean ± SD (n = 3).
Figure 8.
Figure 8.
Schematic illustration depicts that exogenous rHsATG10S enters into cells via clathrin and that ATG10S plays a role in promoting IFNL1 expression and mediating autophagic degradation of multiple viral proteins via IFNL1. This diagram was generated using BioRender.com.

References

    1. Korber B, Fischer WM, Gnanakaran S, et al. Tracking changes in SARS-CoV-2 spike: evidence that D614G increases Infectivity of the COVID-19 Virus. Cell. 2020;182(4):812–827.e19. doi: 10.1016/j.cell.2020.06.043 - DOI - PMC - PubMed
    1. Riediker M, Briceno-Ayala L, Ichihara G, et al. Higher viral load and infectivity increase risk of aerosol transmission for delta and omicron variants of SARS-CoV-2. Swiss Med Wkly. 2022;152(102):w30133. doi: 10.4414/SMW.2022.w30133 - DOI - PubMed
    1. Barth S, Glick D, Macleod KF.. Autophagy: assays and artifacts. J Pathol. 2010;221(2):117–124. doi: 10.1002/path.2694 - DOI - PMC - PubMed
    1. Nishida Y, Arakawa S, Fujitani K, et al. Discovery of Atg5/Atg7-independent alternative macroautophagy. Nature. 2009;461(7264):654–658. doi: 10.1038/nature08455 - DOI - PubMed
    1. Kabeya Y, Mizushima N, Ueno T, et al. LC3, a mammalian homologue of yeast Apg8p, is localized in autophagosome membranes after processing. Embo J. 2000;19(21):5720–5728. doi: 10.1093/emboj/19.21.5720 - DOI - PMC - PubMed

Publication types

MeSH terms

LinkOut - more resources