. 2024 Jul 1;132(1):206-225.
doi: 10.1152/jn.00264.2023. Epub 2024 Jun 6.

The primate cortical LFP exhibits multiple spectral and temporal gradients and widespread task dependence during visual short-term memory

Affiliations

The primate cortical LFP exhibits multiple spectral and temporal gradients and widespread task dependence during visual short-term memory

Steven J Hoffman et al. J Neurophysiol. .

Abstract

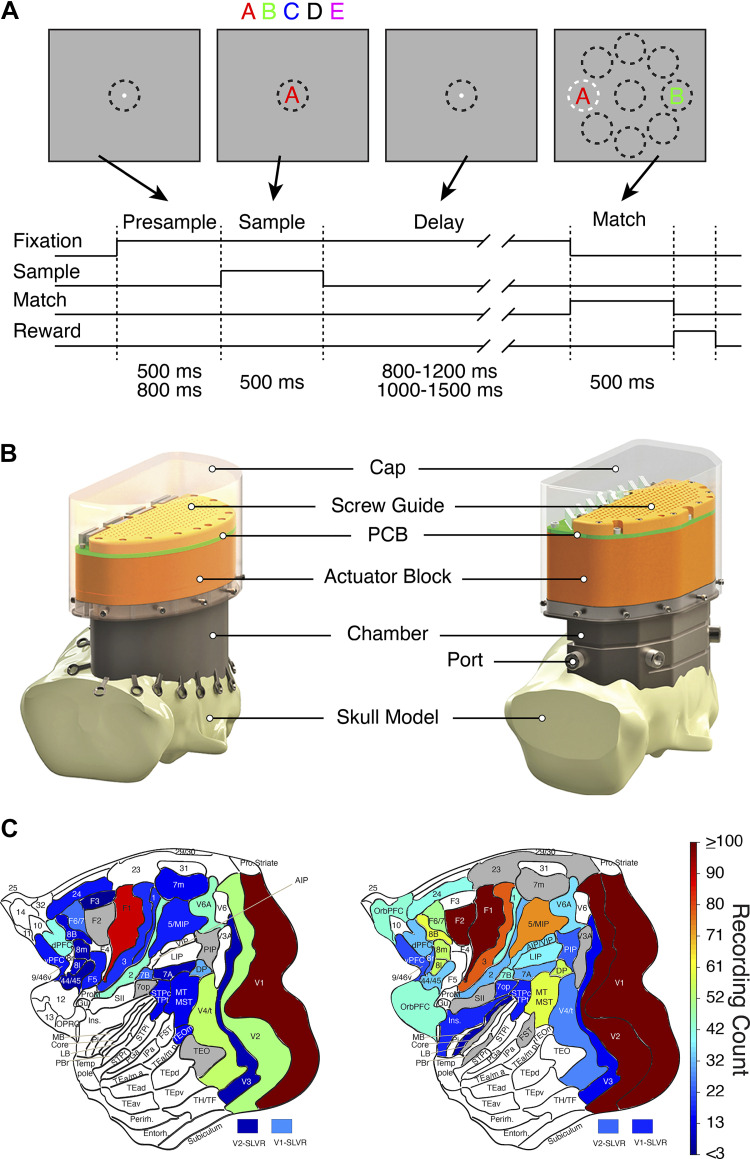
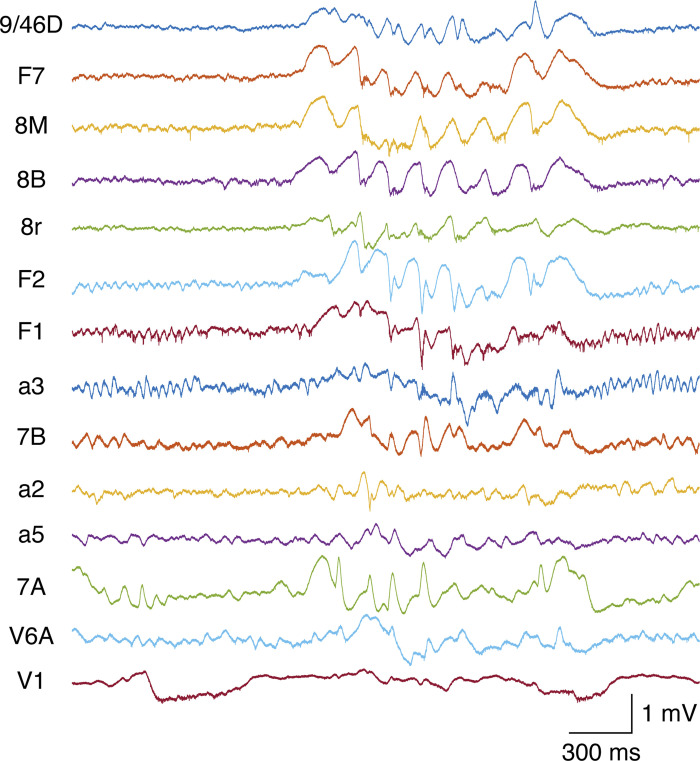
Although cognitive functions are hypothesized to be mediated by synchronous neuronal interactions in multiple frequency bands among widely distributed cortical areas, we still lack a basic understanding of the distribution and task dependence of oscillatory activity across the cortical map. Here, we ask how the spectral and temporal properties of the local field potential (LFP) vary across the primate cerebral cortex, and how they are modulated during visual short-term memory. We measured the LFP from 55 cortical areas in two macaque monkeys while they performed a visual delayed match to sample task. Analysis of peak frequencies in the LFP power spectra reveals multiple discrete frequency bands between 3 and 80 Hz that differ between the two monkeys. The LFP power in each band, as well as the sample entropy, a measure of signal complexity, display distinct spatial gradients across the cortex, some of which correlate with reported spine counts in cortical pyramidal neurons. Cortical areas can be robustly decoded using a small number of spectral and temporal parameters, and significant task-dependent increases and decreases in spectral power occur in all cortical areas. These findings reveal pronounced, widespread, and spatially organized gradients in the spectral and temporal activity of cortical areas. Task-dependent changes in cortical activity are globally distributed, even for a simple cognitive task.NEW & NOTEWORTHY We recorded extracellular electrophysiological signals from roughly the breadth and depth of a cortical hemisphere in nonhuman primates (NHPs) performing a visual memory task. Analyses of the band-limited local field potential (LFP) power displayed widespread, frequency-dependent cortical gradients in spectral power. Using a machine learning classifier, these features allowed robust cortical area decoding. Further task dependence in LFP power were found to be widespread, indicating large-scale gradients of LFP activity, and task-related activity.

Keywords: LFP; cognition; electrophysiology; large-scale; short-term memory.


Conflict of interest statement

C.M.G. is affiliated with Gray Matter Research. None of the other authors has any conflicts of interest, financial or otherwise, to disclose.

Figures

None
Graphical abstract
Figure 1.
Figure 1.
A: time course of events in the delayed match-to-sample task. The upper frames illustrate the sequence of images viewed by the monkeys during the task. The dashed circles represent the windows for monitoring eye position. These were not visible to the animal. The sample and match stimuli are symbolized by the letters A–E. The white dashed circle in the right plot indicates a correct match. The lower plot illustrates the timeline of task events. The presample duration was 500 ms for monkey E and 800 ms for monkey L. The duration of the delay period was 800–1,200 ms for monkey E and 1,000–1,500 ms for monkey L. Match stimuli were randomly presented on opposite sides of the horizontal for monkey E and on opposite sides of axes lying at 0, 45, and 90 degrees for monkey L. B: design drawings of the chamber and semi-chronic microdrive systems used for recording neuronal activity. The left and right designs were used on monkeys E and L, respectively. Adapted from Dotson et al. (54). C: flatmaps of the recording counts for each cortical area/group [following the nomenclature of Markov et al. (43)] in monkeys E (left) and L (right). Areas with less than three recordings are shaded gray and were not included in the analyses. Areal groupings and recording counts are listed in Table 1.
Figure 2.
Figure 2.
Spectral properties of local field potential (LFP) signals vary markedly across cortex. A: schematic of the recording sites in monkey L. The outline of the left hemisphere and major cortical sulci, drawn from a photograph, are shown in red. Each circle shows the entry location of an electrode that recorded neural unit activity at some point during the 9 mo of the experiment. Filled circles indicate electrode locations that recorded neural activity in this session (n = 94). Cyan-filled circles mark the electrode locations that correspond to the signals shown in B. B: broadband (0.1 Hz–9 kHz) raw data recorded on a single trial from 14 separate cortical areas. The areal name (left of each trace) follows the nomenclature of Markov et al. (43). The bottom two traces show the vertical and horizontal components of the eye position signal. The black vertical lines, from left to right, mark the onset and offset of the sample stimulus and the onset of the match stimulus, respectively. The colored horizontal bars at the top indicate the time and duration (400 ms) of the Presample (P), Sample (S), Delay1 (D1), Delay2 (D2), and DelayM (DM) epochs, respectively. A saccadic eye movement, occurring ∼200 ms following the onset of the match, indicates the monkey’s behavioral choice. The mean sample entropy (SampEn) across trials is plotted to the right of each data trace. C: LFP power spectra (0–80 Hz) for each area indicated in A and B, averaged across all correct trials for each of the five epochs (Presample: black; Sample: green; Delay1: blue; Delay2: red; Delaym: magenta). Clear differences in LFP power and its task dependence are apparent between different areas of cortex. Black arrows mark notable local peaks or shoulders in the power spectra. Peaks occurring below 4 Hz are due to the absence of a DC component in the filtered signals. AS, arcuate sulcus; CS, central sulcus; IPS, intraparietal sulcus; LS, lunate sulcus; PS, principal sulcus.
Figure 3.
Figure 3.
Spectral peaks in the local field potential (LFP) occur in distinct frequency bands that vary between animals. Distributions of peak frequencies obtained from semi-log power spectra on all channels and sessions in monkeys E (A) and L (B). The top plots in A and B show the cumulative histograms of all peak frequencies (4–80 Hz) that exceeded the peak prominence threshold (see Supplemental Figs. S1 and S2). The continuous red lines show the probability density function (PDF) computed with a mixture of Gaussians fit to each distribution. The local minima in each PDF define the boundaries between selected frequency bands for each animal (dashed vertical lines). Four bands (B1B4) were chosen for monkey E and five bands (B1B5) were chosen for monkey L. The bottom plots show the normalized counts of peak frequencies for each cortical area/group. This revealed a rough spatial organization of peak frequencies across the sampled cortical areas.
Figure 4.
Figure 4.
Spectral content displays anatomical gradients that differ across frequency bands in both monkeys (A: monkey E; B: monkey L). The left columns in A and B show cortical flatmaps of the mean spectral content in each area/group, across all sessions, during the presample epoch for each frequency band. Areal boundaries and nomenclature follow that of Markov et al. (43). Visual area V1 with short-latency visual responses in the unit activity (V1-SLVR) and visual area V2 with short-latency visual responses in the unit activity (V2-SLVR) refer to the subset of recordings in areas V1 and V2, respectively, that displayed short latency responses of spiking activity to one or more of the sample stimuli presented on each session [Dotson et al. (50)]. The right columns in A and B show the corresponding distributions of spectral content across all sessions, ranked by the median values. The circle within each box shows the median, the box displays the interquartile range, the whiskers show the 5th and 95th percentiles, and the open circles show outliers. Areal labels are displayed at the bottom and top of each plot. The data are color-coded by cortical region (prefrontal: red; premotor/motor: yellow; somatosensory: green; temporal: cyan; parietal: blue; visual: magenta).
Figure 5.
Figure 5.
Flatmaps and rank-ordered box plots of the peak amplitude (PA) obtained from the power spectra in each frequency band in monkey E (A) and monkey L (B) during the presample epoch of the task. Plotting conventions are the same as Fig. 4. Because of outliers and nonlinearities in the rank order plots, the flatmaps are scaled as a percentage of a threshold value shown by the blue line in each rank ordered plot.
Figure 6.
Figure 6.
Sample entropy shows clear anatomical gradients. Variation of sample entropy (SampEn) across the cortex for both monkeys during the presample epoch. Cortical flatmaps of median SampEn (left) and corresponding distributions of SampEn, ranked by the median, for monkeys E (A) and L (B). Plotting conventions are the same as in Fig. 3.
Figure 7.
Figure 7.
Scatter plots of the median values of spectral content in band 1 (SC1), sample entropy (SampEn) and peak amplitude in band 1 (PA1) vs. mean dendritic spine count on the basal dendrites of layer 3 pyramidal neurons for an overlapping set of 14 and 18 cortical areas in monkey E (blue) and monkey L (red). The correlation coefficients were calculated on the combined data from both monkeys. Spine counts along the x-axis are the same in all three plots and areal labels are shown above the x-axis in the top plot. Data for the areas labeled in black text were available for both monkeys while those labeled in red were available for monkey L only. Spine count data were taken from the reports of Elston and colleagues [Elston and Rosa (–72); Elston and Rockland (73); Elston et al. (38, 74, 75)]. For some area groups (i.e., MT/MST, V4/t, 5/MIP, STP/TPt) spine data was obtained from just one area (i.e., MT, V4, 5, STP). For other area groups [i.e., orbital frontal cortex (orbFC) and dorsal prefrontal cortex (dPFC)], spine data was obtained from a subset of those areas (i.e., 12, 13, 9, and 46).
Figure 8.
Figure 8.
Results of the decoding analysis. Confusion matrices (A and B) and distributions of validation accuracies (C and D) for the presample epoch in monkey E (A and C) and monkey L (B and D). In each box plot the red line shows the median, the blue box displays the interquartile range, the whiskers show the 5th and 95th percentiles, and the red asterisks show outliers. The dashed blue line and solid red line in C and D show the mean and 99th percentile computed from the surrogate distributions. The plots in E and F show the median validation accuracies as a function of task epoch [Presample (P), Sample (S), Delay1 (D1), Delay2 (D2), and DelayM (DM)] for each area in monkey E and monkey L, respectively. The upper and lower yellow horizontal lines in the color-scale bar show the 99th percentile computed from the surrogate distributions for monkeys E and L, respectively. VA, validation accuracies. Cortical brain area abbreviations as per Ref. .
Figure 9.
Figure 9.
Distributions of validation accuracies (VA%) as a function of task epoch [Presample (P), Sample (S), Delay1 (D1), Delay2 (D2), and DelayM (DM)] for each area in monkey E (A) and monkey L (B). The bottom right plot in A and B shows the cumulative distributions of validation accuracies across all areas. In each box plot the red line shows the median, the blue box displays the interquartile range, the whiskers show the 5th and 95th percentiles, and the red asterisks show outliers. The dashed blue line and solid red line in each plot show the mean and 99th percentile computed from the surrogate distributions.
Figure 10.
Figure 10.
Task-dependent changes in local field potential (LFP) power as a function of task epoch, frequency band, and cortical area in monkeys E and L. A: example results for area 8B (band 2) and area F2 (band 4) in monkey L. The top plots show the distributions of significant changes in power across recording sites for each task epoch (S, sample; D1, delay1; D2, delay2; DM, delaym) as a percentage change relative to the presample epoch. The mean of each distribution is shown by the black filled circles. The incidence of significant values in each epoch is shown by the black horizontal lines. Recording counts are shown in parentheses. The mean change and the incidence values are color coded and displayed in the lower pair of plots for the two areas [mean change (blue/red), incidence (orange/green), see color scales in C and D]. B: histograms of the change in mean power, relative to the presample epoch, for all task epochs, frequency bands and cortical areas in monkey E (left) and monkey L (right). The ratios in each plot show the incidence (%) of significant decreases and increases in power. CF: summaries of the significant changes in mean LFP power (C and E) and the incidence of those changes (D and F) as a function of task epoch (S, D1, D2, and DM), frequency band and cortical area for monkey E (C and D) and monkey L (E and F). The number of recordings in each area are given in Table 1. The black boxes in E and F indicate the data shown in the lower two pairs of plots in A.
Figure 11.
Figure 11.
Plots of a 3-s segment of broadband raw data recorded during a period of rest with the room lights turned off in monkey L. The data is shown for the same channels on the same session as the plots in Fig. 2. A rapid-onset sleep spindle occurs halfway into the segment with high amplitude in prefrontal, premotor, and parietal areas.

Update of

Similar articles

Cited by

References

    1. Bressler SL, Coppola R, Nakamura R. Episodic multiregional cortical coherence at multiple frequencies during visual task performance. Nature 366: 153–156, 1993. doi: 10.1038/366153a0. - DOI - PubMed
    1. Tallon-Baudry C, Bertrand O, Fischer C. Oscillatory synchrony between human extrastriate areas during visual short-term memory maintenance. J Neurosci 21: RC177, 2001. doi: 10.1523/JNEUROSCI.21-20-j0008.2001. - DOI - PMC - PubMed
    1. Jensen O, Gelfand J, Kounios J, Lisman JE. Oscillations in the α band (9–12 Hz) increase with memory load during retention in a short-term memory task. Cerebral Cortex 12: 877–882, 2002. doi: 10.1093/cercor/12.8.877. - DOI - PubMed
    1. Brovelli A, Ding M, Ledberg A, Chen Y, Nakamura R, Bressler SL. Beta oscillations in a large-scale sensorimotor cortical network: directional influences revealed by Granger causality. Proc Natl Acad Sci USA 101: 9849–9854, 2004. doi: 10.1073/pnas.0308538101. - DOI - PMC - PubMed
    1. Siegel M, Warden MR, Miller EK. Phase-dependent neuronal coding of objects in short-term memory. Proc Natl Acad Sci USA 106: 21341–21346, 2009. doi: 10.1073/pnas.0908193106. - DOI - PMC - PubMed

Publication types

LinkOut - more resources