. 2024 Sep 2;223(9):e202405025.
doi: 10.1083/jcb.202405025. Epub 2024 Jun 6.

ESCRT disruption provides evidence against trans-synaptic signaling via extracellular vesicles

Affiliations

ESCRT disruption provides evidence against trans-synaptic signaling via extracellular vesicles

Erica C Dresselhaus et al. J Cell Biol. .

Abstract

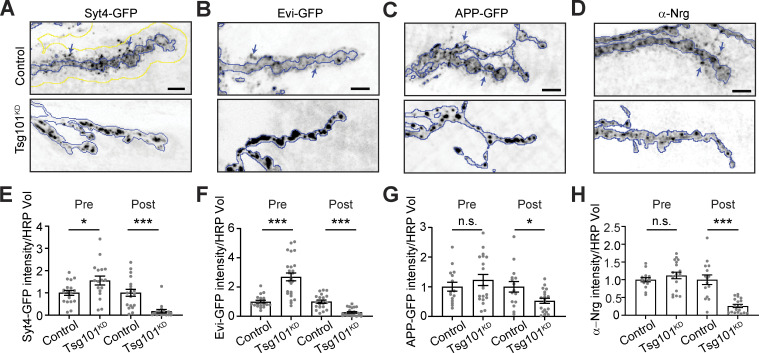
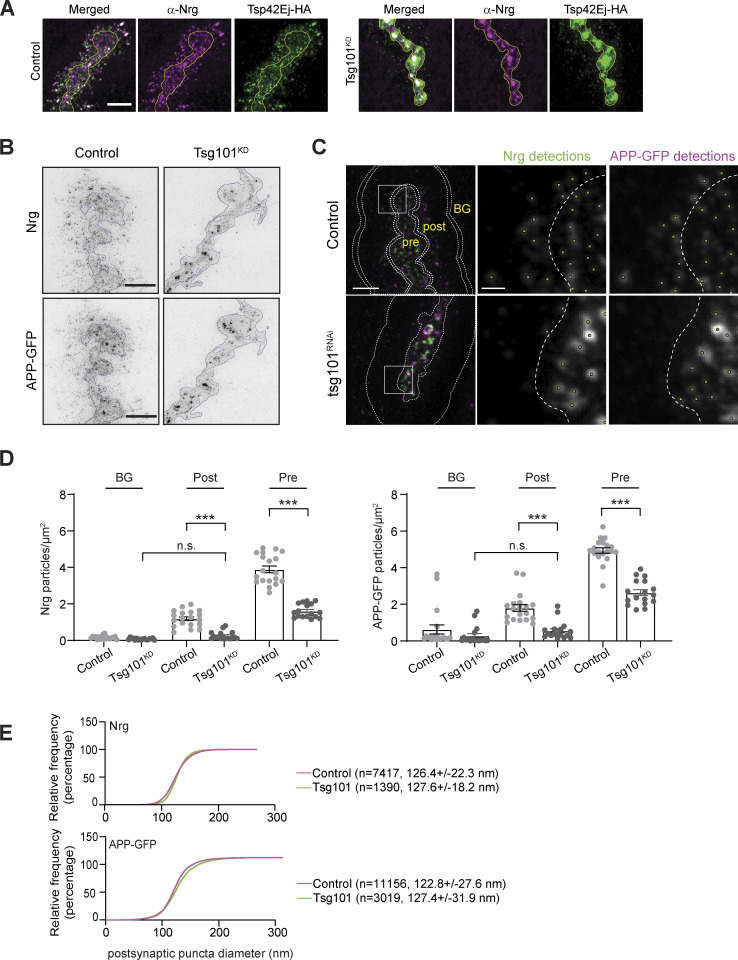
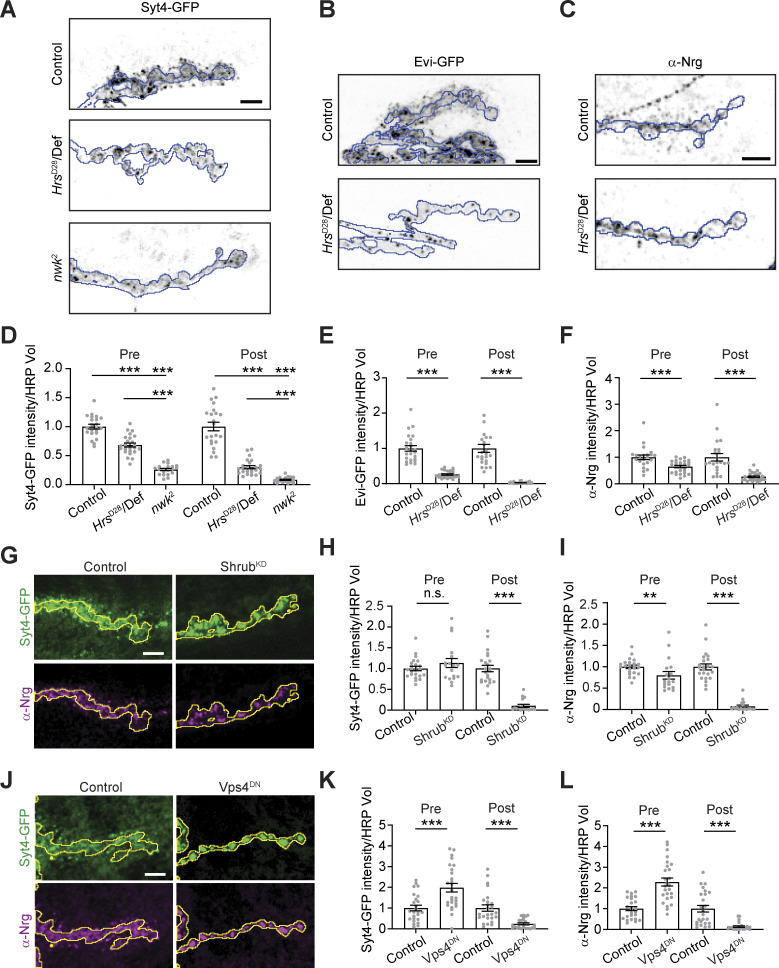
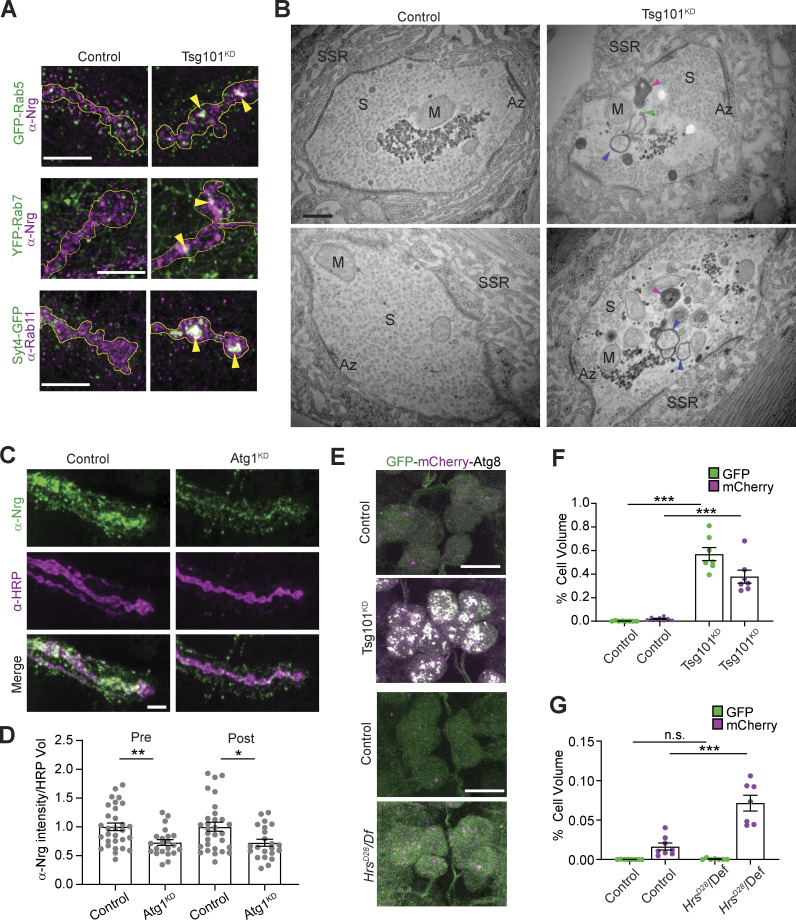
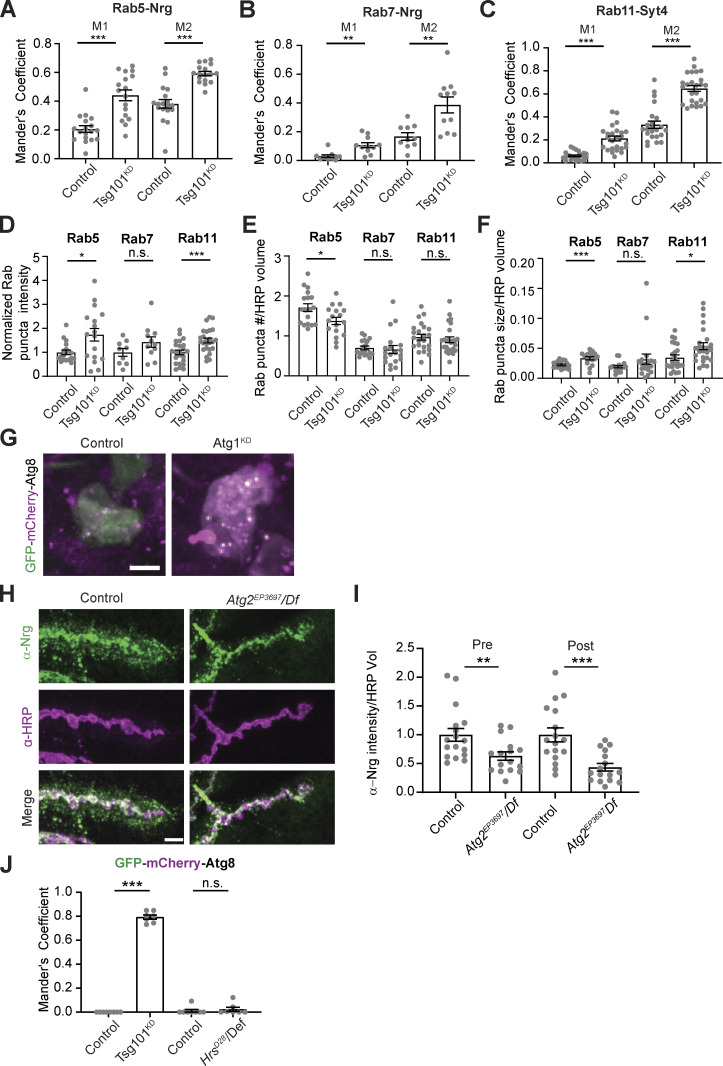
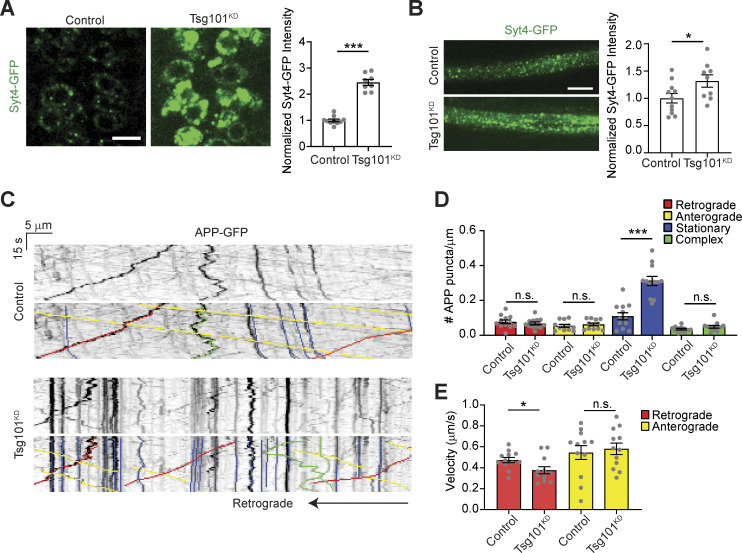
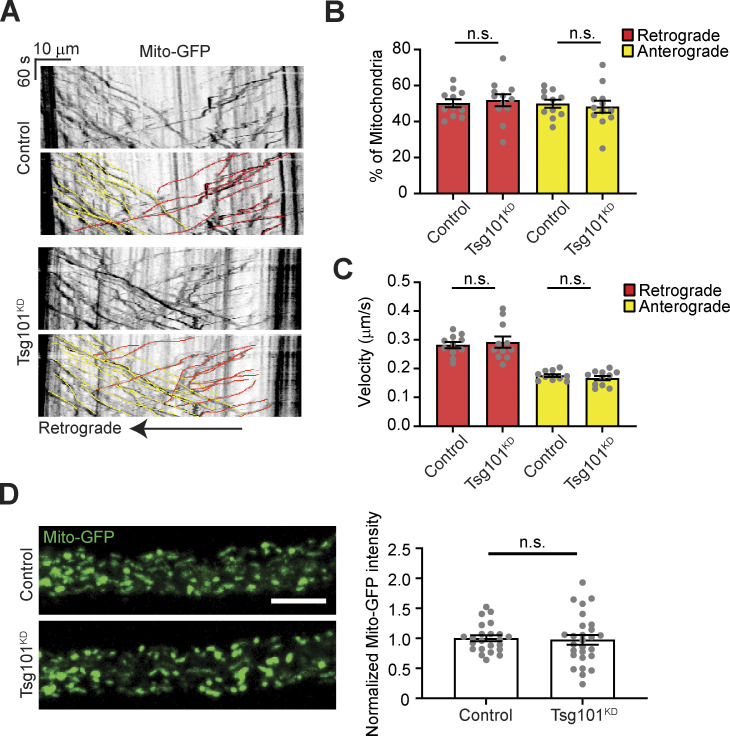
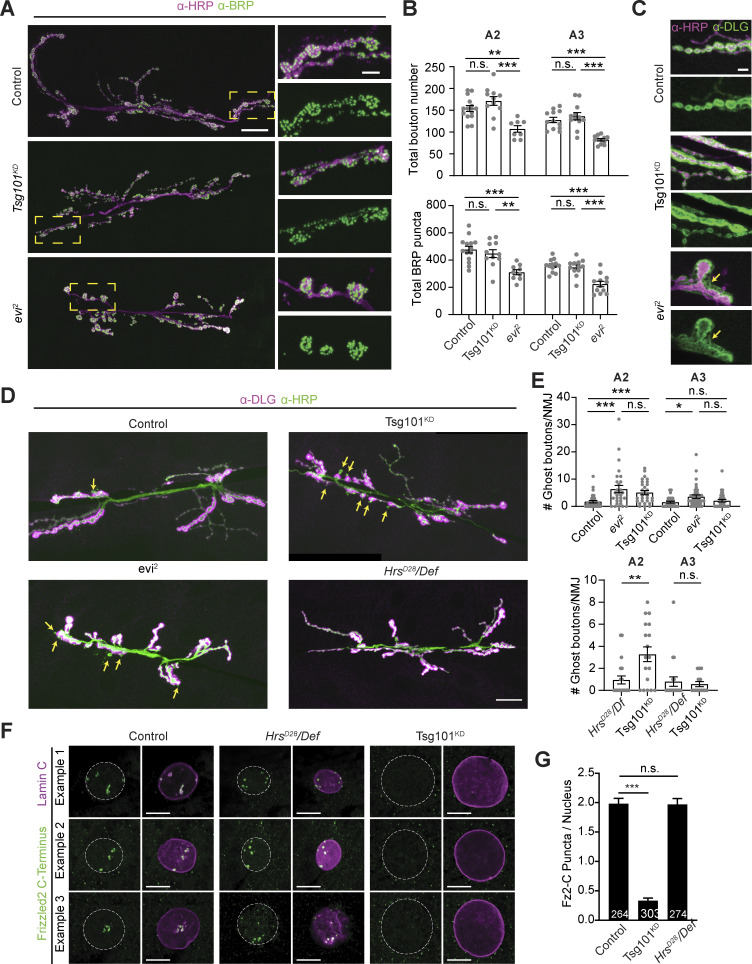
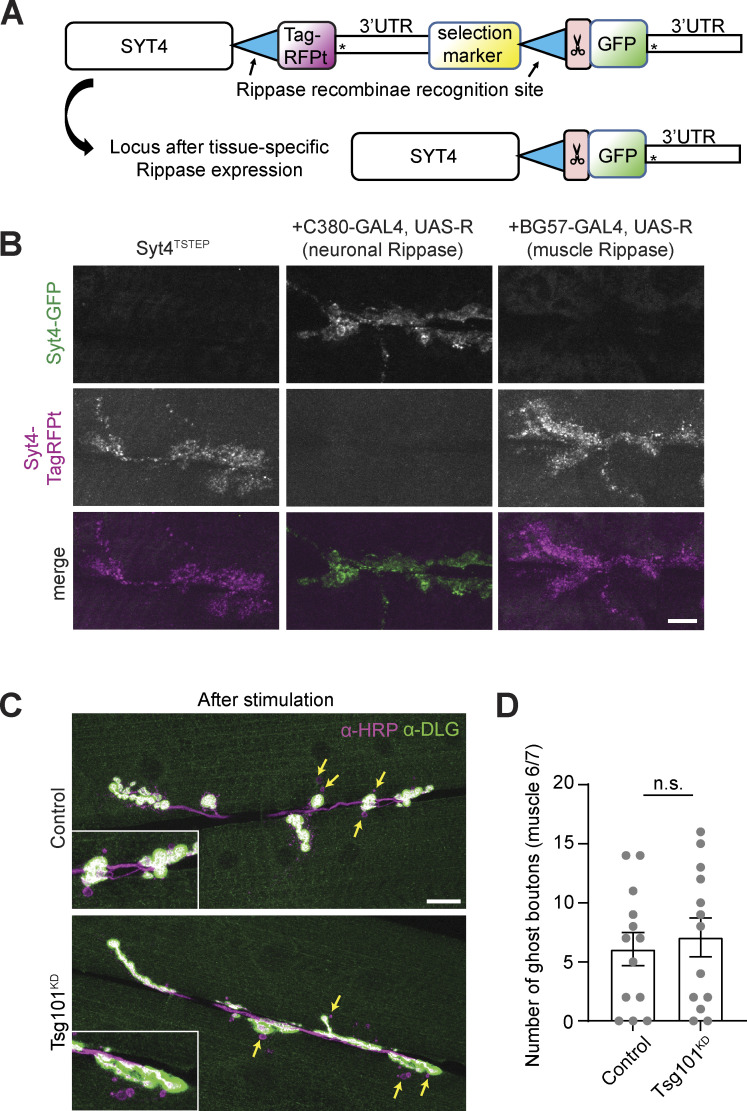
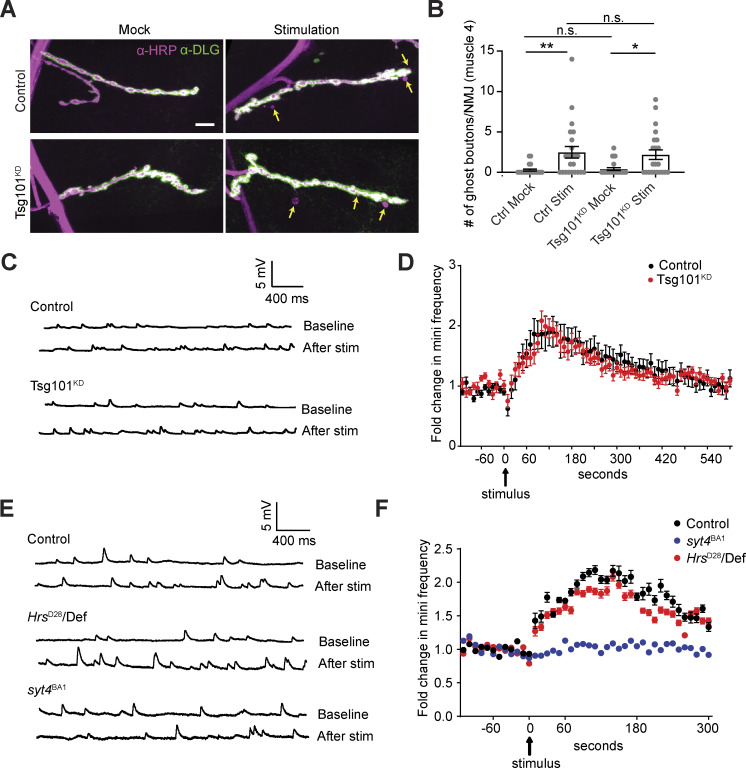
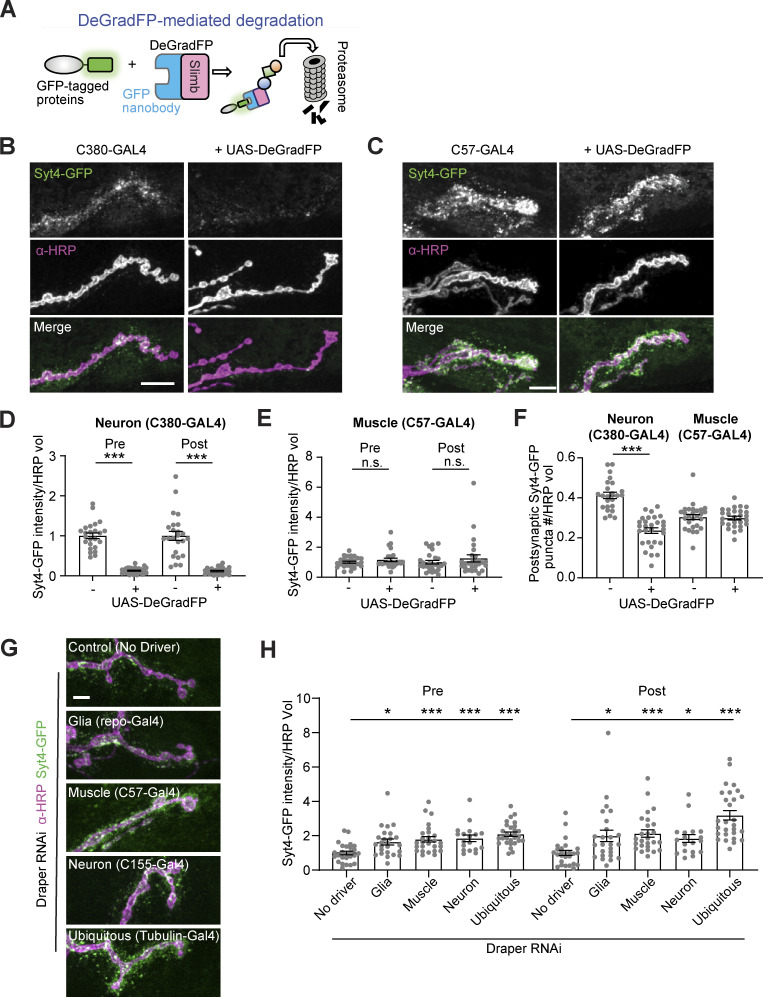
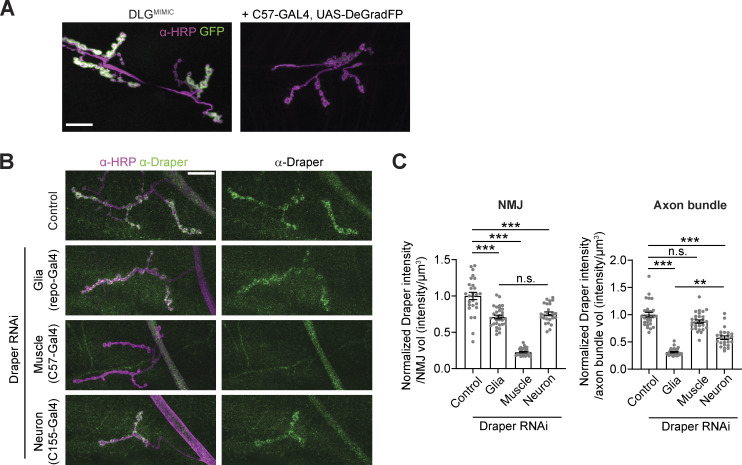
Extracellular vesicles (EVs) are released by many cell types, including neurons, carrying cargoes involved in signaling and disease. It is unclear whether EVs promote intercellular signaling or serve primarily to dispose of unwanted materials. We show that loss of multivesicular endosome-generating endosomal sorting complex required for transport (ESCRT) machinery disrupts release of EV cargoes from Drosophila motor neurons. Surprisingly, ESCRT depletion does not affect the signaling activities of the EV cargo Synaptotagmin-4 (Syt4) and disrupts only some signaling activities of the EV cargo evenness interrupted (Evi). Thus, these cargoes may not require intercellular transfer via EVs, and instead may be conventionally secreted or function cell-autonomously in the neuron. We find that EVs are phagocytosed by glia and muscles, and that ESCRT disruption causes compensatory autophagy in presynaptic neurons, suggesting that EVs are one of several redundant mechanisms to remove cargoes from synapses. Our results suggest that synaptic EV release serves primarily as a proteostatic mechanism for certain cargoes.


Conflict of interest statement

Disclosures: The authors declare no competing interests exist.

Figures

Figure 1.
Figure 1.
Tsg101 is required for the release of EV cargoes from presynaptic terminals. (A–D) Representative confocal images from larvae expressing UAS-Tsg101-RNAi (Tsg101KD) or a control RNAi either pan-neuronally (C380-GAL4) or in motor neurons (Vglut-GAL4) together with the following EV cargoes: (A) Syt4-GFP expressed from its endogenous locus, (B) UAS-driven Evi-GFP, (C) UAS-driven APP-GFP, and (D) endogenous Neuroglian (Nrg, neuronal isoform Nrg180) detected by antibody. (E–H) Quantification of EV cargo puncta intensity. All images show MaxIPs of muscle 6/7 segments A2 or A3. Scale bars are 5 µm. (A–D) Blue outlines represent the neuronal membrane as marked from an HRP mask; the yellow line in A shows a 3.3 µm dilation of the HRP mask, representing the postsynaptic region. Arrows show examples of postsynaptic EVs. Data are represented as mean ± SEM; n represents NMJs. All intensity measurements are normalized to their respective controls. *P < 0.05, ***P < 0.001. See Tables S1 and S3 for detailed genotypes, sample sizes, and statistical analyses.
Figure S1.
Figure S1.
Characterization of EV structures upon Tsg101 depletion (associated with Fig. 1). (A) Representative Airyscan images of larvae expressing UAS-Tsp42Ej-HA, and labeled with α-HA and α-Nrg. Scale bar is 5 µm. Yellow outline represents the neuronal membrane as marked from an HRP mask. (B) Representative 2D-STED images of muscle 6/7 labeled with α-GFP and α-Nrg antibodies. Scale bar is 2.5 µm. (C) Noise2Void denoised images and depiction of image regions used for quantification (left panel, scale bar is 2.5 µm). Pre: Presynaptic; Post: Postsynaptic; BG: Background. Buffers (between double lines in the top left panel) generated by a 10% dilation of the presynaptic or postsynaptic area were used to eliminate signal that overlapped between regions. Boxes indicate zoomed areas (scale bar is 0.5 µm) in middle and right panels showing automated spot detections (green dots) and the presynaptic boundary (dotted line). (D) Quantification of APP-GFP and Nrg puncta number. Data are represented as mean ± SEM; n represents NMJs; ***P < 0.001. (E) Cumulative distribution of Nrg and APP puncta diameter. Graph shows fraction of particles under the indicated size; numbers indicate mean and standard deviation of all detected puncta. See Tables S1 and S3 for detailed genotypes, sample sizes, and statistical analyses.
Figure 2.
Figure 2.
Multiple ESCRT components are required for the release of EV cargoes from presynaptic terminals. (A) Representative confocal images of control, Hrs and nwk mutant larvae expressing Syt4-GFP from its endogenous locus. (B) Representative confocal images of control and Hrs mutant larvae expressing motor neuron (Vglut-GAL4)-driven UAS-Evi-GFP. (C) Representative confocal images of control and Hrs mutant larvae labeled with antibodies against endogenous Nrg. (D–F) Quantification of EV cargo puncta intensity. (G) Representative confocal images of larvae pan-neuronally expressing UAS-Shrub-RNAi (ShrubKD) or a control RNAi. (H and I) Quantification of Syt4-GFP and Nrg puncta intensity. (J) Representative confocal images of larvae pan-neuronally expressing UAS-Vps4DN. (K and L) Quantification of Syt4-GFP and Nrg puncta intensity. All images show MaxIPs of muscle 6/7 segments A2 or A3. Scale bars are 5 µm. The outline represents the neuronal membrane as marked from an HRP mask. Data are represented as mean ± SEM; n represents NMJs. All fluorescence intensity values are normalized to their respective controls. *P < 0.05, **P < 0.01, ***P < 0.001. See Tables S1 and S3 for detailed genotypes, sample sizes, and statistical analyses.
Figure 3.
Figure 3.
Loss of ESCRT causes compensatory autophagy of presynaptic cargoes. (A) Representative Airyscan images showing co-localization of EV cargoes Syt4-GFP or α-Nrg with endosomal markers α-Rab11, GFP-Rab5 (endogenous tag), or YFP-Rab7 (endogenous tag). Scale bars are 5 μm and the outline represents the neuronal membrane as marked from an HRP mask. (B) Representative TEM images of boutons from muscle 6/7 from control and neuronal Tsg101KD larvae. Examples of autophagic vacuoles are marked with arrowheads, blue = autophagosome, magenta = autolysosome, and green = unclosed phagophore. Other notable features include Az = active zone, S = synaptic vesicles, M = mitochondria, SSR = subsynaptic reticulum. Scale bar is 400 nm. (C) Representative images of the EV cargo Nrg following motor neuron knockdown of Atg1. Scale bar is 5 μm. (D) Quantification of Nrg intensity from C, normalized to control. (E) Representative images from neuronal cell bodies in the ventral ganglion expressing motor neuron-driven GFP-mCherry-Atg8. Scale bar is 10 μm. Brightness/contrast are matched for each mutant with its paired control (see Table S3). (F and G) Quantification of GFP-mCherry-Atg8 levels in F Tsg101KD and (G) HrsD28 mutant larvae. Data are represented as mean ± SEM; n represents NMJs in C and animals in F and G. *P < 0.05, **P < 0.01, ***P < 0.001. See Tables S1 and S3 for detailed genotypes, sample sizes, and statistical analyses.
Figure S2.
Figure S2.
Quantification of endosomal accumulation and autophagy controls (associated with Fig. 3). (A–C) Quantification of co-localization of Nrg or Syt4 and Rab GTPases upon neuronal Tsg101KD (representative images in Fig. 3 A). Mander’s coefficient for the colocalization of Nrg and Rab5 (A), Nrg and Rab7 (B), Syt4 and Rab11 (C), where M1 indicates the fraction of EV cargo in the Rab-positive thresholded area and M2 is the fraction of the Rab marker in the EV cargo-positive thresholded area. (D–F) Quantification of Rab compartment properties: (D) normalized Rab puncta intensity, (E) density of Rab puncta in the presynaptic compartment, and (F) average size of Rab puncta. (G) Representative confocal images of motor neuron cell bodies to validate that pan-neuronal Atg1-RNAi effectively blocks autophagic flux, assessed by GFP-mCherry-Atg8. (H) Representative confocal images of Nrg in muscle 6/7 NMJs. (I) Quantification of Nrg intensity from H. (J) Colocalization of GFP and mCherry in cell bodies from motor neurons expressing GFP-mCherry-Atg8 (representative images in Fig. 3 E). All scale bars = 5 µm. Data are represented as mean ± SEM; n represents NMJs in A–F and I and animals in J. Intensity measurements (D and I) are normalized to their respective controls. *P < 0.05, **P < 0.01, ***P < 0.001. See Tables S1 and S3 for detailed genotypes, sample sizes, and statistical analyses.
Figure 4.
Figure 4.
Tsg101KD causes neuronal accumulation of EV cargoes. (A) Left: Representative confocal images of Syt4-GFP in a single slice through motor neuron cell bodies of the ventral ganglion. Scale bar is 10 μm. Right: Quantification of total Syt4-GFP intensity in the brain. (B) Left: Maximum intensity projection of axon segment proximal to the ventral ganglion. Scale bar is 10 μm. Right: Quantification of total Syt4-GFP intensity in the axon. (C) Representative kymographs showing tracks of APP-GFP in the axon proximal to the ventral ganglion. Bottom panels show color-coded traces. (D) Quantification of directionality of APP-GFP tracks. (E) Quantification of the velocity of retrograde and anterograde APP-GFP tracks upon neuronal Tsg101KD. Data are represented as mean ± SEM; n represents animals. Intensity measurements (A and B) are normalized to their respective controls. *P < 0.05, ***P < 0.001. See Tables S1 and S3 for detailed genotypes, sample sizes, and statistical analyses.
Figure S3.
Figure S3.
Controls for axonal transport in Tsg101KD larvae (associated with Fig. 4). (A) Representative kymographs showing tracks of Mito-GFP in axonal region proximal to the ventral ganglion, following photobleaching. Lower panels show color coded traces. (B) Percent of mitochondria tracks moving retrograde and anterograde. (C) Velocities of mitochondria tracks. (D) Left: Representative images of the first frame of Mito-GFP videos. Scale bar = 10 µm. Right: Quantification of Mito-GFP intensity. Data are represented as mean ± SEM; n represents axons. Intensity measurements are normalized to their respective controls. See Tables S1 and S3 for detailed genotypes, sample sizes, and statistical analyses.
Figure 5.
Figure 5.
Tsg101KD phenocopies a subset of evi and wg synaptic morphology and signaling defects, while loss of Hrs has no effect. (A) Representative confocal images of muscle 6/7 NMJs labeled with α-HRP and α-BRP antibodies (left). Magnification of the yellow boxed area (right). HRP brightness was adjusted independently. Large image scale bar is 20 µm, small image scale bar is 5 µm. (B) Quantification of total bouton number (top) and active zone number (bottom) on muscle 6/7. (C) Representative confocal images of muscle 6/7 NMJ highlighting α-DLG pattern. Arrows indicate the location of “feathery” DLG. Scale bar is 5 µm. (D) Representative confocal images of muscle 6/7 NMJ (abdominal segment A2) labeled with α-HRP and α-DLG antibodies. α-DLG and α-HRP signals were acquired in the linear range but adjusted independently and displayed near saturation to highlight DLG-negative ghost boutons, which are indicated with yellow arrows. (E) Quantification of baseline (i.e., unstimulated) ghost boutons. Top and bottom graphs represent independent experiments. (F) Single slices of muscle 6/7 nuclei labeled with α-LamC (nuclear periphery) and α-Fz2-C antibodies. Dotted line represents LamC-defined nuclear boundary. Scale bars are 10 µm. (G) Quantification of Fz2-C puncta per nucleus. Number of nuclei quantified is indicated in the bar graph. A2 and A3 indicate the larval abdominal segment. Data are represented as mean ± SEM; n represents nuclei in G and NMJs in B–E. *P < 0.05, **P < 0.01, ***P < 0.001. See Tables S1 and S3 for detailed genotypes, sample sizes, and statistical analyses.
Figure S4.
Figure S4.
Additional controls showing presynaptic source of Syt4 and structural plasticity upon Tsg101KD (associated with Fig. 6). (A and B) Syt4 protein is derived from the presynaptic neuron. (A) Schematic for Tissue-Specific Tagging of Endogenous Proteins (T-STEP). Scissors indicate a Prescission protease cleavage site and * indicates stop codons. (B) Representative confocal images from muscle 6/7, showing Syt4TSTEP expressed from its endogenous promoter, and switched from TagRFP-T to GFP using either presynaptically (neuronal, C380-GAL4) or postsynaptically (muscle, C57-Gal4)-expressed recombinase (Rippase). Scale bar = 10 µm. (C) Representative confocal images from muscle 6/7 in spaced K+-stimulated larvae. Arrows indicate ghost boutons. Scale bar = 20 µm. (D) Quantification of ghost bouton numbers per NMJ. Scale bars = 10 µm. Data is represented as mean ± SEM; n represents NMJs. See Tables S1 and S3 for detailed genotypes, sample sizes, and statistical analyses.
Figure 6.
Figure 6.
Loss of ESCRT does not phenocopy syt4 functional defects. (A) Representative confocal images from muscle 4 in mock and spaced K+-stimulated larvae. Arrows indicate examples of activity-dependent ghost boutons. Scale bar = 10 µm. (B) Quantification of ghost bouton numbers per NMJ. (C) Representative traces of mEJPs before (top trace) and after (bottom trace) high-frequency stimulation (4 × 100 Hz) from control and Tsg101KD. (D) Timecourse of mEJP frequency after stimulation. (E) Representative traces of mEJPs before (top trace) and after (bottom trace) high-frequency stimulation (4 × 100 Hz) from control, HrsD28, and syt4BA1. (F) Timecourse of mEJP frequency after stimulation. Data are represented as mean ± SEM; n represents NMJs. *P < 0.05, **P < 0.01. See Tables S1 and S3 for detailed genotypes, sample sizes, and statistical analyses.
Figure 7.
Figure 7.
Neuronally derived EV cargoes are targeted for phagocytosis and are not detectable in the cytoplasm of recipient cells. (A) Schematic for DeGradFP system. (B and C) Representative images of Syt4-GFP with neuronal (C380-GAL4, B) or muscle (C57-GAL4, C) expressed DeGradFP. (D) Quantification of Syt4-GFP intensity from B. (E) Quantification of Syt4-GFP intensity from C. (F) Quantification of normalized presynaptic puncta number from B and C. (G) Representative confocal images of Syt4-GFP at muscle 4 NMJs following knockdown of Draper in different cell types. (H) Quantification of Syt4 puncta intensity. All scale bars = 10 µm. Intensity measurements are normalized to their respective controls. Data are represented as mean ± SEM; n represents NMJs. **P < 0.01, ***P < 0.001. See Tables S1 and S3 for detailed genotypes, sample sizes, and statistical analyses.
Figure S5.
Figure S5.
Controls for DeGradFP and validation of Draper RNAi (associated with Fig. 7). (A) Representative images of DlgMiMIC (a postsynaptically localized GFP knock-in) with muscle-expressed DeGradFP. (B) Representative confocal images of muscle 4 NMJs labeled with α-Draper antibodies. (C) Quantification of α-Draper intensity at NMJs and axon bundles proximal to the NMJ upon Draper RNAi under the control of the indicated drivers. Axon bundles represent a combination of glial and neuronal signal; NMJs represent a combination of neuronal and muscle signals. Scale bars are 20 µm. Intensity measurements are normalized to their respective controls. Data are represented as mean ± SEM; n represents NMJs. **P < 0.01, ***P < 0.001. See Tables S1 and S3 for detailed genotypes, sample sizes, and statistical analyses.

Update of

Comment in

References

    1. Adolfsen, B., Saraswati S., Yoshihara M., and Littleton J.T.. 2004. Synaptotagmins are trafficked to distinct subcellular domains including the postsynaptic compartment. J. Cell Biol. 166:249–260. 10.1083/jcb.200312054 - DOI - PMC - PubMed
    1. Arbo, B.D., Cechinel L.R., Palazzo R.P., and Siqueira I.R.. 2020. Endosomal dysfunction impacts extracellular vesicle release: Central role in Aβ pathology. Ageing Res. Rev. 58:101006. 10.1016/j.arr.2019.101006 - DOI - PubMed
    1. Asai, H., Ikezu S., Tsunoda S., Medalla M., Luebke J., Haydar T., Wolozin B., Butovsky O., Kügler S., and Ikezu T.. 2015. Depletion of microglia and inhibition of exosome synthesis halt tau propagation. Nat. Neurosci. 18:1584–1593. 10.1038/nn.4132 - DOI - PMC - PubMed
    1. Ashley, J., Cordy B., Lucia D., Fradkin L.G., Budnik V., and Thomson T.. 2018. Retrovirus-like gag protein Arc1 binds RNA and traffics across synaptic boutons. Cell. 172:262–274.e11. 10.1016/j.cell.2017.12.022 - DOI - PMC - PubMed
    1. Ataman, B., Ashley J., Gorczyca D., Gorczyca M., Mathew D., Wichmann C., Sigrist S.J., and Budnik V.. 2006. Nuclear trafficking of Drosophila Frizzled-2 during synapse development requires the PDZ protein dGRIP. Proc. Natl. Acad. Sci. USA. 103:7841–7846. 10.1073/pnas.0600387103 - DOI - PMC - PubMed

MeSH terms

Substances

LinkOut - more resources