. 2024 Jul 22;52(13):7650-7664.
doi: 10.1093/nar/gkae475.

Replication protein A dynamically re-organizes on primer/template junctions to permit DNA polymerase δ holoenzyme assembly and initiation of DNA synthesis

Affiliations

Replication protein A dynamically re-organizes on primer/template junctions to permit DNA polymerase δ holoenzyme assembly and initiation of DNA synthesis

Jessica L Norris et al. Nucleic Acids Res. .

Abstract

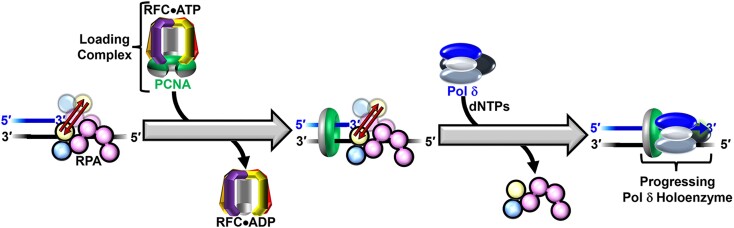
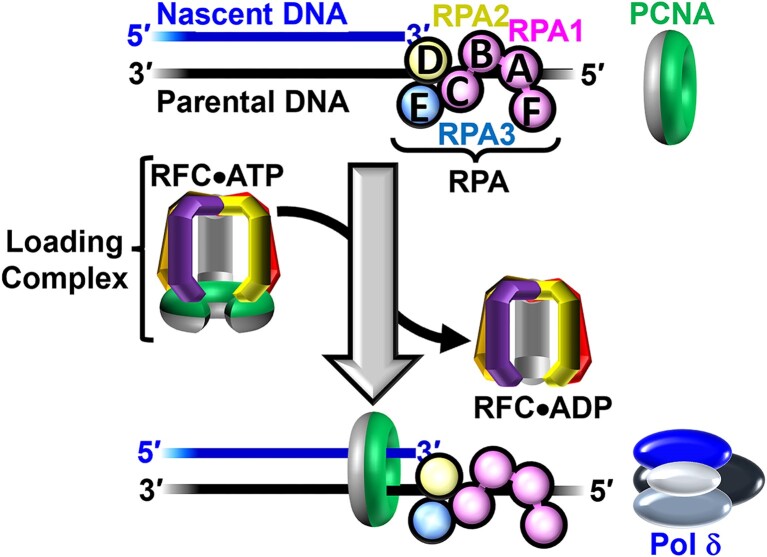
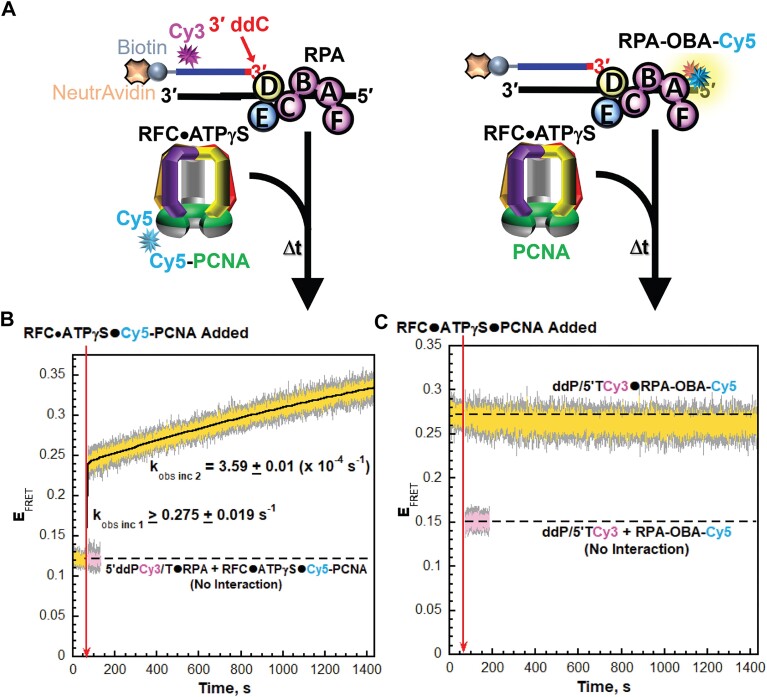
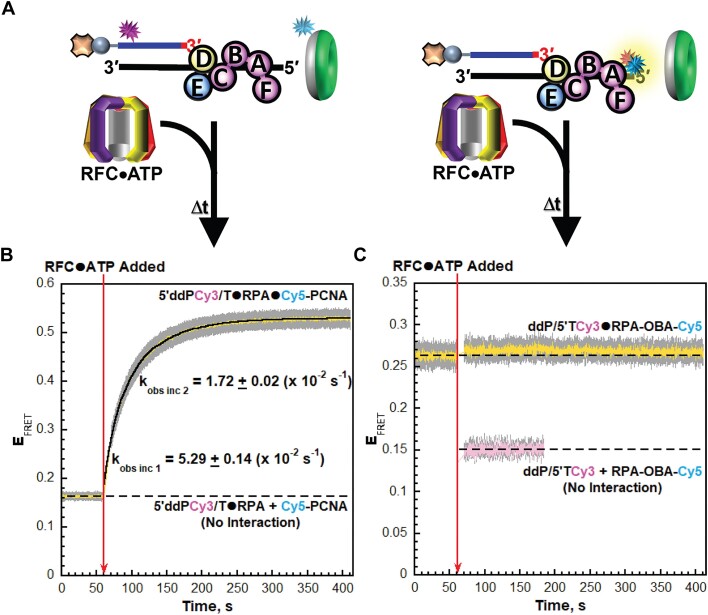
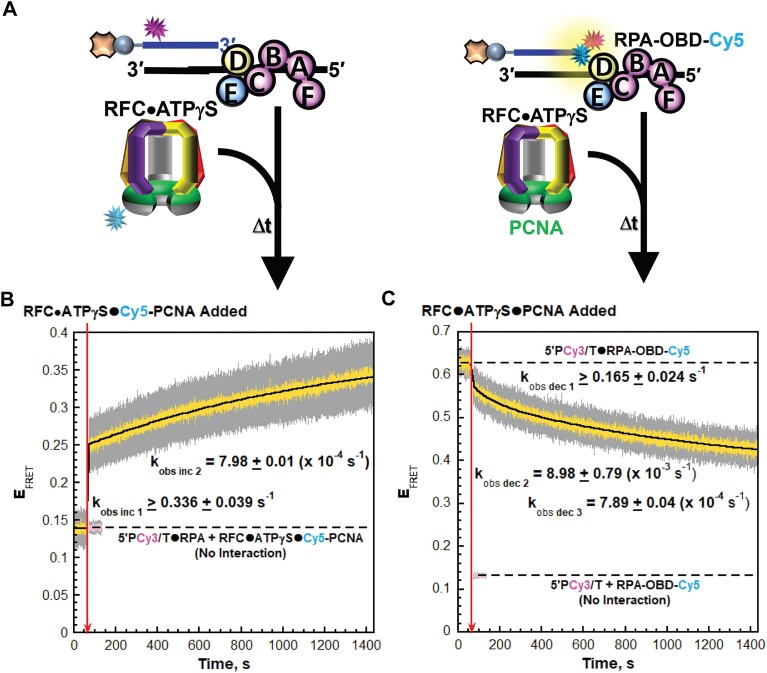
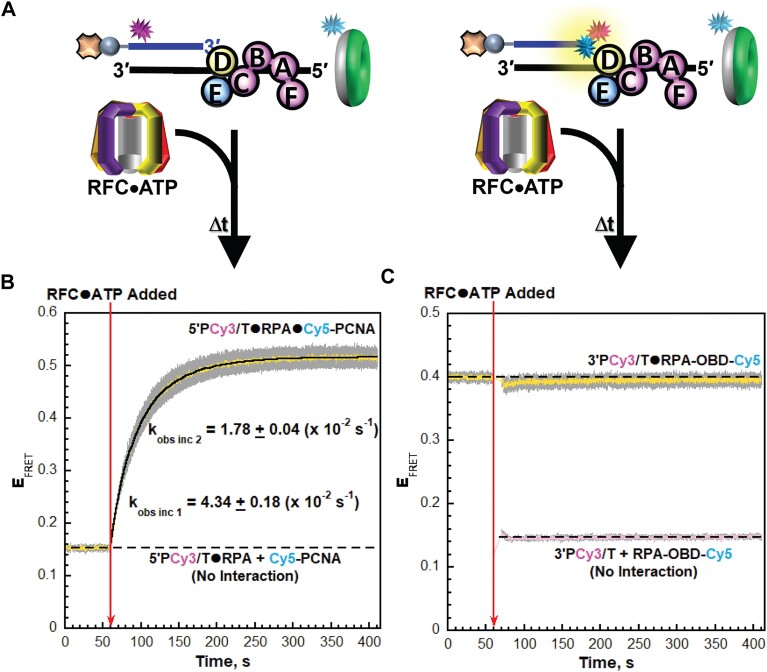
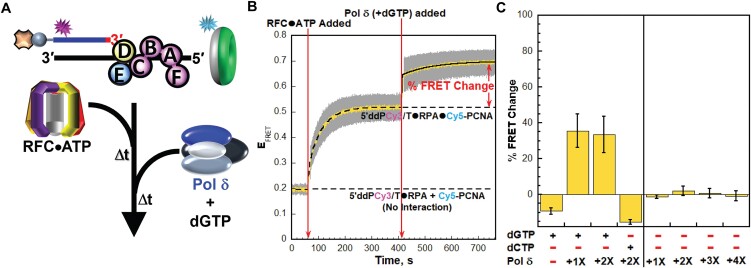
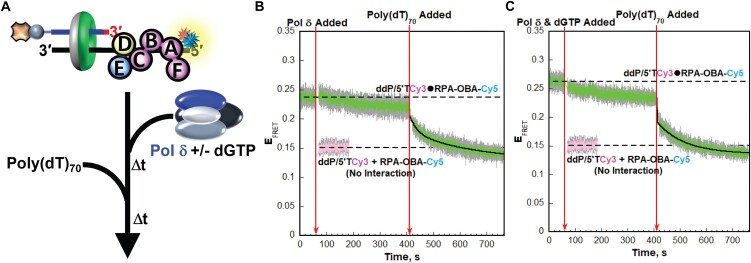
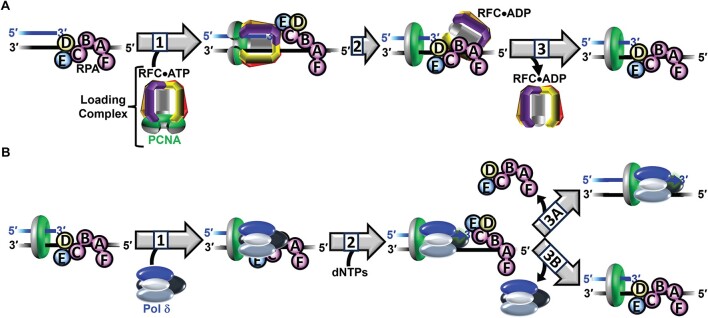
DNA polymerase δ (pol δ) holoenzymes, comprised of pol δ and the processivity sliding clamp, PCNA, carry out DNA synthesis during lagging strand replication, initiation of leading strand replication, and the major DNA damage repair and tolerance pathways. Pol δ holoenzymes are assembled at primer/template (P/T) junctions and initiate DNA synthesis in a stepwise process involving the major single strand DNA (ssDNA)-binding protein complex, RPA, the processivity sliding clamp loader, RFC, PCNA and pol δ. During this process, the interactions of RPA, RFC and pol δ with a P/T junction all significantly overlap. A burning issue that has yet to be resolved is how these overlapping interactions are accommodated during this process. To address this, we design and utilize novel, ensemble FRET assays that continuously monitor the interactions of RPA, RFC, PCNA and pol δ with DNA as pol δ holoenzymes are assembled and initiate DNA synthesis. Results from the present study reveal that RPA remains engaged with P/T junctions throughout this process and the RPA•DNA complexes dynamically re-organize to allow successive binding of RFC and pol δ. These results have broad implications as they highlight and distinguish the functional consequences of dynamic RPA•DNA interactions in RPA-dependent DNA metabolic processes.


Figures

Graphical Abstract
Graphical Abstract
Figure 1.
Figure 1.
Assembly of pol δ holoenzymes and initiation of DNA synthesis. Nascent DNA (primer) and parental DNA (template) strands are blue and black, respectively. RPA subunits are color-coded and depicted to illustrate the OB-folds (A–E). The ‘front’ and ‘back’ faces of PCNA are green and grey, respectively. A P/T junction is pre-engaged by RPA. RFC utilizes ATP to load PCNA onto a P/T junction such that the 'front face' of the clamp is oriented towards the 3′ terminus of the primer strand. Pol δ then engages the 'front face' of loaded PCNA, forming a holoenzyme and initiates DNA synthesis (not shown).
Figure 2.
Figure 2.
RPA1 OBA interactions with template ssDNA downstream of P/T junctions are maintained during binding and activation of loading complexes. (A) Schematic representations of the FRET pairs and experiments to monitor interactions of; (left) loading complexes with P/T junctions engaged by RPA and; (right) RPA1 OBA with P/T junctions during binding and activation of loading complexes (B, C). FRET data. Each EFRET trace is the mean of at least three independent traces with the S.E.M. shown in grey. The time at which the respective loading complexes are added is indicated by a red arrow. (B) FRET data for interactions of loading complexes with P/T junctions engaged by RPA. The EFRET trace observed after addition of the loading complexes is fit to a double exponential rise and the observed rate constants are reported in the graph. The predicted EFRET trace (pink) for no interaction between 5′ddPCy3/T•RPA complexes and loading complexes is offset to the time after the loading complexes are added and fit to a flat line. (C) FRET data for interactions of RPA1 OBA with P/T junctions during binding and activation of loading complexes. The EFRET trace observed prior to the addition of loading complexes is fit to a flat line that is extrapolated to the axis limits. The predicted EFRET trace (pink) for no interaction between RPA-OBA-Cy5 and ddP/5′TCy3 DNA is offset to the time after loading complexes are added and fit to a flat line.
Figure 3.
Figure 3.
RPA1 OBA interactions with template ssDNA downstream of P/T junctions are maintained as RFC•ADP complexes engages and release from RPA. (A) Schematic representation of the FRET pairs and experiments to monitor interactions of; (left) loaded PCNA and RFC•ADP with P/T junctions engaged by RPA and; (right) RPA1 OBA interactions with P/T junctions engaged by loaded PCNA and RFC•ADP. (B, C) FRET data. Each EFRET trace is the mean of at least three independent traces with the S.E.M. shown in grey. The time at which RFC•ATP complexes are added is indicated by a red arrow. (B) FRET data for interactions loaded PCNA and RFC•ADP with P/T junctions engaged by RPA. The EFRET trace observed prior to the addition of RFC•ATP complexes represents the complete absence of interactions between the 5′ddPCy3/T•RPA complexes and Cy5-PCNA and is fit to a flat line that is extrapolated to the axis limits. The EFRET trace observed after the addition of RFC•ATP complexes is fit to a double exponential rise and the observed rate constants are reported in the graph and Supplementary Table S1. (C) FRET data for interactions of RPA1 OBA with P/T junctions engaged by loaded PCNA and RFC•ADP. The EFRET trace observed prior to the addition of the RFC•ATP complexes is fit to a flat line that is extrapolated to the axis limits. The predicted EFRET trace (pink) for no interaction between RPA-OBA-Cy5 and ddP/5′TCy3 DNA is offset to the time after RFC•ATP complexes are added and fit to a flat line.
Figure 4.
Figure 4.
RPA2 OBD releases from P/T junctions during binding and activation of loading complexes. (A) Schematic representations of the FRET pairs and experiments to monitor interactions of; (left) loading complexes with P/T junctions engaged by RPA and; (right) RPA2 OBD with P/T junctions during binding and activation of loading complexes. (B, C) FRET data. Each EFRET trace is the mean of at least three independent traces with the S.E.M. shown in grey. The time at which the respective loading complexes are added is indicated by a red arrow. (B) FRET data for interactions of loading complexes with P/T junctions engaged by RPA. The EFRET trace observed after addition of the respective loading complexes is fit to a double exponential rise and the observed rate constants are reported in the graph. The predicted EFRET trace (pink) for no interaction between 5P′Cy3/T•RPA complexes and the loading complexes is offset to the time after the loading complexes are added and fit to a flat line. (C) FRET data for interactions of RPA2 OBD with P/T junctions during binding and activation of loading complexes. The EFRET trace observed prior to addition of the respective loading complexes is fit to a flat line that is extrapolated to the axis limits. The predicted EFRET trace (pink) for no interaction between RPA-OBD-Cy5 and the P/5′TCy3 DNA is offset to the time after loading complexes are added and fit to a flat line.
Figure 5.
Figure 5.
RPA2 OBD interactions with P/T junctions are re-established prior to and much faster than release of RFC•ADP complexes. (A) Schematic representation of the FRET pairs and experiments to monitor interactions of; (left) loaded PCNA and RFC•ADP complexes with P/T junctions engaged by RPA and; (right) RPA2 OBD interactions with P/T junctions engaged by loaded PCNA and RFC•ADP complexes. (B, C) FRET data. Each EFRET trace is the mean of at least three independent traces with the S.E.M. shown in grey. The time at which the RFC•ATP complexes are added is indicated by a red arrow. (B) FRET data for interactions of loaded PCNA and RFC•ADP complexes with P/T junctions engaged by RPA. The EFRET trace observed prior to the addition of RFC•ATP complexes represents the complete absence of interactions between 5′PCy3/T•RPA complexes and Cy5-PCNA and is fit to flat line that is extrapolated to the axis limits. The EFRET trace observed after the addition of RFC•ATP complexes is fit to a double exponential rise and the observed rate constants are reported in the graph and Supplementary Table S1. (C) FRET data for interactions of RPA2 OBD with P/T junctions engaged by loaded PCNA and RFC•ADP complexes. The EFRET trace observed prior to the addition of RFC•ATP complexes is fit to a flat line that is extrapolated to the axis limits. The predicted EFRET trace (pink) for no interaction between RPA-OBD-Cy5 and the 3′PCy3/T DNA is offset to the time after RFC•ATP complexes are added and fit to a flat line.
Figure 6.
Figure 6.
Adoption of the initiation states of pol δ holoenzymes tethers the engaged PCNA closer to the 5′ end of primer strands. (A) Schematic representation of the FRET pair and experiment to monitor interactions of loaded PCNA with P/T junctions during formation of pol δ holoenzymes and initiation of DNA synthesis (B) FRET data for experiments performed with dGTP. Each EFRET trace is the mean of at least three independent traces with the S.E.M. shown in grey. The times at which the RFC•ATP complexes and Pol δ (+ dGTP) are added are indicated by red arrows. The EFRET trace observed prior to the addition of RFC•ATP complexes is fit to a dashed flat line that is extrapolated to the axis limits to depict the average EFRET value for no interaction between Cy5-PCNA and the 5′ddPCy3/T•RPA complexes. The EFRET trace observed after the addition of RFC•ATP complexes is fit to a dashed double exponential rise that is extrapolated to the axis limits to depict the average EFRET value for complete loading of Cy5-PCNA onto the 5′ddPCy3/T•RPA•Cy5-PCNA complexes. The EFRET traces observed after the addition of Pol δ (+ dGTP) is fit to a double exponential rise and the % FRET is depicted in red. (C) Characterization of the observed % FRET change. FRET experiments were repeated in the presence/absence of a dNTP (either dGTP or dCTP) and with varying concentrations of Pol δ (0–100 nM heterotetramer) and the % FRET change observed upon the ultimate addition was measured. Each column is the mean of at least three independent replicates with the S.E.M. shown in black.
Figure 7.
Figure 7.
RPA remains engaged with P/T junctions throughout formation of the resident pol δ holoenzymes and initiation of DNA synthesis. (A) Schematic representation of the FRET pair and experiment to monitor interactions of RPA-OBA with P/T junctions during formation of pol δ holoenzymes and initiation of DNA synthesis. (B, C) FRET data. Each EFRET trace is the mean of at least three independent traces with the S.E.M. shown in grey. The times at which the Pol δ (±dGTP) and poly(dT)70 are added are indicated by red arrows. The EFRET trace observed prior to the addition of the Pol δ (±dGTP) is fit to a dashed flat line that is extrapolated to the axis limits to depict the average EFRET value for the interaction between RPA-OBA-Cy5 and ddP/5′TCy3. The predicted EFRET trace (pink) for no interaction between RPA-OBA-Cy5 and the ddP/5′TCy3 DNA is fit to a flat line that is extrapolated to the axis limits. The EFRET trace observed after the addition of the poly(dT)70 is fit to a double exponential decline. Shown in panels B and C are the results for experiments carried out in the absence and presence of dGTP, respectively.
Figure 8.
Figure 8.
Stepwise assembly of the human Pol δ holoenzyme and initiation of DNA synthesis. (A) PCNA loading. 1) Binding and activation of a loading complex at a P/T junction. 2) Hydrolysis of ATP by RFC (within activated loading complex). 3) Release of RFC•ADP into solution. (B) Initiation of DNA synthesis. 1) Formation of a pol δ holoenzyme. 2) Initiation of DNA synthesis. 3A) Processive dNTP incorporation. 3B) Dissociation of pol δ following initial dNTP incorporation.

Similar articles

Cited by

References

    1. Zhou Z.X., Lujan S.A., Burkholder A.B., Garbacz M.A., Kunkel T.A. Roles for DNA polymerase delta in initiating and terminating leading strand DNA replication. Nat. Commun. 2019; 10:3992. - PMC - PubMed
    1. Hedglin M., Benkovic S.J. Eukaryotic translesion DNA synthesis on the leading and lagging strands: unique detours around the same obstacle. Chem. Rev. 2017; 117:7857–7877. - PMC - PubMed
    1. Robertson A.B., Klungland A., Rognes T., Leiros I. DNA repair in mammalian cells: base excision repair: the long and short of it. Cell. Mol. Life Sci. 2009; 66:981–993. - PMC - PubMed
    1. Spivak G. Nucleotide excision repair in humans. DNA Repair (Amst.). 2015; 36:13–18. - PMC - PubMed
    1. Donnianni R.A., Zhou Z.X., Lujan S.A., Al-Zain A., Garcia V., Glancy E., Burkholder A.B., Kunkel T.A., Symington L.S. DNA polymerase delta synthesizes both strands during break-induced replication. Mol. Cell. 2019; 76:371–381. - PMC - PubMed

MeSH terms

LinkOut - more resources